Hemoglobin Derived from Subarachnoid Hemorrhage-Induced Pyroptosis of Neural Stem Cells via ROS/NLRP3/GSDMD Pathway
- PMID: 36703912
- PMCID: PMC9871413
- DOI: 10.1155/2023/4383332
Hemoglobin Derived from Subarachnoid Hemorrhage-Induced Pyroptosis of Neural Stem Cells via ROS/NLRP3/GSDMD Pathway
Abstract
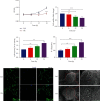
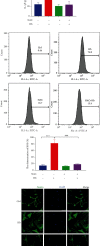
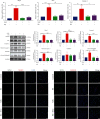
Accumulating evidence has demonstrated that neural stem cells (NSCs) have regenerative capacity after brain injuries, such as in aneurysmal subarachnoid hemorrhage (SAH). The reactive oxygen species (ROS)-induced NOD-like receptor thermal protein domain associated protein 3 (NLRP3) inflammasome triggers inflammatory responses and pyroptosis of cells; however, whether ROS-induced neuroinflammation modulates the fate of endogenous NSCs after SAH remains largely unknown. In this study, the level of IL-1β was increased in the cerebrospinal fluid (CSF) of patients with SAH. In an endovascular perforation model of SAH in mice, the secretion of IL-1β increased to a peak at 24 h following SAH, and the expression of Caspase1 and NLRP3 was elevated in the hippocampus. Primary cultured NSCs were incubated with hemoglobin (Hb) to mimic SAH in vitro. The cell viability, LDH release, intracellular ROS levels, scanning electron microscopy (SEM), and the expression of NLRP3 and pyroptosis indicators (GSDMD, ASC, and Caspase-1) in NSCs after SAH were examined to investigate the process of pyroptosis. We found that pyroptotic death featuring cellular swelling, cell membrane pore formation and elevated IL-1β was increased in cultured primary NSCs after Hb treatment, as was the expression of NLRP3, ASC, Caspase-1, and GSDMD. In addition, we found that ROS-induced pyroptosis of NSCs by activating the NLRP3/GSDMD pathway. These findings suggest that pyroptosis of NSCs induced by Hb can impede neural regeneration after SAH.
Copyright © 2023 Tingting Yue et al.
Conflict of interest statement
The authors have declared that they have no conflicts of interest.
Figures


Similar articles
-
TAK1 mediates neuronal pyroptosis in early brain injury after subarachnoid hemorrhage.J Neuroinflammation. 2021 Aug 30;18(1):188. doi: 10.1186/s12974-021-02226-8. J Neuroinflammation. 2021. PMID: 34461942 Free PMC article.
-
Hydrogen-Rich Saline Attenuated Subarachnoid Hemorrhage-Induced Early Brain Injury in Rats by Suppressing Inflammatory Response: Possible Involvement of NF-κB Pathway and NLRP3 Inflammasome.Mol Neurobiol. 2016 Jul;53(5):3462-3476. doi: 10.1007/s12035-015-9242-y. Epub 2015 Jun 20. Mol Neurobiol. 2016. PMID: 26091790
-
Inhibition of AIM2 inflammasome activation alleviates GSDMD-induced pyroptosis in early brain injury after subarachnoid haemorrhage.Cell Death Dis. 2020 Jan 30;11(1):76. doi: 10.1038/s41419-020-2248-z. Cell Death Dis. 2020. PMID: 32001670 Free PMC article.
-
Pyroptosis in platelets: Thrombocytopenia and inflammation.J Clin Lab Anal. 2023 Apr;37(4):e24852. doi: 10.1002/jcla.24852. Epub 2023 Feb 28. J Clin Lab Anal. 2023. PMID: 36852778 Free PMC article. Review.
-
Anticancer mechanisms on pyroptosis induced by Oridonin: New potential targeted therapeutic strategies.Biomed Pharmacother. 2023 Sep;165:115019. doi: 10.1016/j.biopha.2023.115019. Epub 2023 Jun 15. Biomed Pharmacother. 2023. PMID: 37329709 Review.
Cited by
-
Cerebrospinal fluid analysis and changes over time in patients with subarachnoid hemorrhage: a prospective observational study.J Anesth Analg Crit Care. 2025 Jun 12;5(1):31. doi: 10.1186/s44158-025-00250-1. J Anesth Analg Crit Care. 2025. PMID: 40506779 Free PMC article.
-
Mechanisms and interventions in aneurysmal subarachnoid hemorrhage: Unraveling the role of inflammatory responses and cell death in early brain injury (Review).Mol Med Rep. 2025 Sep;32(3):256. doi: 10.3892/mmr.2025.13621. Epub 2025 Jul 19. Mol Med Rep. 2025. PMID: 40682857 Free PMC article. Review.
-
Therapeutic potential of stem cells in subarachnoid hemorrhage.Neural Regen Res. 2025 Apr 1;20(4):936-945. doi: 10.4103/NRR.NRR-D-24-00124. Epub 2024 May 17. Neural Regen Res. 2025. PMID: 38989928 Free PMC article.
-
Neuroinflammation Targeting Pyroptosis: Molecular Mechanisms and Therapeutic Perspectives in Stroke.Mol Neurobiol. 2024 Oct;61(10):7448-7465. doi: 10.1007/s12035-024-04050-6. Epub 2024 Feb 22. Mol Neurobiol. 2024. PMID: 38383921 Review.
References
-
- Vergouwen M. D., Vermeulen M., van Gijn J., et al. Definition of delayed cerebral ischemia after aneurysmal subarachnoid hemorrhage as an outcome event in clinical trials and observational studies: proposal of a multidisciplinary research group. Stroke . 2010;41(10):2391–2395. doi: 10.1161/STROKEAHA.110.589275. - DOI - PubMed
MeSH terms
Substances
LinkOut - more resources
Full Text Sources
Miscellaneous

