

Changes in hemodynamic response function components reveal specific changes in neurovascular coupling in type 2 diabetes
- PMID: 36703928
- PMCID: PMC9872943
- DOI: 10.3389/fphys.2022.1101470
Changes in hemodynamic response function components reveal specific changes in neurovascular coupling in type 2 diabetes
Abstract
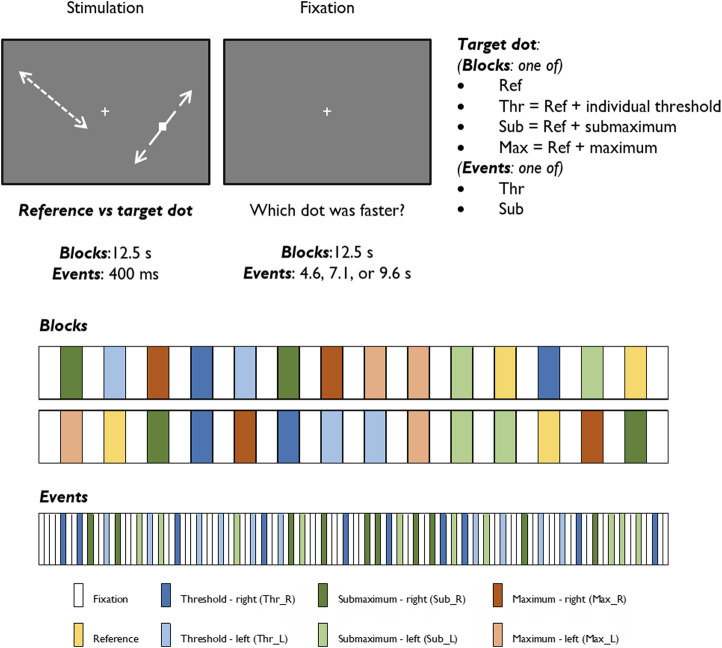
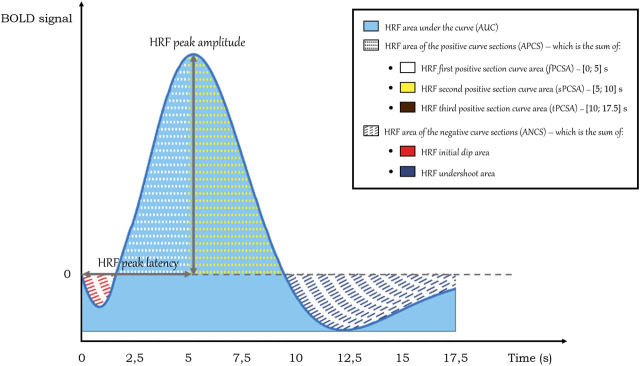
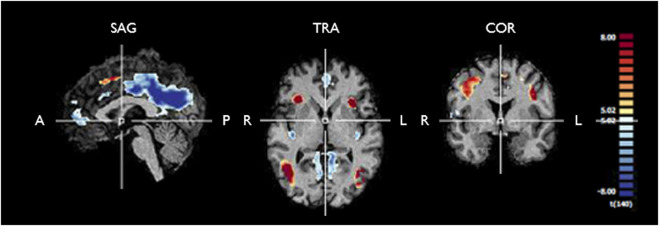
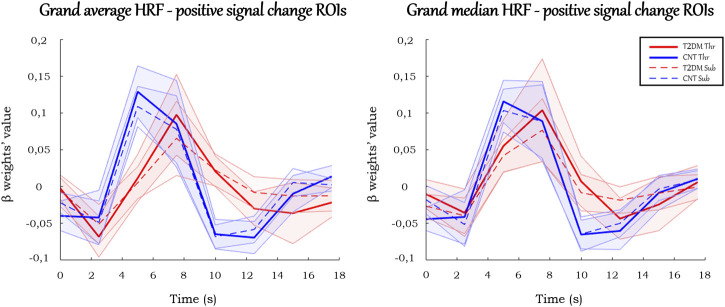
Type 2 Diabetes Mellitus (T2DM) is a metabolic disease that leads to multiple vascular complications with concomitant changes in human neurophysiology, which may lead to long-term cognitive impairment, and dementia. Early impairments of neurovascular coupling can be studied using event-related functional magnetic resonance imaging (fMRI) designs. Here, we aimed to characterize the changes in the hemodynamic response function (HRF) in T2DM to probe components from the initial dip to late undershoot. We investigated whether the HRF morphology is altered throughout the brain in T2DM, by extracting several parameters of the fMRI response profiles in 141 participants (64 patients with T2DM and 77 healthy controls) performing a visual motion discrimination task. Overall, the patients revealed significantly different HRFs, which extended to all brain regions, suggesting that this is a general phenomenon. The HRF in T2DM was found to be more sluggish, with a higher peak latency and lower peak amplitude, relative slope to peak, and area under the curve. It also showed a pronounced initial dip, suggesting that the initial avidity for oxygen is not compensated for, and an absent or less prominent but longer undershoot. Most HRF parameters showed a higher dispersion and variability in T2DM. In sum, we provide a definite demonstration of an impaired hemodynamic response function in the early stages of T2DM, following a previous suggestion of impaired neurovascular coupling. The quantitative demonstration of a significantly altered HRF morphology in separate response phases suggests an alteration of distinct physiological mechanisms related to neurovascular coupling, which should be considered in the future to potentially halt the deterioration of the brain function in T2DM.
Keywords: BOLD signal; brain imaging; cerebral hemodynamics; diabetes; fMRI; hemodynamic response function; neurovascular coupling.
Copyright © 2023 Duarte, Guerra, Moreno, Gomes and Castelo-Branco.
Conflict of interest statement
The authors declare that the research was conducted in the absence of any commercial or financial relationships that could be construed as a potential conflict of interest.
Figures
Similar articles
-
Early disrupted neurovascular coupling and changed event level hemodynamic response function in type 2 diabetes: an fMRI study.J Cereb Blood Flow Metab. 2015 Oct;35(10):1671-80. doi: 10.1038/jcbfm.2015.106. Epub 2015 Jun 10. J Cereb Blood Flow Metab. 2015. PMID: 26058698 Free PMC article.
-
Arterial impulse model for the BOLD response to brief neural activation.Neuroimage. 2016 Jan 1;124(Pt A):394-408. doi: 10.1016/j.neuroimage.2015.08.068. Epub 2015 Sep 10. Neuroimage. 2016. PMID: 26363350 Free PMC article.
-
Characterization of the blood oxygen level dependent hemodynamic response function in human subcortical regions with high spatiotemporal resolution.Front Neurosci. 2022 Oct 11;16:1009295. doi: 10.3389/fnins.2022.1009295. eCollection 2022. Front Neurosci. 2022. PMID: 36303946 Free PMC article.
-
Impairment of neurovascular coupling in the hippocampus due to decreased nitric oxide bioavailability supports early cognitive dysfunction in type 2 diabetic rats.Free Radic Biol Med. 2022 Nov 20;193(Pt 2):669-675. doi: 10.1016/j.freeradbiomed.2022.11.009. Epub 2022 Nov 11. Free Radic Biol Med. 2022. PMID: 36372286 Review.
-
Modeling the hemodynamic response to brain activation.Neuroimage. 2004;23 Suppl 1:S220-33. doi: 10.1016/j.neuroimage.2004.07.013. Neuroimage. 2004. PMID: 15501093 Review.
Cited by
-
Irreversible atrophy in memory brain regions over 7 years is predicted by glycemic control in type 2 diabetes without mild cognitive impairment.Front Aging Neurosci. 2024 Mar 25;16:1367563. doi: 10.3389/fnagi.2024.1367563. eCollection 2024. Front Aging Neurosci. 2024. PMID: 38590757 Free PMC article.
-
The hemodynamic response function as a type 2 diabetes biomarker: a data-driven approach.Front Neuroinform. 2024 Jan 5;17:1321178. doi: 10.3389/fninf.2023.1321178. eCollection 2023. Front Neuroinform. 2024. PMID: 38250018 Free PMC article.
-
Functional reorganization of memory processing in the hippocampus is associated with neuroprotector GLP-1 levels in type 2 diabetes.Heliyon. 2024 Mar 3;10(6):e27412. doi: 10.1016/j.heliyon.2024.e27412. eCollection 2024 Mar 30. Heliyon. 2024. PMID: 38509913 Free PMC article.
-
SAD: semi-supervised automatic detection of BOLD activations in high temporal resolution fMRI data.MAGMA. 2024 Dec;37(6):1031-1046. doi: 10.1007/s10334-024-01197-0. Epub 2024 Aug 29. MAGMA. 2024. PMID: 39207582 Free PMC article.
-
Neural dynamics of delayed feedback in robot teleoperation: insights from fNIRS analysis.Front Hum Neurosci. 2024 Jun 17;18:1338453. doi: 10.3389/fnhum.2024.1338453. eCollection 2024. Front Hum Neurosci. 2024. PMID: 38952645 Free PMC article.
References
LinkOut - more resources
Full Text Sources