

Detection of astrocytic slow oscillatory activity and response to seizurogenic compounds using planar microelectrode array
- PMID: 36703996
- PMCID: PMC9872017
- DOI: 10.3389/fnins.2022.1050150
Detection of astrocytic slow oscillatory activity and response to seizurogenic compounds using planar microelectrode array
Abstract
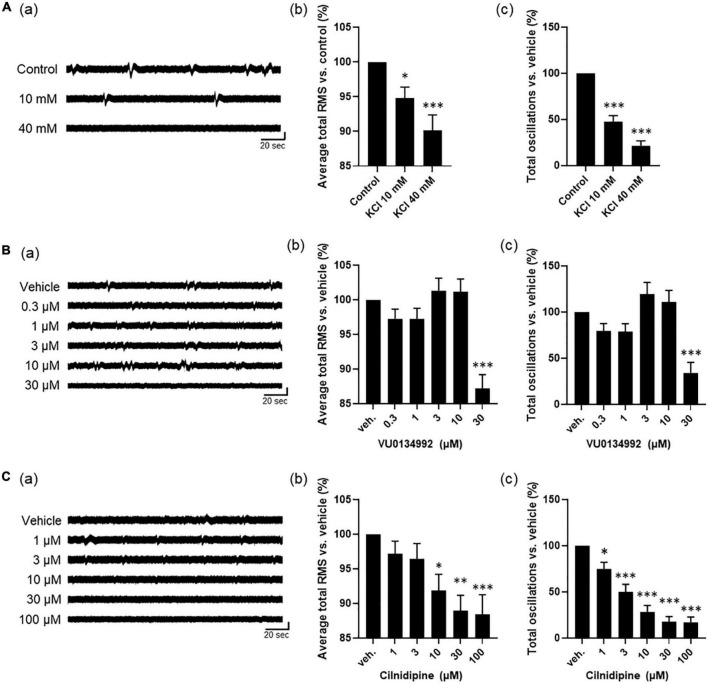
Since the development of the planar microelectrode array (MEA), it has become popular to evaluate compounds based on the electrical activity of rodent and human induced pluripotent stem cell (iPSC)-derived neurons. However, there are no reports recording spontaneous human astrocyte activity from astrocyte-only culture sample by MEA. It is becoming clear that astrocytes play an important role in various neurological diseases, and astrocytes are expected to be excellent candidates for targeted therapeutics for the treatment of neurological diseases. Therefore, measuring astrocyte activity is very important for drug development for astrocytes. Recently, astrocyte activity has been found to be reflected in the low-frequency band < 1 Hz, which is much lower than the frequency band for recording neural activity. Here, we separated the signals obtained from human primary astrocytes cultured on MEA into seven frequency bands and successfully recorded the extracellular electrical activity of human astrocytes. The slow waveforms of spontaneous astrocyte activity were observed most clearly in direct current potentials < 1 Hz. We established nine parameters to assess astrocyte activity and evaluated five seizurogenic drug responses in human primary astrocytes and human iPSC-derived astrocytes. Astrocytes demonstrated the most significant dose-dependent changes in pilocarpine. Furthermore, in a principal component analysis using those parameter sets, the drug responses to each seizurogenic compound were separated. In this paper, we report the spontaneous electrical activity measurement of astrocytes alone using MEA for the first time and propose that the MEA measurement focusing on the low-frequency band could be useful as one of the methods to assess drug response in vitro.
Keywords: MEA - microelectrode array; astrocyte; culture; human; iPSC (induced pluripotent stem cell); seizure; slow-oscilatory activity; toxicology.
Copyright © 2023 Kuroda, Matsuda, Ishibashi and Suzuki.
Conflict of interest statement
The authors declare that the research was conducted in the absence of any commercial or financial relationships that could be construed as a potential conflict of interest.
Figures


Similar articles
-
Verification of the seizure liability of compounds based on their in vitro functional activity in cultured rat cortical neurons and co-cultured human iPSC-derived neurons with astrocytes and in vivo extrapolation to cerebrospinal fluid concentration.Toxicol Appl Pharmacol. 2023 Oct 1;476:116675. doi: 10.1016/j.taap.2023.116675. Epub 2023 Sep 1. Toxicol Appl Pharmacol. 2023. PMID: 37661062
-
[Method for MEA Data Analysis of Drug-treated Rat Primary Neurons and Human iPSC-derived Neurons to Evaluate the Risk of Drug-induced Seizures].Yakugaku Zasshi. 2018;138(6):823-828. doi: 10.1248/yakushi.17-00213-3. Yakugaku Zasshi. 2018. PMID: 29863054 Review. Japanese.
-
Evaluation of neurotoxicity for pesticide-related compounds in human iPS cell-derived neurons using microelectrode array.Toxicol In Vitro. 2023 Dec;93:105668. doi: 10.1016/j.tiv.2023.105668. Epub 2023 Aug 24. Toxicol In Vitro. 2023. PMID: 37633473
-
Long-term electrophysiological activity and pharmacological response of a human induced pluripotent stem cell-derived neuron and astrocyte co-culture.Biochem Biophys Res Commun. 2014 Jan 24;443(4):1176-81. doi: 10.1016/j.bbrc.2013.12.142. Epub 2014 Jan 7. Biochem Biophys Res Commun. 2014. PMID: 24406164
-
Multielectrode Arrays for Functional Phenotyping of Neurons from Induced Pluripotent Stem Cell Models of Neurodevelopmental Disorders.Biology (Basel). 2022 Feb 16;11(2):316. doi: 10.3390/biology11020316. Biology (Basel). 2022. PMID: 35205182 Free PMC article. Review.
Cited by
-
Machine Learning Technology for EEG-Forecast of the Blood-Brain Barrier Leakage and the Activation of the Brain's Drainage System during Isoflurane Anesthesia.Biomolecules. 2023 Nov 2;13(11):1605. doi: 10.3390/biom13111605. Biomolecules. 2023. PMID: 38002287 Free PMC article.
-
Non-Invasive and Long-Term Electrophysiological Monitoring Sensors for Cerebral Organoids Differentiation.Biosensors (Basel). 2025 Mar 7;15(3):173. doi: 10.3390/bios15030173. Biosensors (Basel). 2025. PMID: 40136970 Free PMC article.
-
Advances in the Electrophysiological Recordings of Long-Term Potentiation.Int J Mol Sci. 2023 Apr 12;24(8):7134. doi: 10.3390/ijms24087134. Int J Mol Sci. 2023. PMID: 37108295 Free PMC article. Review.
References
LinkOut - more resources
Full Text Sources