

Changes in the microbiota in different intestinal segments of mice with sepsis
- PMID: 36704101
- PMCID: PMC9871835
- DOI: 10.3389/fcimb.2022.954347
Changes in the microbiota in different intestinal segments of mice with sepsis
Abstract
Introduction: The small intestine, as the main digestion and absorption site of the gastrointestinal tract, is often overlooked in studies, and the overall microbiota does not reflect the makeup of the microbiota in different segments of the intestine. Therefore, we aimed to exclude the influence of routine ICU treatment measures on sepsis patients and observed changes in the diversity and abundance of gut microbiota in different intestinal segments of septic mice.
Methods: The mice were randomly divided into the CLP6h group and the sham group. The contents of the colon and small intestine of the experimental group and the control group were collected after 6 h.
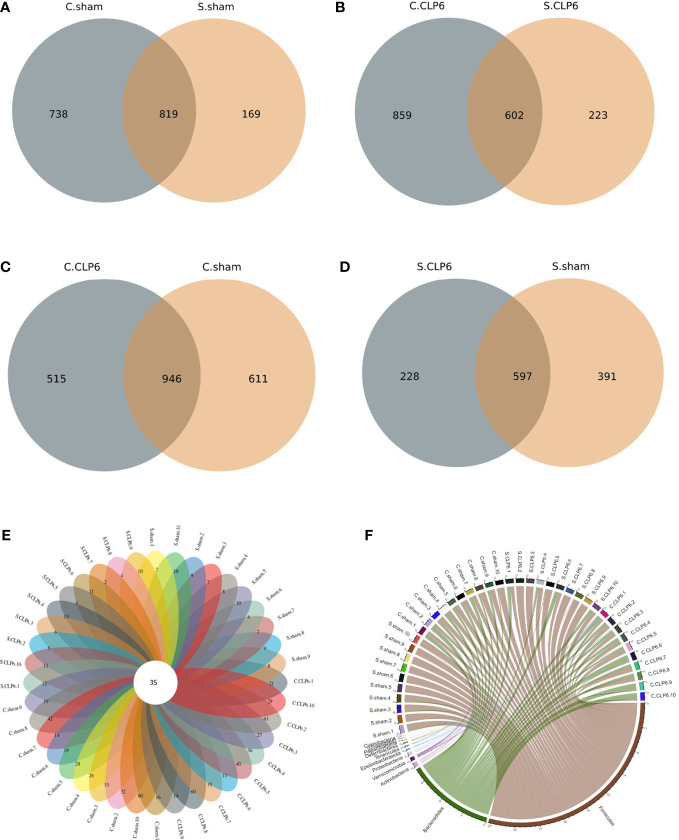
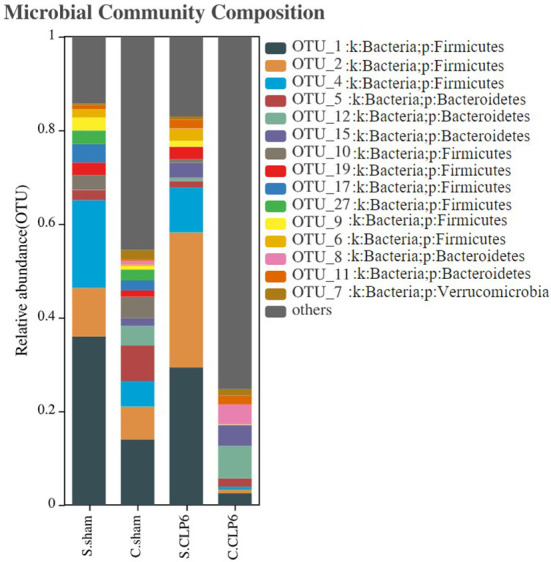
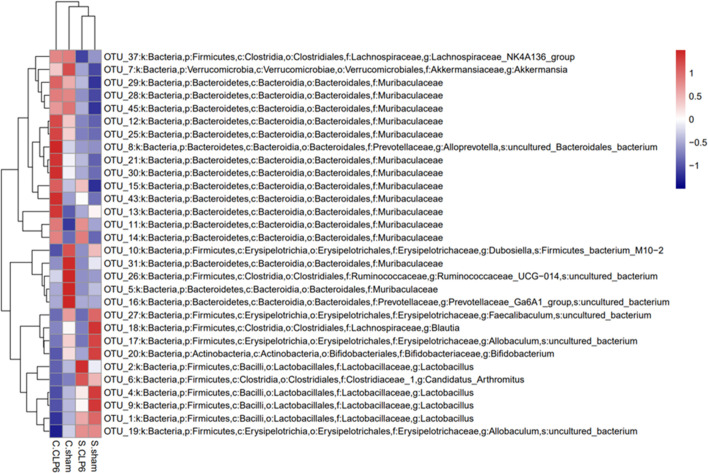
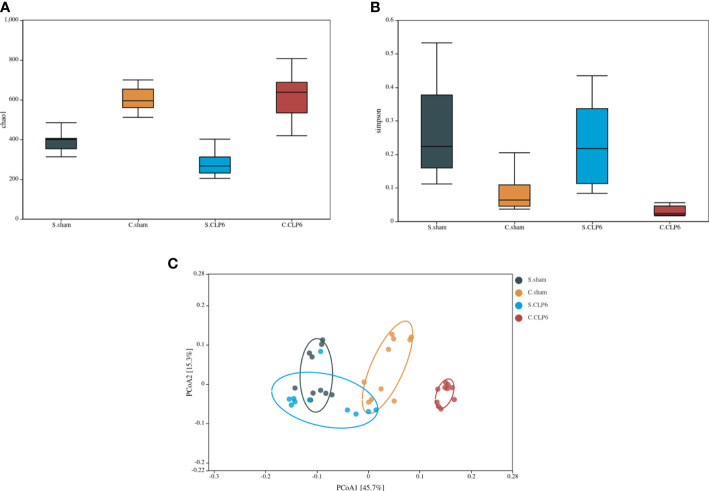
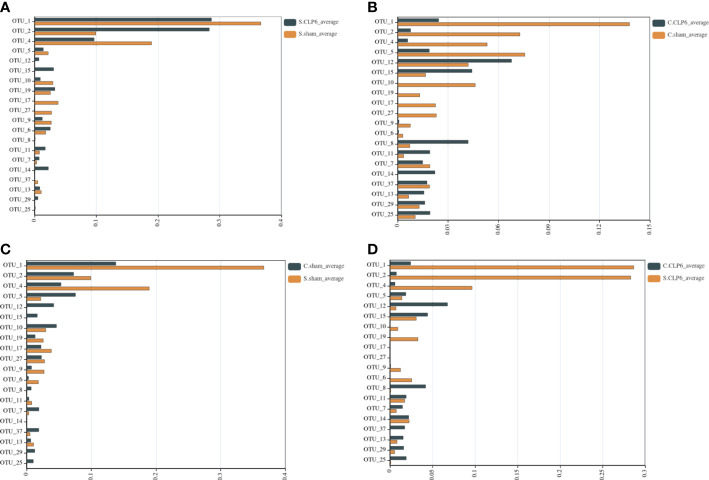
Results: After CLP, the number and structure of the gut microbiota in the colon changed most obviously, among which Bacteroidetes had the most significant changes. Akkermansia, D.Firmicutes_bacterium_M10_2, Blautia, Bifidobacterium, Lactobacillus, Candidatus_Arthromitus, and Muribaculaceae were changed in the colon. Lactobacillus, Bifidobacterium, Akkermansia, Blautia, Candidatus_Arthromitus, and Lachnospiraceae_NK4A136_group were changed in the small intestine.
Discussion: Our experiment found that there were different numbers of unique and common gut microbiota in the small intestine and colon after sepsis, and the gut microbiota of the colon changed more drastically after sepsis than the small intestine. Thus, we should focus on protective gut microbiota and mucin-degrading microbes. We hope that these results will provide help for sepsis treatment in the future.
Keywords: Akkermansia; Lachnospiraceae_NK4A136_group; Muribaculaceae; gut microbiota; mucin-degrading microbes; sepsis.
Copyright © 2023 Peng, Wei, Jia, Luan, Man, Ma, Luo, Li, Li, Wang, Wang, Zhou, Ji, Mu, Wang, Wang, Zhang, Yu, Zhao and Wang.
Conflict of interest statement
The authors declare that the research was conducted in the absence of any commercial or financial relationships that could be construed as a potential conflict of interest.
Figures

Similar articles
-
Characterization and comparison of the bacterial microbiota in different gastrointestinal tract compartments of Mongolian horses.Microbiologyopen. 2020 Jun;9(6):1085-1101. doi: 10.1002/mbo3.1020. Epub 2020 Mar 9. Microbiologyopen. 2020. PMID: 32153142 Free PMC article.
-
Lactobacillus rhamnosus GG treatment improves intestinal permeability and modulates microbiota dysbiosis in an experimental model of sepsis.Int J Mol Med. 2019 Mar;43(3):1139-1148. doi: 10.3892/ijmm.2019.4050. Epub 2019 Jan 7. Int J Mol Med. 2019. PMID: 30628657 Free PMC article.
-
Gut microbiota disorder caused by diterpenoids extracted from Euphorbia pekinensis aggravates intestinal mucosal damage.Pharmacol Res Perspect. 2021 Oct;9(5):e00765. doi: 10.1002/prp2.765. Pharmacol Res Perspect. 2021. PMID: 34523246 Free PMC article.
-
Gut Microbiota and Its Repercussion in Parkinson's Disease: A Systematic Review in Occidental Patients.Neurol Int. 2023 Jun 13;15(2):750-763. doi: 10.3390/neurolint15020047. Neurol Int. 2023. PMID: 37368331 Free PMC article. Review.
-
Dysbiotic events in gut microbiota: impact on human health.Nutrients. 2014 Dec 11;6(12):5786-805. doi: 10.3390/nu6125786. Nutrients. 2014. PMID: 25514560 Free PMC article. Review.
Cited by
-
A Mendelian Randomization Study: Roles of Gut Microbiota in Sepsis - Who is the Angle?Pol J Microbiol. 2024 Mar 4;73(1):49-57. doi: 10.33073/pjm-2024-006. eCollection 2024 Mar 1. Pol J Microbiol. 2024. PMID: 38437468 Free PMC article.
-
The causality of gut microbiota on onset and progression of sepsis: a bi-directional Mendelian randomization analysis.Front Immunol. 2024 Apr 18;15:1266579. doi: 10.3389/fimmu.2024.1266579. eCollection 2024. Front Immunol. 2024. PMID: 38698853 Free PMC article.
-
IgA and the gut-vagina axis.Front Immunol. 2025 Apr 17;16:1547303. doi: 10.3389/fimmu.2025.1547303. eCollection 2025. Front Immunol. 2025. PMID: 40313960 Free PMC article. No abstract available.
-
Microbiome-mediated colonization resistance to carbapenem-resistant Klebsiella pneumoniae in ICU patients.NPJ Biofilms Microbiomes. 2025 Aug 9;11(1):157. doi: 10.1038/s41522-025-00791-x. NPJ Biofilms Microbiomes. 2025. PMID: 40783567 Free PMC article.
References
Publication types
MeSH terms
LinkOut - more resources
Full Text Sources
Medical
Miscellaneous