

Validation of carbon isotopologue distribution measurements by GC-MS and application to 13C-metabolic flux analysis of the tricarboxylic acid cycle in Brassica napus leaves
- PMID: 36704152
- PMCID: PMC9871494
- DOI: 10.3389/fpls.2022.885051
Validation of carbon isotopologue distribution measurements by GC-MS and application to 13C-metabolic flux analysis of the tricarboxylic acid cycle in Brassica napus leaves
Abstract
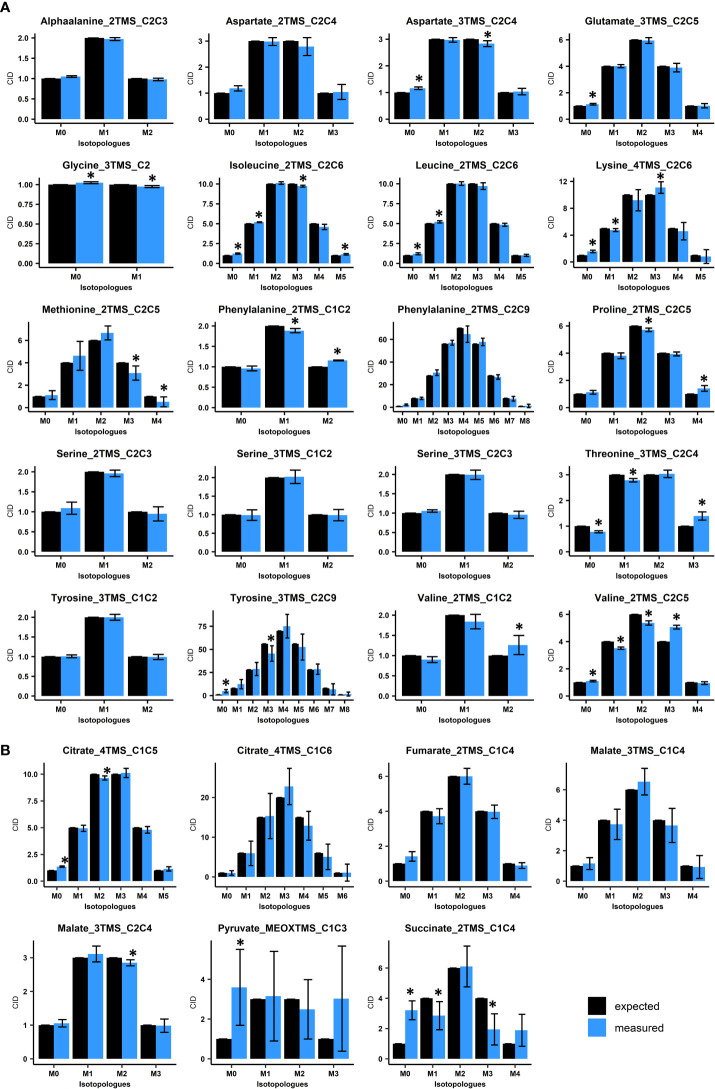
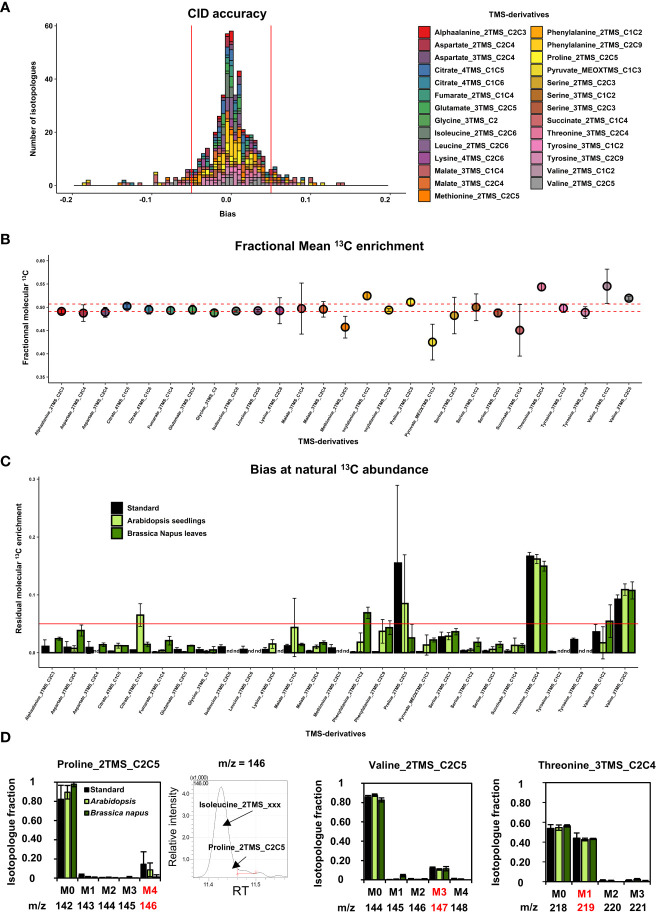
The estimation of metabolic fluxes in photosynthetic organisms represents an important challenge that has gained interest over the last decade with the development of 13C-Metabolic Flux Analysis at isotopically non-stationary steady-state. This approach requires a high level of accuracy for the measurement of Carbon Isotopologue Distribution in plant metabolites. But this accuracy has still not been evaluated at the isotopologue level for GC-MS, leading to uncertainties for the metabolic fluxes calculated based on these fragments. Here, we developed a workflow to validate the measurements of CIDs from plant metabolites with GC-MS by producing tailor-made E. coli standard extracts harboring a predictable binomial CID for some organic and amino acids. Overall, most of our TMS-derivatives mass fragments were validated with these standards and at natural isotope abundance in plant matrices. Then, we applied this validated MS method to investigate the light/dark regulation of plant TCA cycle by incorporating U-13C-pyruvate to Brassica napus leaf discs. We took advantage of pathway-specific isotopologues/isotopomers observed between two and six hours of labeling to show that the TCA cycle can operate in a cyclic manner under both light and dark conditions. Interestingly, this forward cyclic flux mode has a nearly four-fold higher contribution for pyruvate-to-citrate and pyruvate-to-malate fluxes than the phosphoenolpyruvate carboxylase (PEPc) flux reassimilating carbon derived from some mitochondrial enzymes. The contribution of stored citrate to the mitochondrial TCA cycle activity was also questioned based on dynamics of 13C-enrichment in citrate, glutamate and succinate and variations of citrate total amounts under light and dark conditions. Interestingly, there was a light-dependent 13C-incorporation into glycine and serine showing that decarboxylations from pyruvate dehydrogenase complex and TCA cycle enzymes were actively reassimilated and could represent up to 5% to net photosynthesis.
Keywords: Krebs cycle; TCA cycle; accuracy; isotope C distribution 13; phosphoenol pyruvate carboxylase; plant; pyruvate dehydrogenase complex (PDC); trimethylsilyl derivatives (TMS).
Copyright © 2023 Dellero, Berardocco, Berges, Filangi and Bouchereau.
Conflict of interest statement
The authors declare that the research was conducted in the absence of any commercial or financial relationships that could be construed as a potential conflict of interest. The handling editor is currently organizing a Research Topic with the author YD.
Figures


Similar articles
-
Evaluation of GC/MS-Based 13C-Positional Approaches for TMS Derivatives of Organic and Amino Acids and Application to Plant 13C-Labeled Experiments.Metabolites. 2023 Mar 23;13(4):466. doi: 10.3390/metabo13040466. Metabolites. 2023. PMID: 37110124 Free PMC article.
-
U-13C-glucose incorporation into source leaves of Brassica napus highlights light-dependent regulations of metabolic fluxes within central carbon metabolism.J Plant Physiol. 2024 Jan;292:154162. doi: 10.1016/j.jplph.2023.154162. Epub 2023 Dec 13. J Plant Physiol. 2024. PMID: 38103478
-
In vivo metabolic flux profiling with stable isotopes discriminates sites and quantifies effects of mitochondrial dysfunction in C. elegans.Mol Genet Metab. 2014 Mar;111(3):331-341. doi: 10.1016/j.ymgme.2013.12.011. Epub 2013 Dec 27. Mol Genet Metab. 2014. PMID: 24445252 Free PMC article.
-
Metabolic control and regulation of the tricarboxylic acid cycle in photosynthetic and heterotrophic plant tissues.Plant Cell Environ. 2012 Jan;35(1):1-21. doi: 10.1111/j.1365-3040.2011.02332.x. Epub 2011 Jun 20. Plant Cell Environ. 2012. PMID: 21477125 Review.
-
Organic Acids: The Pools of Fixed Carbon Involved in Redox Regulation and Energy Balance in Higher Plants.Front Plant Sci. 2016 Jul 15;7:1042. doi: 10.3389/fpls.2016.01042. eCollection 2016. Front Plant Sci. 2016. PMID: 27471516 Free PMC article. Review.
Cited by
-
Metabolic flux analysis in leaf metabolism quantifies the link between photorespiration and one carbon metabolism.Nat Plants. 2025 Sep 3. doi: 10.1038/s41477-025-02091-w. Online ahead of print. Nat Plants. 2025. PMID: 40903490
-
Evaluation of GC/MS-Based 13C-Positional Approaches for TMS Derivatives of Organic and Amino Acids and Application to Plant 13C-Labeled Experiments.Metabolites. 2023 Mar 23;13(4):466. doi: 10.3390/metabo13040466. Metabolites. 2023. PMID: 37110124 Free PMC article.
-
SIMPEL: using stable isotopes to elucidate dynamics of context specific metabolism.Commun Biol. 2024 Feb 12;7(1):172. doi: 10.1038/s42003-024-05844-z. Commun Biol. 2024. PMID: 38347116 Free PMC article.
-
Low Nitrogen Input Mitigates Quantitative but Not Qualitative Reconfiguration of Leaf Primary Metabolism in Brassica napus L. Subjected to Drought and Rehydration.Plants (Basel). 2024 Mar 27;13(7):969. doi: 10.3390/plants13070969. Plants (Basel). 2024. PMID: 38611498 Free PMC article.
References
-
- Abadie C., Tcherkez G. (2019). In vivo phosphoenolpyruvate carboxylase activity is controlled by CO2 and O2 mole fractions and represents a major flux at high photorespiration rates. New Phytol. 221, 1843–1852. - PubMed
LinkOut - more resources
Full Text Sources
Miscellaneous