. 2023 Jan 10:13:1040117.
doi: 10.3389/fpls.2022.1040117. eCollection 2022.

A dual-flow RootChip enables quantification of bi-directional calcium signaling in primary roots

Affiliations

A dual-flow RootChip enables quantification of bi-directional calcium signaling in primary roots

Claudia Allan et al. Front Plant Sci. .

Abstract

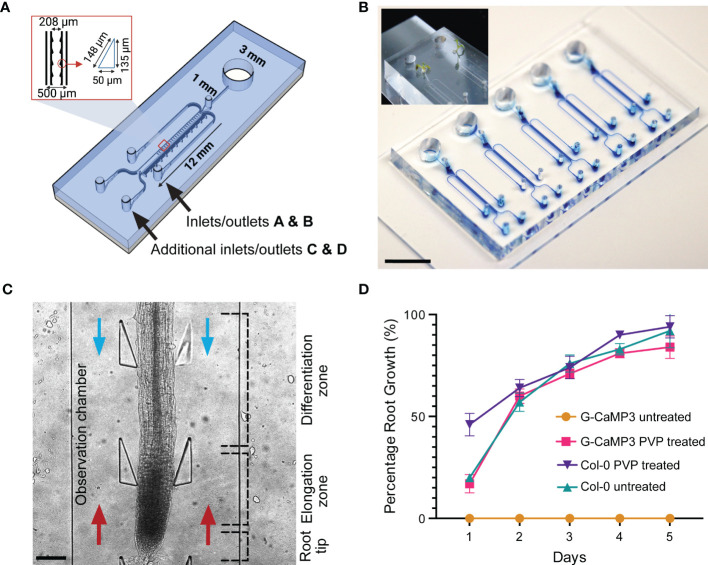
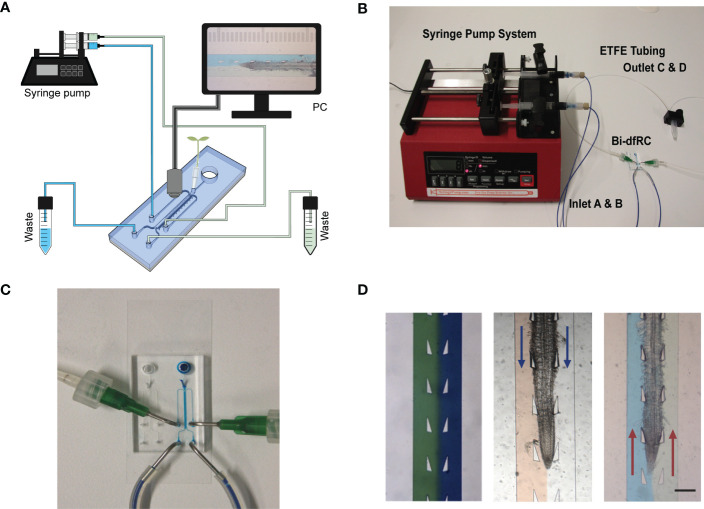
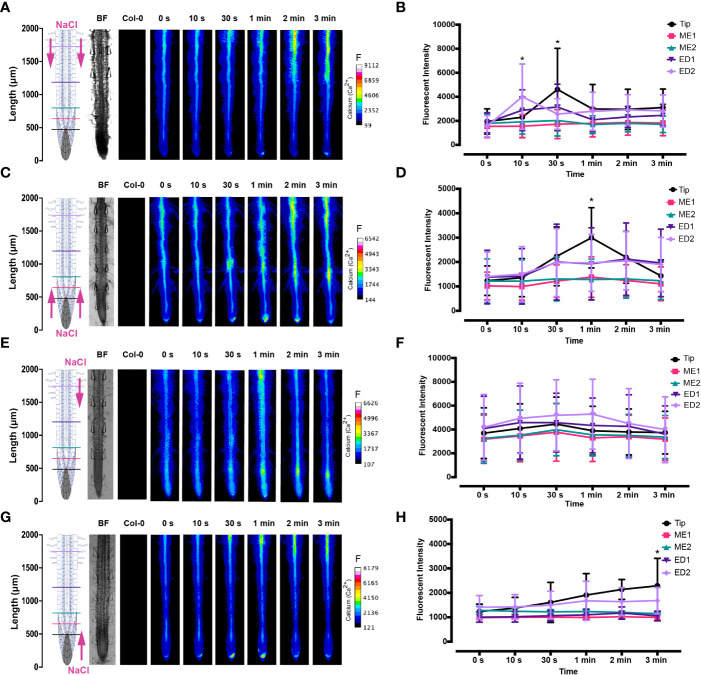
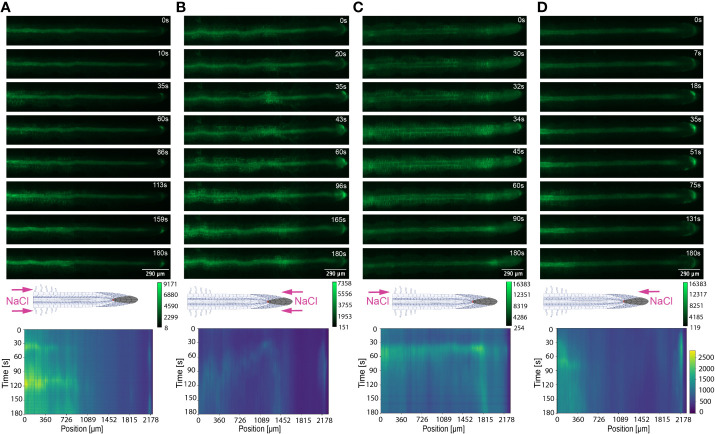
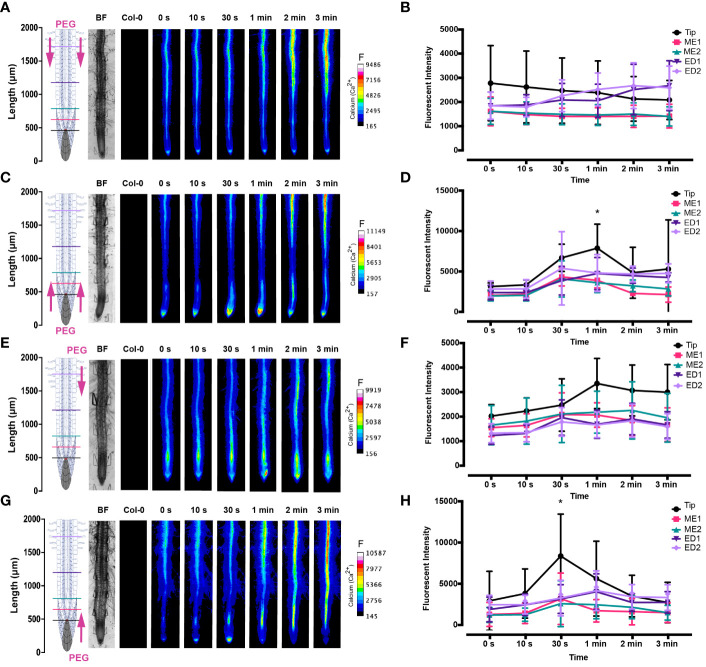
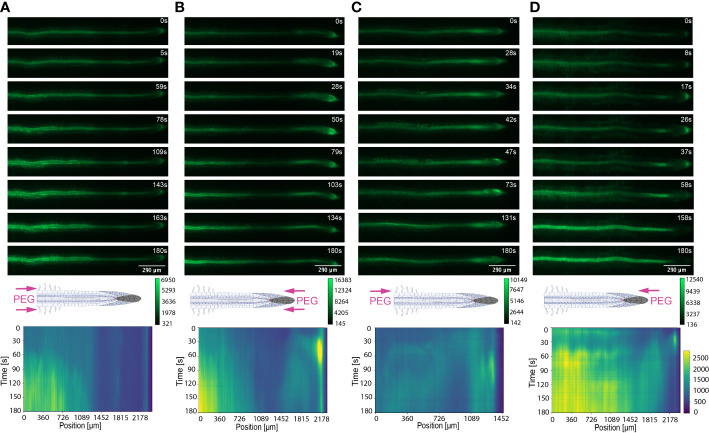
One sentence summary: Bi-directional-dual-flow-RootChip to track calcium signatures in Arabidopsis primary roots responding to osmotic stress. Plant growth and survival is fundamentally linked with the ability to detect and respond to abiotic and biotic factors. Cytosolic free calcium (Ca2+) is a key messenger in signal transduction pathways associated with a variety of stresses, including mechanical, osmotic stress and the plants' innate immune system. These stresses trigger an increase in cytosolic Ca2+ and thus initiate a signal transduction cascade, contributing to plant stress adaptation. Here we combine fluorescent G-CaMP3 Arabidopsis thaliana sensor lines to visualise Ca2+ signals in the primary root of 9-day old plants with an optimised dual-flow RootChip (dfRC). The enhanced polydimethylsiloxane (PDMS) bi-directional-dual-flow-RootChip (bi-dfRC) reported here adds two adjacent inlet channels at the base of the observation chamber, allowing independent or asymmetric chemical stimulation at either the root differentiation zone or tip. Observations confirm distinct early spatio-temporal patterns of salinity (sodium chloride, NaCl) and drought (polyethylene glycol, PEG)-induced Ca2+ signals throughout different cell types dependent on the first contact site. Furthermore, we show that the primary signal always dissociates away from initially stimulated cells. The observed early signaling events induced by NaCl and PEG are surprisingly complex and differ from long-term changes in cytosolic Ca2+ reported in roots. Bi-dfRC microfluidic devices will provide a novel approach to challenge plant roots with different conditions simultaneously, while observing bi-directionality of signals. Future applications include combining the bi-dfRC with H2O2 and redox sensor lines to test root systemic signaling responses to biotic and abiotic factors.

Keywords: Arabidopsis; abiotic stress; calcium; microfluidics; osmotic stress; root; signalling.


Conflict of interest statement

The authors declare that the research was conducted in the absence of any commercial or financial relationships that could be construed as a potential conflict of interest.

Figures

Figure 1
Figure 1
Bi-directional dual-flow-RootChip (Bi-dfRC) for laminar flow perfusion of stress treatments at the tip and differentiation zone of Arabidopsis roots. (A) Schematic diagram of the bi-dfRC including pillar array dimensions (identical to the conventional dfRC) in addition to a second set of inlets/outlets C & D for bi-directional stress application at the tip or differentiation zone. (B) Image of epoxy dye (blue) filled microchannels for visualisation of root observation chamber joining 4 inlet/outlets. 9-day old Arabidopsis G-CaMP3 plants cultured into the root inlet of the bi-dfRC depicted top left (scale bar 10 mm). (C) Arabidopsis G-CaMP3 root situated in the bi-dfRC observation chamber highlighting key zones (tip, elongation, and differentiation zone) and treatment orientation (blue arrows from top inlets A & B, red arrows from bottom inlets C & D, scale bar 200 µm). (D) Average percentage of Arabidopsis G-CaMP3 and Col-0 root growth into PVP-treated and untreated microchannels over 5-days (n= 100).
Figure 2
Figure 2
Bi-directional dual-flow-RootChip (Bi-dfRC) imaging set up. (A) Schematic diagram of the bi-dfRC set up with syringe pump system and tubing array for imaging. (B) Photograph of the syringe pump system, tubing and chip adapter used for the delivery of asymmetric test solutions into the bi-dfRC microchannels. (C) Close-up depicting the fluid flow into the observation chamber delivered by tubing network into the bi-dfRC in the absence of a root using blue dye (scale bar 5 mm). (D) Arabidopsis 9-day old G-CaMP3 root under asymmetric fluidic flow visualised using coloured dye in the absence and presence (flow direction indicated with blue arrows for differentiation zone and red arrows for tip) of a root (scale bar 350 μm).
Figure 3
Figure 3
Fluorescence intensity of Ca2+ in Arabidopsis G-CaMP3 roots exposed to NaCl (100 mM). Fluorescence was observed for 180 s post NaCl treatment. (A) Heat map depicting Ca2+ release, corresponding to increase in G-CaMP3 fluorescence. Five linear sections used for fluorescence quantification upon targeted application of NaCl treatment through inlets A (left) & B (right) at the differentiation zone (DZ) are shown (n= 10). Colour change indicates an increase in Ca2+ fluorescence. Root schematic depicting treatment application, orientation (salt; NaCl and control; MS media) and linear sections (refer to key), bright field (BF) and control (wild type Col-0) roots displayed on the left. Scale; F= fluorescence intensity. (B) Line graph with two-way ANOVA multiple comparisons Tukey’s honestly significant difference (HSD) mean comparison test (P-value ≤ 0.05) depicting average fluorescence intensity (ADU; analogue digital units) of Ca2+ across five linear sections (Tip, ME1, ME2, ED1 & ED2) upon targeted exposure of salt treatment through inlets A & B at the DZ (n = 10). Asterisks (*) indicate statistical significance. (C) Heat map depicting Ca2+ release, and corresponding increase in G-CaMP3 fluorescence, upon salt treatment through inlets C (left) & D (right) at the tip (n= 10). (D) Line graph depicting average fluorescence intensity of Ca2+ across five linear sections following salt treatment through inlets C & D at the tip (n= 10). (E) Heat map depicting Ca2+ release, and corresponding increase in G-CaMP3 fluorescence, upon salt treatment through inlet B and control media through inlet A at the DZ (n= 10). (F) Line graph depicting average fluorescence intensity of Ca2+ across five linear sections following salt treatment through inlet B and control treatment through inlet A at the DZ (n= 10). (G) Heat map depicting Ca2+ release, and corresponding increase in G-CaMP3 fluorescence, upon salt treatment through inlet D and control treatment through inlet C at the tip (n= 5). (H) Line graph depicting average fluorescence intensity of Ca2+ across five linear sections upon salt treatment through inlet D and control through inlet C at the tip (n= 5).
Figure 4
Figure 4
Key Ca2+ signal localisation in Arabidopsis roots exposed to 100 mM NaCl. Schematic diagrams depict treatment localisation and orientation at the root within the bi-dfRC with fluorescent intensity calibration bars. Kymographs depict the spatial fluorescense of GFP corresponding to Ca2+ in the root over time, in dependence of treatment orientation and localisation. GFP fluorescence in kymographs is color coded, ranging from dark blue to yellow (normalized for all samples). (A) Key Ca2+ localisation pattern upon NaCl treatment through inlets A & B of the bi-dfRC at the differentiation zone. (B) Key Ca2+ localisation pattern upon NaCl treatment through inlets C & D of the bi-dfRC at the tip. (C) Key Ca2+ localisation pattern upon NaCl treatment through inlet B (top) and control treatment through inlet A (base) of the bi-dfRC at the differentiation zone. (D) Key Ca2+ localisation pattern upon NaCl treatment through inlet D (top) and control treatment through inlet C (base) of the bi-dfRC at the tip.
Figure 5
Figure 5
Fluorescence intensity of Ca2+ in Arabidopsis G-CaMP3 roots exposed to PEG (20%). Fluorescence was observed for 180 s post PEG treatment. (A) Heat map view depicting Ca2+ release, corresponding to increase in G-CaMP3 fluorescence. Five linear sections used for fluorescence quantification upon targeted application of PEG treatment through inlets A (left) & B (right) at the differentiation zone (DZ) are shown (n= 5). Colour change indicates an increase in Ca2+ fluorescence. Root schematic depicting treatment application, orientation (Polyethylene glycol; PEG and control; MS media) and linear sections (refer to colour key), bright field (BF) and control (wild type Col-0) roots displayed on the left. Scale; F= fluorescence intensity. (B) Line graph with two-way ANOVA multiple comparisons Tukey’s honestly significant difference (HSD) mean comparison test (P-value ≤ 0.05) depicting average fluorescence intensity (ADU; analogue digital units) of Ca2+ across 5 linear sections (Tip, ME1, ME2, ED1 & ED2) upon targeted exposure of PEG treatment through inlets A & B at the DZ (n = 5). Asterisks (*) indicate statistical significance. (C) Heat map depicting Ca2+ release, and corresponding increase in G-CaMP3 fluorescence, upon PEG treatment through inlets C (left) & D (right) at the tip (n= 5). (D) Line graph depicting average fluorescence intensity of Ca2+ across 5 linear sections following PEG treatment through inlets C & D at the tip (n= 5). (E) Heat map depicting Ca2+ release, and corresponding increase in G-CaMP3 fluorescence, upon PEG treatment through inlet B and control media through inlet A at the DZ (n= 5). (F) Line graph depicting average fluorescence intensity of Ca2+ across 5 linear sections following PEG treatment through inlet B and control treatment through inlet A at the DZ (n= 5). (G) Heat map depicting Ca2+ release, and corresponding increase in G-CaMP3 fluorescence, upon PEG treatment through inlet D and control treatment through inlet C at the tip (n= 5). (H) Line graph depicting average fluorescence intensity of Ca2+ across 5 linear sections upon PEG treatment through inlet D and control through inlet C at the tip (n= 5).
Figure 6
Figure 6
Key Ca2+ signal localisation in Arabidopsis roots exposed to 20% PEG. Schematic diagrams depict treatment localisation and orientation at the root within the bi-dfRC with fluorescent intensity calibration bars. Kymographs depict the spatial fluorescense of GFP corresponding to Ca2+ in the root over time, in dependence of treatment orientation and localisation. GFP fluorescence in kymographs is color coded, ranging from dark blue to yellow (normalized for all samples). (A) Key Ca2+ localisation pattern upon PEG treatment through inlets A & B of the bi-dfRC at the differentiation zone. (B) Key Ca2+ localisation pattern upon PEG treatment through inlets C & D of the bi-dfRC at the tip. (C) Key Ca2+ localisation pattern upon PEG treatment through inlet B (top) and control treatment through inlet A (base) of the bi-dfRC at the differentiation zone. (D) Key Ca2+ localisation pattern upon PEG treatment through inlet D (top) and control treatment through inlet C (base) of the bi-dfRC at the tip.

Similar articles

Cited by

References

    1. Allan C. (2021). Implementation of a novel bi-directional dual-flow-RootChip to investigate the effects of osmotic stress on calcium signalling in Arabidopsis thaliana roots. (University of Canterbury MSc thesis; ). doi: 10.26021/11069 - DOI
    1. Allan C., Morris R. J., Meisrimler C. N. (2022. a). Encoding, transmission, decoding, and specificity of calcium signals in plants. J. Exp. Bot. 73 (11), 3372–3385. doi: 10.1093/jxb/erac105 - DOI - PMC - PubMed
    1. Allan C., Tayagui A., Nock V., Meisrimler C. N. (2022. b). “Novel bi-directional dual-flow-RootChip to study effects of osmotic stress on calcium signalling in Arabidopsis roots,” in 2022 IEEE 35th International Conference on Micro Electro Mechanical Systems Conference (MEMS), 2022, 896–899. doi: 10.1109/MEMS51670.2022.9699700 - DOI
    1. Arsuffi G., Braybrook S. A. (2018). Acid growth: an ongoing trip. J. Exp. Bot. 69 (2), 137–146. doi: 10.1093/jxb/erx390 - DOI - PubMed
    1. Asghar W., Yuksekkaya M., Shafiee H., Zhang M., Ozen M. O., Inci F., et al. . (2016). Engineering long shelf life multi-layer biologically active surfaces on microfluidic devices for point of care applications. Sci. Rep. 6 (1), 1–10. doi: 10.1038/srep21163 - DOI - PMC - PubMed