. 2023 Jan 17:2023:4067418.
doi: 10.1155/2023/4067418. eCollection 2023.

HtrA2 Independently Predicts Poor Prognosis and Correlates with Immune Cell Infiltration in Hepatocellular Carcinoma

Affiliations

HtrA2 Independently Predicts Poor Prognosis and Correlates with Immune Cell Infiltration in Hepatocellular Carcinoma

Lei Feng et al. J Oncol. .

Abstract

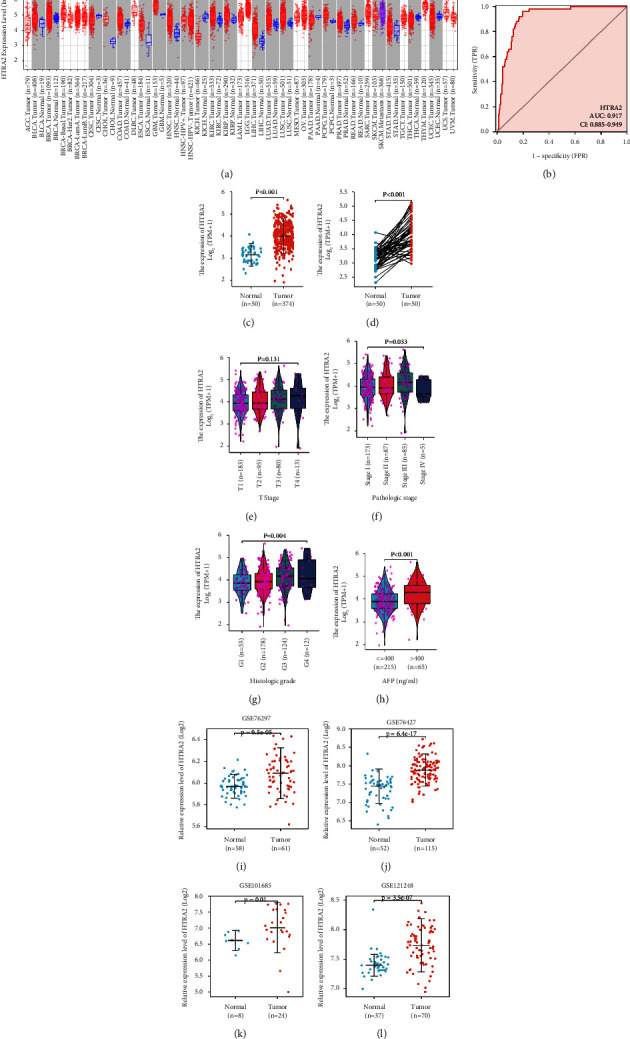
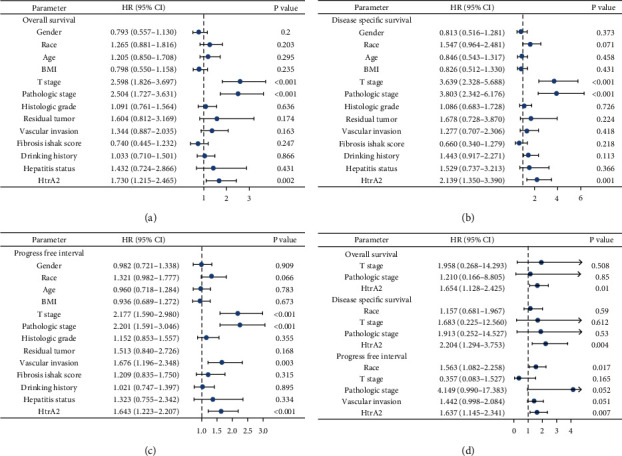
High-temperature requirement protein A2 (HtrA2), a mitochondrial protein, is related to apoptosis regulation. However, the role of HtrA2 in hepatocellular carcinoma (HCC) remains unclear. In the present study, we explored the prognostic value and expression pattern of HtrA2 in HCC and confirmed its independent value for predicting outcomes via Cox analyses. LinkedOmics and GEPIA2 were used to construct the coexpression and functional networks of HtrA2. Additionally, the data obtained from TCGA was analyzed to investigate the relationship between the infiltration of immune cells and HtrA2 mRNA expression. Finally, the expression pattern of HtrA2 in HCC was confirmed by wet-lab experiments. The results showed high HtrA2 expression (P < 0.001) presented in tumor tissues in TCGA-HCC. Moreover, high HtrA2 expression was confirmed to be associated with poor HCC patient survival (P < 0.05). HtrA2 has also been recognized as an essential risk factor for overall survival (P=0.01, HR = 1.654, 95% CI 1.128-2.425), disease-specific survival (P=0.004, HR = 2.204, 95% CI 1.294-3.753), and progression-free interval (P=0.007, HR = 1.637, 95% CI 1.145-2.341) of HCC. HCC patients with low HtrA2 methylation had worse overall survival than patients with high methylation (P=0.0019). Functional network analysis suggests that HtrA2 regulates mitochondrial homeostasis through pathways involving multiple microRNAs and transcription factors in HCC. In addition, HtrA2 expression correlated with infiltrating levels of multiple immune cell populations. At last, increased expression of HtrA2 in HCC was confirmed using wet-lab experiments. Our study provides evidence that the upregulation of HtrA2 in HCC is an independent predictor of prognosis. Our results provide the foundation for further study on the roles of HtrA2 in HCC tumorigenesis.


Conflict of interest statement

The authors declare that there are no conflicts of interest.

Figures

Figure 1
Figure 1
HtrA2 mRNA expression in HCC and other human tumor types from the TCGA and GEO databases. (a) The expression levels of HtrA2 in different types of human tumor tissues from the TCGA database. (b) Receiver operating characteristic analysis (ROC) of HtrA2 in HCC (n = 424). (c) Expression levels of HtrA2 in HCC (n = 374) and normal tissue (n = 50). (d) The HtrA2 expression levels in paired (patient-matched) HCC tumors (n = 50) and normal adjacent tissues (n = 50). (e) The association of HtrA2 expression and T classification in HCC (n = 371). (f) The association of HtrA2 expression and pathologic stage in HCC (n = 350). (g) The association of HtrA2 expression and histologic stage in HCC (n = 369). (h) The association of HtrA2 expression in HCC and serum alpha-fetoprotein levels (n = 280). (i–l) The comparisons of HtrA2 expression levels between normal liver tissues and HCC tissues obtained from the GEO database. HCC: hepatocellular carcinoma; TCGA: the cancer genome atlas; GEO: gene expression omnibus.
Figure 2
Figure 2
The prognostic value of HtrA2 expression in HCC. (a) Kaplan–Meier OS curves in HtrA2 low and high expression HCC cases from the TCGA database. (b) Kaplan–Meier DSS curves in HtrA2 low and high expression HCC cases from the TCGA database. (c) Kaplan–Meier PFI curves in HtrA2 low and high expression HCC cases from the TCGA database. (d) Kaplan–Meier DSS curves in HtrA2 low and high expression female HCC cases from the TCGA database. (e) Kaplan–Meier PFI curves in HtrA2 low and high expression female HCC cases from the TCGA database. (f) Kaplan–Meier OS curves in HtrA2 low and high expression male HCC cases from the TCGA database. (g) Kaplan–Meier DSS curves in HtrA2 low and high expression male HCC cases from the TCGA database. (h) Kaplan–Meier PFI curves in HtrA2 low and high expression male HCC cases from the TCGA database. (i, j) Survival analyses of HtrA2 by Kaplan–Meier estimator with log-rank test obtained from the Kaplan–Meier plotter web tool. HCC: hepatocellular carcinoma; TCGA: the cancer genome atlas; OS: overall survival; DSS: disease specific survival; PFI: progress free interval.
Figure 3
Figure 3
Univariate analysis and multivariate analysis of the correlation of HtrA2 expression and important clinical characteristics with survival among hepatocellular carcinoma patients. (a–c) The exploratory univariate analysis examines the impact of multiple candidate factors on OS, DSS, and PFI. (d) The multivariable Cox regression analysis that included the variables identified through univariable screening for OS, DSS, and PFI. OS: overall survival; DSS: disease specific survival; PFI: progress free interval; HR: hazard ratio; CI: confidence interval.
Figure 4
Figure 4
The CNV and methylation of HtrA2 in HCC. (a) Relative mRNA expression of HtrA2 from samples with different CNV statuses (n = 360). (b) Relationship between HtrA2 methylation and its expression level (n = 373). (c) The promoter methylation of HtrA2 in tumor tissues (n = 377) and normal tissues (n = 50) from the TCGA-HCC data. (d) The Kaplan–Meier survival of the promoter methylation of HtrA2 in HCC (n = 377). CNV: copy number variation; HCC: hepatocellular carcinoma; TCGA: the cancer genome atlas. ∗∗∗P < 0.001.
Figure 5
Figure 5
HtrA2 coexpression genes in HCC (LinkedOmics). (a) The global HtrA2 highly correlated genes identified by the Pearson test in HCC. (b) The heatmap showing the top 50 genes positively correlated with HtrA2 in HCC. (c) The heatmap shows the top 50 genes negatively correlated with HtrA2 in HCC. (d, e) Significantly enriched GO: biological process annotations and KEGG pathways of HtrA2 in HCC. (f) The survival heatmap of the top 50 genes positively correlated with HtrA2 in HCC. The survival heatmap shows the hazard ratios in the logarithmic scale (log10) for different genes. FDR: false discovery rate; KEGG: kyoto encyclopedia of genes and genomes; GO: gene ontology; HCC: hepatocellular carcinoma.
Figure 6
Figure 6
Correlation analyses between HtrA2 expression and immune infiltration level in HCC. (a) The correlation between the infiltration of immune cells and the expression of HtrA2. (b–e) HtrA2 expression significantly negatively correlates with infiltrating levels of B cells, CD8 T cells, Th17 cells, and dendritic cells. (f, g) HtrA2 expression significantly positively correlates with infiltrating levels of T helper cells and Th2 cells. HCC: hepatocellular carcinoma; DC: dendritic cells.
Figure 7
Figure 7
Survival analyses of filtered immune cells in HCC. The difference in OS between different infiltration levels of B cells (A), CD8 T cells (D), DC(G), Th2 cells (J), Th17 cells (M), and T helper cells (P), separately. The difference in DSS between different infiltration levels of B cells (B), CD8 T cells (E), DC (H), Th2 cells (K), Th17 cells (N), and T helper cells (Q), separately. The difference in PFI between different infiltration levels of B cells (C), CD8 T cells (F), DC (I), Th2 cells (L), Th17 cells (O), and T helper cells (R), separately. HCC: hepatocellular carcinoma; DC: dendritic cells; OS: overall survival; DSS: disease specific survival; PFI: progress free interval.
Figure 8
Figure 8
HtrA2 mRNA and protein expression in cell lines and HCC tissues. (a–c) Representative immunohistochemistry staining patterns of HtrA2 in HCC tissues. (d) HtrA2 protein expression in a normal human liver cell line and three HCC cell lines. (e) HtrA2 mRNA expression in a normal human liver cell line and three HCC cell lines. HCC: hepatocellular carcinoma. ∗∗∗P < 0.001.

References

    1. McCulloch K., Romero N., MacLachlan J., Allard N., Cowie B. Modeling progress toward elimination of hepatitis B in Australia. Hepatology . 2020;71(4):1170–1181. doi: 10.1002/hep.30899. - DOI - PMC - PubMed
    1. Aizarani N., Saviano A., Mailly L., et al. A human liver cell atlas reveals heterogeneity and epithelial progenitors. Nature . 2019;572(7768):199–204. doi: 10.1038/s41586-019-1373-2. - DOI - PMC - PubMed
    1. Hindupur S. K., Colombi M., Fuhs S. R., et al. The protein histidine phosphatase LHPP is a tumour suppressor. Nature . 2018;555(7698):678–682. doi: 10.1038/nature26140. - DOI - PMC - PubMed
    1. Haider C., Hnat J., Wagner R., et al. Transforming growth factor-β and axl induce CXCL5 and neutrophil recruitment in hepatocellular carcinoma. Hepatology . 2019;69(1):222–236. doi: 10.1002/hep.30166. - DOI - PMC - PubMed
    1. Liang J. Y., Wang D. S., Lin H. C., et al. A novel ferroptosis-related gene signature for overall survival prediction in patients with hepatocellular carcinoma. International Journal of Biological Sciences . 2020;16(13):2430–2441. doi: 10.7150/ijbs.45050. - DOI - PMC - PubMed

LinkOut - more resources