

A computational approach based on weighted gene co-expression network analysis for biomarkers analysis of Parkinson's disease and construction of diagnostic model
- PMID: 36704228
- PMCID: PMC9873349
- DOI: 10.3389/fncom.2022.1095676
A computational approach based on weighted gene co-expression network analysis for biomarkers analysis of Parkinson's disease and construction of diagnostic model
Abstract
Background: Parkinson's disease (PD) is a common age-related chronic neurodegenerative disease. There is currently no affordable, effective, and less invasive test for PD diagnosis. Metabolite profiling in blood and blood-based gene transcripts is thought to be an ideal method for diagnosing PD.
Aim: In this study, the objective is to identify the potential diagnostic biomarkers of PD by analyzing microarray gene expression data of samples from PD patients.
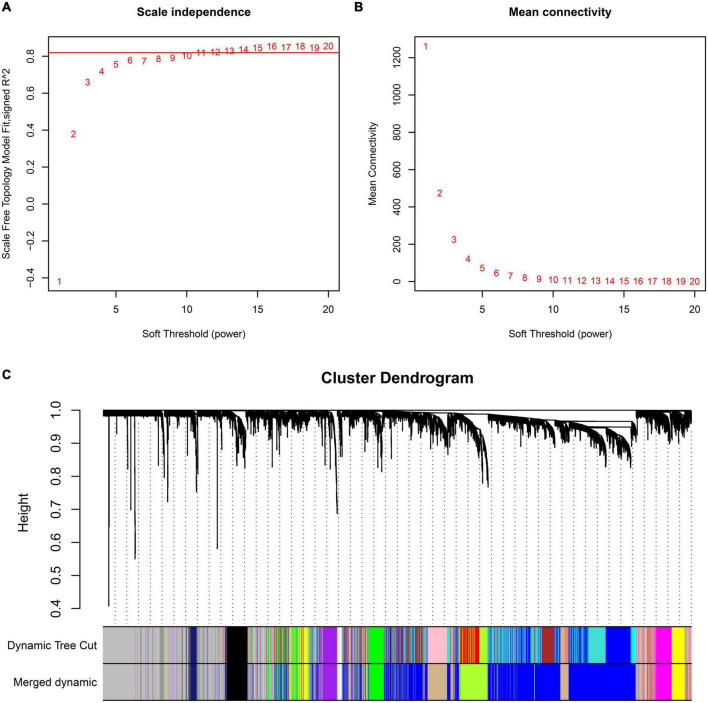
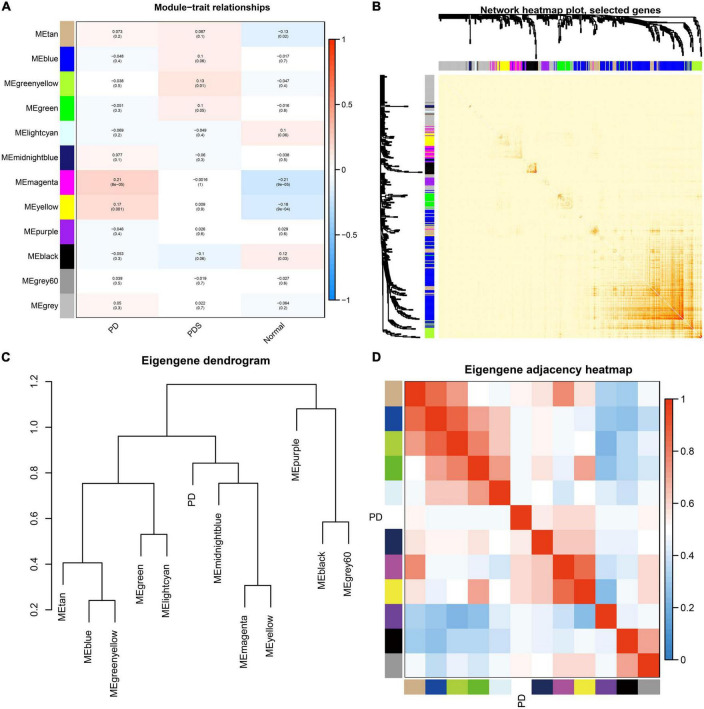
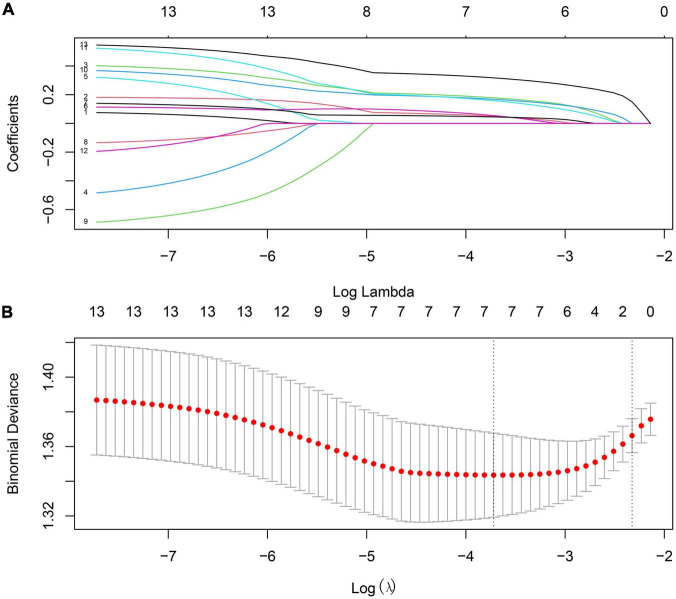
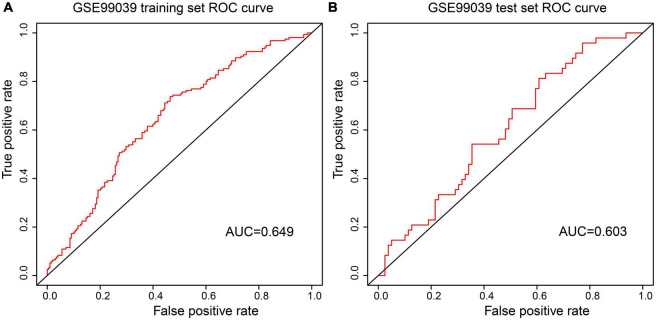
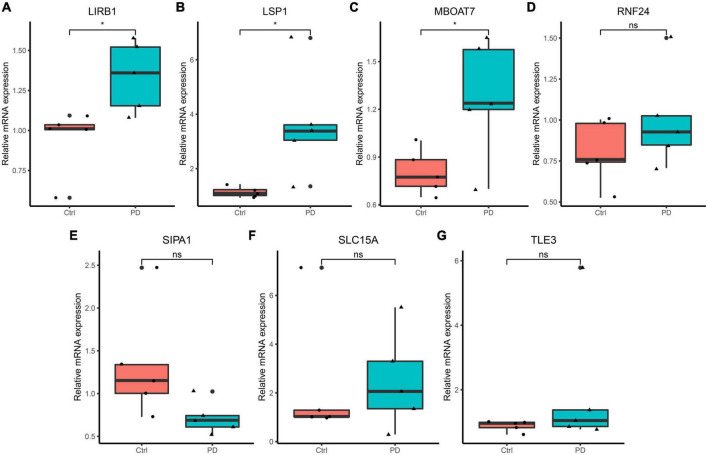
Methods: A computational approach, namely, Weighted Gene Co-expression Network Analysis (WGCNA) was used to construct co-expression gene networks and identify the key modules that were highly correlated with PD from the GSE99039 dataset. The Least Absolute Shrinkage and Selection Operator (LASSO) regression analysis was performed to identify the hub genes in the key modules with strong association with PD. The selected hub genes were then used to construct a diagnostic model based on logistic regression analysis, and the Receiver Operating Characteristic (ROC) curves were used to evaluate the efficacy of the model using the GSE99039 dataset. Finally, Reverse Transcription-Polymerase Chain Reaction (RT-PCR) was used to validate the hub genes.
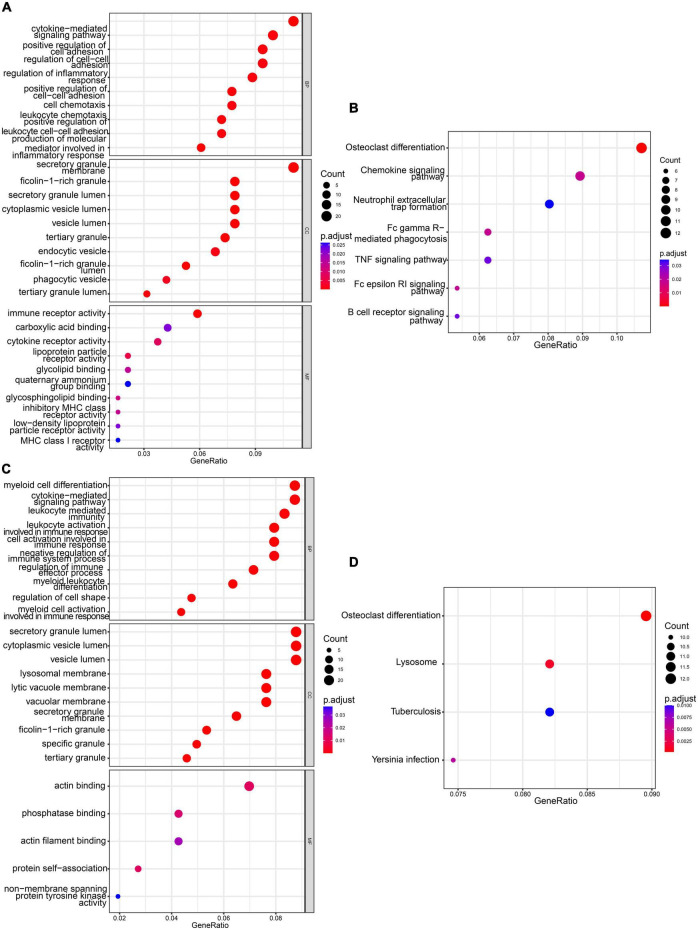
Results: WGCNA identified two key modules associated with inflammation and immune response. Seven hub genes, LILRB1, LSP1, SIPA1, SLC15A3, MBOAT7, RNF24, and TLE3 were identified from the two modules and used to construct diagnostic models. ROC analysis showed that the diagnostic model had a good diagnostic performance for PD in the training and testing datasets. Results of the RT-PCR experiments showed that there were significant differences in the mRNA expression of LILRB1, LSP1, and MBOAT7 among the seven hub genes.
Conclusion: The 7-gene panel (LILRB1, LSP1, SIPA1, SLC15A3, MBOAT7, RNF24, and TLE3) will serve as a potential diagnostic signature for PD.
Keywords: LASSO regression; Parkinson’s disease; WGCNA; computational approach; potential diagnostic predictor.
Copyright © 2023 Wu, Hu, Gao, Xia, Zhang and Jiang.
Conflict of interest statement
The authors declare that the research was conducted in the absence of any commercial or financial relationships that could be construed as a potential conflict of interest.
Figures
Similar articles
-
Identifying the hub gene and immune infiltration of Parkinson's disease using bioinformatical methods.Brain Res. 2022 Jun 15;1785:147879. doi: 10.1016/j.brainres.2022.147879. Epub 2022 Mar 10. Brain Res. 2022. PMID: 35278479
-
Identification of potential immune-related hub genes in Parkinson's disease based on machine learning and development and validation of a diagnostic classification model.PLoS One. 2023 Dec 5;18(12):e0294984. doi: 10.1371/journal.pone.0294984. eCollection 2023. PLoS One. 2023. PMID: 38051734 Free PMC article.
-
Weighted gene co-expression network analysis reveals specific modules and biomarkers in Parkinson's disease.Neurosci Lett. 2020 May 29;728:134950. doi: 10.1016/j.neulet.2020.134950. Epub 2020 Apr 8. Neurosci Lett. 2020. PMID: 32276105
-
Immune Profiling of Parkinson's Disease Revealed Its Association With a Subset of Infiltrating Cells and Signature Genes.Front Aging Neurosci. 2021 Feb 9;13:605970. doi: 10.3389/fnagi.2021.605970. eCollection 2021. Front Aging Neurosci. 2021. PMID: 33633562 Free PMC article.
-
Integrative analysis of potential biomarkers and immune cell infiltration in Parkinson's disease.Brain Res Bull. 2021 Dec;177:53-63. doi: 10.1016/j.brainresbull.2021.09.010. Epub 2021 Sep 16. Brain Res Bull. 2021. PMID: 34536521
Cited by
-
Quantitative proteomics and phosphoproteomics of urinary extracellular vesicles define putative diagnostic biosignatures for Parkinson's disease.Commun Med (Lond). 2023 May 10;3(1):64. doi: 10.1038/s43856-023-00294-w. Commun Med (Lond). 2023. PMID: 37165152 Free PMC article.
-
Regulatory role of LncRNA FMR1-AS1 in the pathogenesis of alzheimer's disease based on bioinformatics and in vitro experimental validation.Sci Rep. 2025 Aug 17;15(1):30134. doi: 10.1038/s41598-025-15242-y. Sci Rep. 2025. PMID: 40820106
-
Identification of RN7SK LncRNA as a novel biomarker in Alzheimer's disease using bioinformatics and expression analysis.Sci Rep. 2024 Dec 28;14(1):31192. doi: 10.1038/s41598-024-82490-9. Sci Rep. 2024. PMID: 39732800 Free PMC article.
-
The Study of the Association of Polymorphisms in LSP1, GPNMB, PDPN, TAGLN, TSPO, and TUBB6 Genes with the Risk and Outcome of Ischemic Stroke in the Russian Population.Int J Mol Sci. 2023 Apr 6;24(7):6831. doi: 10.3390/ijms24076831. Int J Mol Sci. 2023. PMID: 37047799 Free PMC article.
-
CSF Proteomics in Patients With Progressive Supranuclear Palsy.Neurology. 2024 Aug 13;103(3):e209585. doi: 10.1212/WNL.0000000000209585. Epub 2024 Jul 3. Neurology. 2024. PMID: 38959435 Free PMC article.
References
-
- Baba Y., Kuroiwa A., Uitti R. J., Wszolek Z. K., Yamada T. (2005). Alterations of T-lymphocyte populations in Parkinson disease. Parkinsonism Relat. Disord. 11 493–498. - PubMed
LinkOut - more resources
Full Text Sources
Miscellaneous