

Value of imaging examinations in diagnosing lumbar disc herniation: A systematic review and meta-analysis
- PMID: 36704505
- PMCID: PMC9872518
- DOI: 10.3389/fsurg.2022.1020766
Value of imaging examinations in diagnosing lumbar disc herniation: A systematic review and meta-analysis
Abstract
Purpose: To systematically review the clinical value of three imaging examinations (Magnetic Resonance Imaging, Computed Tomography, and myelography) in the diagnosis of Lumbar Disc Herniation.
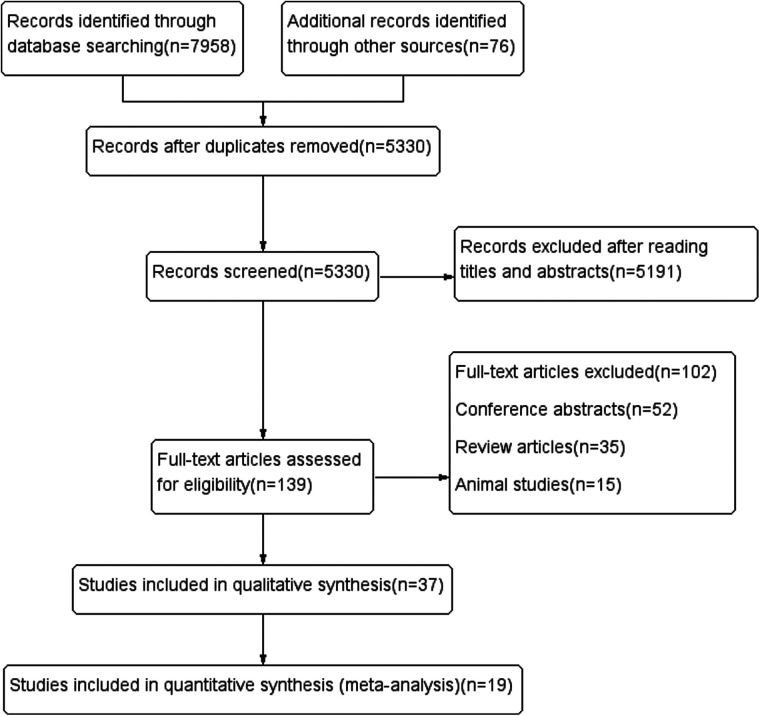
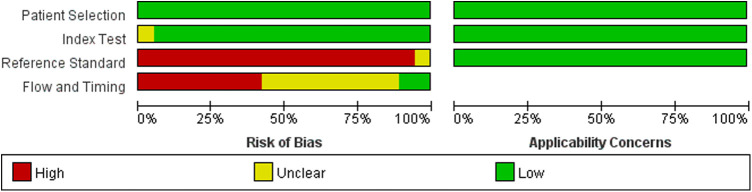
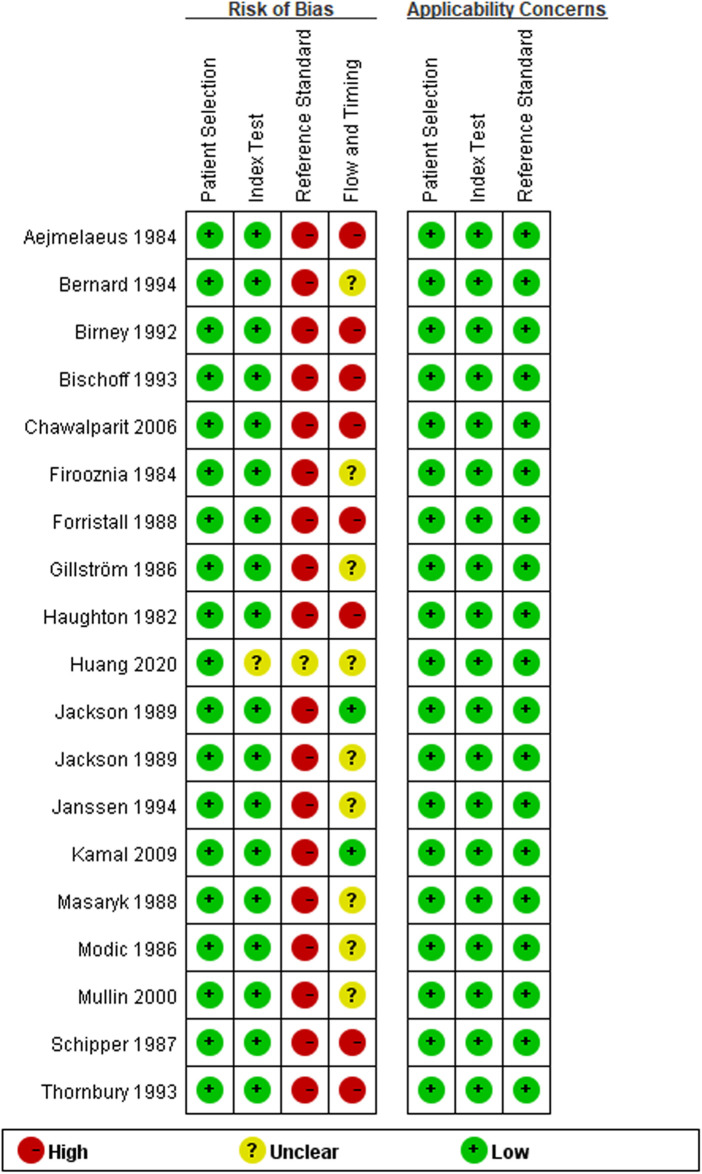
Methods: Databases including PubMed, Embase, The Cochrane Library, Web of Science, CBM, CNKI, WanFang Data, and VIP were electronically searched to collect relevant studies on three imaging examinations in the diagnosis of Lumbar Disc Herniation from inception to July 1, 2021. Two reviewers using the Quality Assessment of Diagnostic Accuracy Studies-2 tool independently screened the literature, extracted the data, and assessed the risk of bias of included studies. Then, meta-analysis was performed by using Meta-DiSc 1.4 software and Stata 15.0 software.
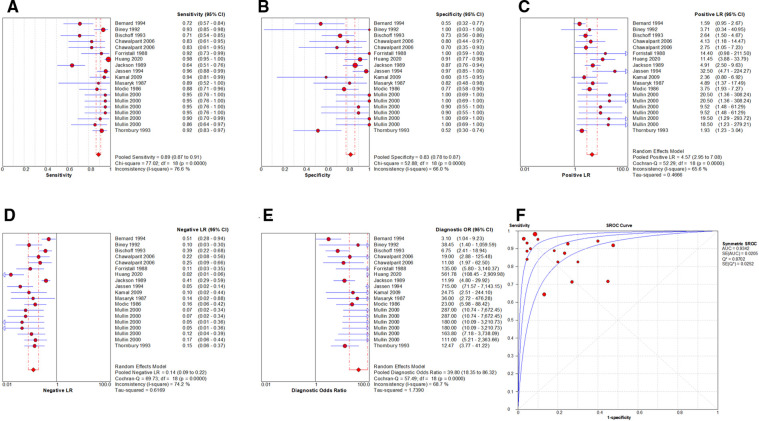
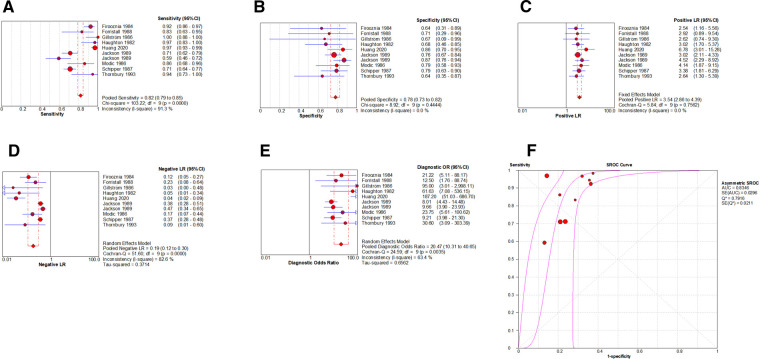
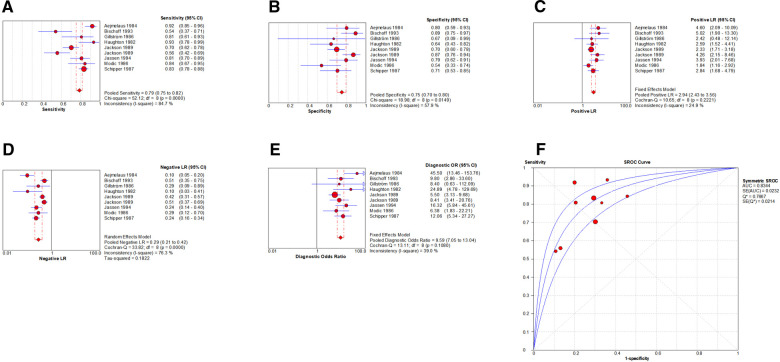
Results: A total of 38 studies from 19 articles were included, involving 1,875 patients. The results showed that the pooled Sensitivity, pooled Specificity, pooled Positive Likelihood Ratio, pooled Negative Likelihood Ratio, pooled Diagnostic Odds Ratio, Area Under the Curve of Summary Receiver Operating Characteristic, and Q* were 0.89 (95%CI: 0.87-0.91), 0.83 (95%CI: 0.78-0.87), 4.57 (95%CI: 2.95-7.08), 0.14 (95%CI: 0.09-0.22), 39.80 (95%CI: 18.35-86.32), 0.934, and 0.870, respectively, for Magnetic Resonance Imaging. The pooled Sensitivity, pooled Specificity, pooled Positive Likelihood Ratio, pooled Negative Likelihood Ratio, pooled Diagnostic Odds Ratio, Area Under the Curve of Summary Receiver Operating Characteristic, and Q* were 0.82 (95%CI: 0.79-0.85), 0.78 (95%CI: 0.73-0.82), 3.54 (95%CI: 2.86-4.39), 0.19 (95%CI: 0.12-0.30), 20.47 (95%CI: 10.31-40.65), 0.835, and 0.792, respectively, for Computed Tomography. The pooled Sensitivity, pooled Specificity, pooled Positive Likelihood Ratio, pooled Negative Likelihood Ratio, pooled Diagnostic Odds Ratio, Area Under the Curve of Summary Receiver Operating Characteristic, and Q* were 0.79 (95%CI: 0.75-0.82), 0.75 (95%CI: 0.70-0.80), 2.94 (95%CI: 2.43-3.56), 0.29 (95%CI: 0.21-0.42), 9.59 (95%CI: 7.05-13.04), 0.834, and 0.767 respectively, for myelography.
Conclusion: Three imaging examinations had high diagnostic value. In addition, compared with myelography, Magnetic Resonance Imaging had a higher diagnostic value.
Keywords: Computed Tomography; Lumbar Disc Herniation; Magnetic Resonance Imaging; meta-analysis; myelography.
© 2023 Huang, Zhao, Zhang, Wu and Liu.
Conflict of interest statement
The authors declare that the research was conducted in the absence of any commercial or financial relationships that could be construed as a potential conflict of interest.
Figures
Similar articles
-
Diagnostic value of magnetic resonance imaging and magnetic resonance arthrography for assessing acetabular labral tears: A systematic review and meta-analysis.Medicine (Baltimore). 2023 Mar 3;102(9):e32963. doi: 10.1097/MD.0000000000032963. Medicine (Baltimore). 2023. PMID: 36862877 Free PMC article.
-
Systematic review and meta-analysis of magnetic resonance imaging in the diagnosis of pulmonary embolism.BMC Med Imaging. 2025 Mar 20;25(1):92. doi: 10.1186/s12880-025-01629-w. BMC Med Imaging. 2025. PMID: 40114100 Free PMC article.
-
[Meta-analysis on the diagnostic value of laser Doppler imaging for burn depth].Zhonghua Shao Shang Za Zhi. 2017 May 20;33(5):301-308. doi: 10.3760/cma.j.issn.1009-2587.2017.05.009. Zhonghua Shao Shang Za Zhi. 2017. PMID: 28651422 Chinese.
-
[Quantitative evaluation for diagnostic efficacy of computed tomography and magnetic resonance imaging in patients with lumbar disc herniation].Zhonghua Yi Xue Za Zhi. 2011 Jan 4;91(1):23-7. Zhonghua Yi Xue Za Zhi. 2011. PMID: 21418957 Chinese.
-
Value of clinical tests in diagnosing anterior cruciate ligament injuries: A systematic review and meta-analysis.Medicine (Baltimore). 2022 Aug 5;101(31):e29263. doi: 10.1097/MD.0000000000029263. Medicine (Baltimore). 2022. PMID: 35945782 Free PMC article.
Cited by
-
Detection of lumbar disc herniation and degeneration using photon-counting detector CT with virtual non-calcium imaging.Eur Radiol. 2025 Aug 8. doi: 10.1007/s00330-025-11922-5. Online ahead of print. Eur Radiol. 2025. PMID: 40779166
-
Diagnostic accuracy of the compression overload test versus straight leg Raise test in detecting lumbar disc herniation: an MRI-Validated Cross-Sectional study.Eur Spine J. 2025 Jul 21. doi: 10.1007/s00586-025-09164-6. Online ahead of print. Eur Spine J. 2025. PMID: 40694111
-
A Severe Disc Herniation Mimics Spinal Tumor.Cureus. 2023 Mar 22;15(3):e36545. doi: 10.7759/cureus.36545. eCollection 2023 Mar. Cureus. 2023. PMID: 36968683 Free PMC article.
-
Classification of lumbar spine disorders using large language models and MRI segmentation.BMC Med Inform Decis Mak. 2024 Nov 18;24(1):343. doi: 10.1186/s12911-024-02740-8. BMC Med Inform Decis Mak. 2024. PMID: 39558285 Free PMC article.
-
Electron density dual-energy CT can improve the detection of lumbar disc herniation with higher image quality than standard and virtual non-calcium images.Eur Radiol. 2024 Nov;34(11):7334-7346. doi: 10.1007/s00330-024-10782-9. Epub 2024 May 16. Eur Radiol. 2024. PMID: 38755438
References
-
- Fardon DF, Milette PC. Nomenclature and classification of lumbar disc pathology. Recommendations of the combined task forces of the North American spine society, American society of spine radiology, and American society of neuroradiology. Spine. (2001) 26(5):E93–113. 10.1097/00007632-200103010-00006 - DOI - PubMed
Publication types
LinkOut - more resources
Full Text Sources