

Generalised exponential-Gaussian distribution: a method for neural reaction time analysis
- PMID: 36704631
- PMCID: PMC9871144
- DOI: 10.1007/s11571-022-09813-2
Generalised exponential-Gaussian distribution: a method for neural reaction time analysis
Abstract
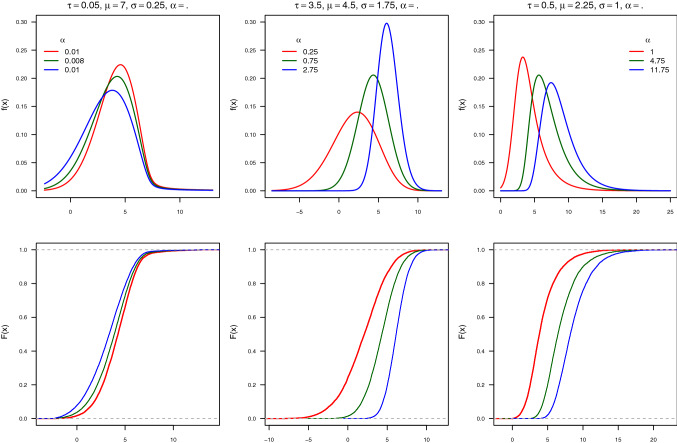
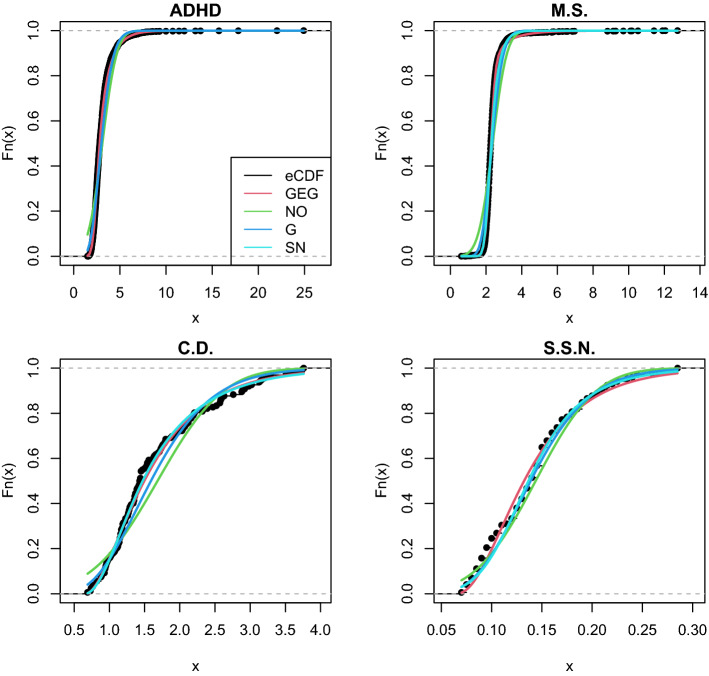
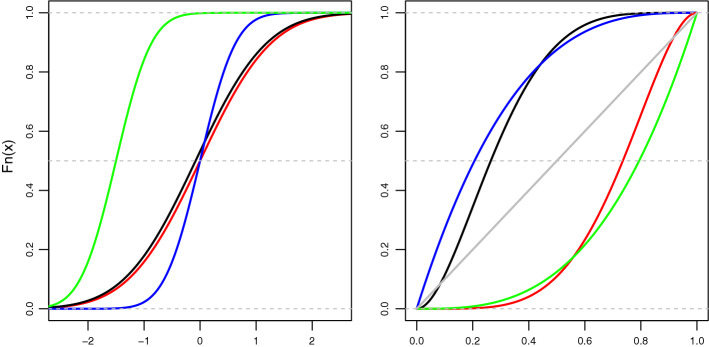
Reaction times (RTs) are an essential metric used for understanding the link between brain and behaviour. As research is reaffirming the tight coupling between neuronal and behavioural RTs, thorough statistical modelling of RT data is thus essential to enrich current theories and motivate novel findings. A statistical distribution is proposed herein that is able to model the complete RT's distribution, including location, scale and shape: the generalised-exponential-Gaussian (GEG) distribution. The GEG distribution enables shifting the attention from traditional means and standard deviations to the entire RT distribution. The mathematical properties of the GEG distribution are presented and investigated via simulations. Additionally, the GEG distribution is featured via four real-life data sets. Finally, we discuss how the proposed distribution can be used for regression analyses via generalised additive models for location, scale and shape (GAMLSS).
Keywords: Cognitive neuroscience; Exponential Gaussian distribution; Generalised additive models for location, Scale and shape; Neuronal response latency; Reaction times.
© The Author(s) 2022.
Figures
Similar articles
-
Reference centiles for the middle cerebral artery and umbilical artery pulsatility index and cerebro-placental ratio from a low-risk population - a Generalised Additive Model for Location, Shape and Scale (GAMLSS) approach.J Matern Fetal Neonatal Med. 2019 Jul;32(14):2338-2345. doi: 10.1080/14767058.2018.1432590. Epub 2018 Feb 6. J Matern Fetal Neonatal Med. 2019. PMID: 29409368
-
Automatic smoothing parameter selection in GAMLSS with an application to centile estimation.Stat Methods Med Res. 2014 Aug;23(4):318-32. doi: 10.1177/0962280212473302. Epub 2013 Feb 1. Stat Methods Med Res. 2014. PMID: 23376962
-
On the potential of models for location and scale for genome-wide DNA methylation data.BMC Bioinformatics. 2014 Jul 3;15:232. doi: 10.1186/1471-2105-15-232. BMC Bioinformatics. 2014. PMID: 24994026 Free PMC article.
-
Non-Gaussian Distributional Analyses of Reaction Times (RT): Improvements that Increase Efficacy of RT Tasks for Describing Cognitive Processes.Neuropsychol Rev. 2018 Sep;28(3):359-376. doi: 10.1007/s11065-018-9382-8. Epub 2018 Sep 3. Neuropsychol Rev. 2018. PMID: 30178182 Review.
-
ExGUtils: A Python Package for Statistical Analysis With the ex-Gaussian Probability Density.Front Psychol. 2018 May 1;9:612. doi: 10.3389/fpsyg.2018.00612. eCollection 2018. Front Psychol. 2018. PMID: 29765345 Free PMC article. Review.
Cited by
-
The hazards of dealing with response time outliers.Front Psychol. 2023 Aug 24;14:1220281. doi: 10.3389/fpsyg.2023.1220281. eCollection 2023. Front Psychol. 2023. PMID: 37691812 Free PMC article.
References
-
- Azzalini A. A class of distributions which includes the normal ones. Scand J Stat. 1985;12(2):171–178.
-
- Azzalini A, Capitanio A. Statistical applications of the multivariate skew normal distribution. J R Stat Soc B. 1999;61(3):579–602. doi: 10.1111/1467-9868.00194. - DOI
-
- Chiogna M. Some results on the scalar skew-normal distribution. Stat Methods Appl. 1998;7(1):1–13.
-
- Christie LS, Luce RD. Decision structure and time relations in simple choice behavior. Bull Math Biophys. 1956;18:89–112. doi: 10.1007/BF02477834. - DOI
LinkOut - more resources
Full Text Sources
Research Materials
