. 2023 Feb;17(1):63-104.
doi: 10.1007/s11571-022-09795-1. Epub 2022 Mar 29.

Brain fingerprinting field study on major, terrorist crimes supports the brain fingerprinting scientific standards hypothesis: classification concealed information test with P300 and P300-MERMER succeeds; comparison CIT fails

Affiliations

Brain fingerprinting field study on major, terrorist crimes supports the brain fingerprinting scientific standards hypothesis: classification concealed information test with P300 and P300-MERMER succeeds; comparison CIT fails

Lawrence A Farwell et al. Cogn Neurodyn. 2023 Feb.

Abstract

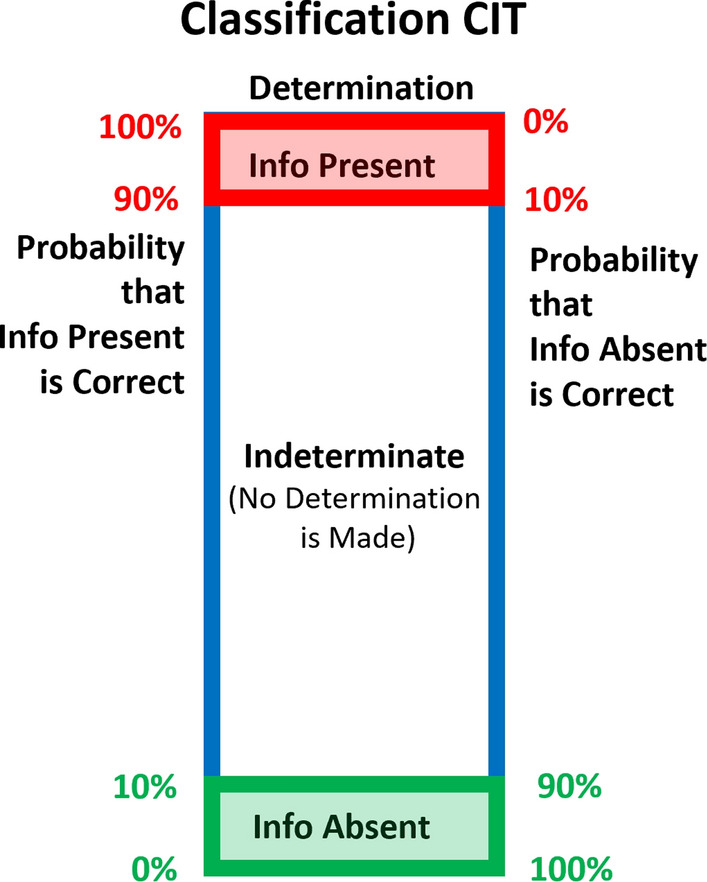
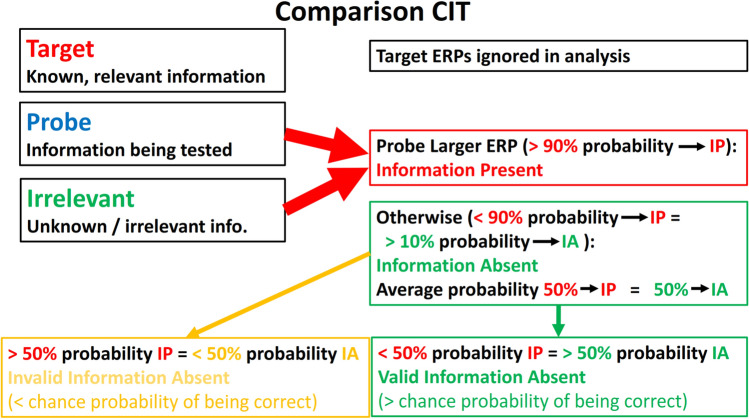
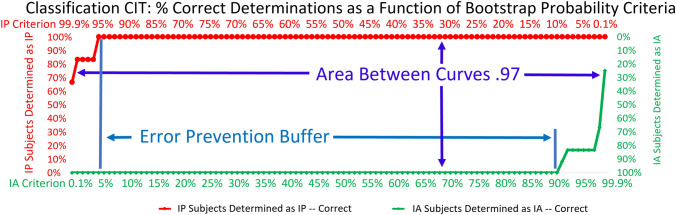
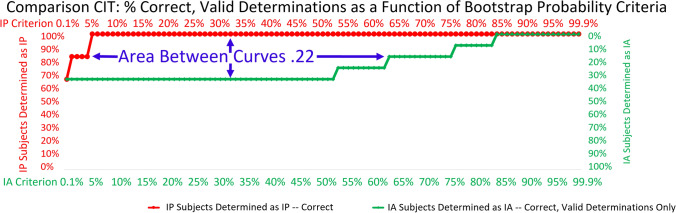
We conducted (I) 18 event-related potential (ERP) field tests to detect concealed information regarding major terrorist crimes and other real-world crimes and (II) 5 ERP tests regarding participation in a classified counterterrorism operation. This study is a test of the brain fingerprinting scientific standards hypothesis: that a specific set of methods for event-related potential (ERP) concealed information tests (CIT) known as the brain fingerprinting scientific standards provide the sufficient conditions to produce less than 1% error rate and greater than 95% median statistical confidence for individual determinations of whether the tested information is stored in each subject's brain. All previous published results in all laboratories are compatible with this hypothesis. We recorded P300 and P300-MERMER ERP responses to visual text stimuli of three types: targets contain known information, irrelevants contain unknown/irrelevant information, and probes contain the situation-relevant information to be tested, known only to the perpetrator and investigators. Classification CIT produced significantly better results than comparison CIT, independent of classification criteria. Classification CIT had 0% error rate; comparison CIT had 6% error rate. As in previous studies, classification-CIT median statistical confidences were approximately 99%, whereas comparison CIT statistical confidences were no better than chance for information-absent (IA) subjects (who did not know the tested information). Over half of the comparison-CIT IA determinations were invalid due to a less-than-chance computed probability of being correct. Experiment (I) results for median statistical confidence: Classification CIT, IA subjects: 98.6%; information-present (IP) subjects (who know the tested information): 99.9%; comparison CIT, IA subjects: 48.7%; IP subjects: 99.5%. Experiment (II) results (Classification CIT): error rate 0%, median statistical confidence 96.6%. Countermeasures had no effect on the classification CIT. These results, like all previous results in our laboratory and all others, support the brain fingerprinting scientific standards hypothesis and indicate that the classification CIT is a necessary condition for a reliable, accurate, and valid brainwave-based CIT. The comparison CIT, by contrast, produces high error rates and IA statistical confidences no better than chance.

Supplementary information: The online version contains supplementary material available at 10.1007/s11571-022-09795-1.

Keywords: Brain fingerprinting; Classification CIT; Comparison CIT; Concealed information test; Counterterrorism; Criminal investigation; Detection of concealed information; ERP; Field study; Forensic neuroscience; Forensic science; Guilty knowledge test; Lie detection; MERMER; P300; P300-MERMER; Scientific standards; Terrorism.


Conflict of interest statement

Conflicts of interestAuthor Farwell has received compensation for related work from Harvard University, the US Central Intelligence Agency, the US Federal Bureau of Investigation, multiple intelligence, counterterrorism, and law enforcement agencies in other countries, the University of Illinois, Brain Fingerprinting Laboratories, Inc., Brain Fingerprinting, LLC, and the Wisconsin Innocence Project. He is a principal in Brain Fingerprinting Laboratories, Inc. and Brain Fingerprinting, LLC. He is the inventor of three related US patents and one related UK patent. He is the author of two books containing related information.

Figures

Fig. 1
Fig. 1
Classification CIT Data Analysis. The BF classification CIT uses bootstrapping on correlations to compute the probability that the brain response to the probe stimuli is (a) significantly more similar to the target response than to the irrelevant response (“information present” determination), (b) significantly more similar to the irrelevant response than to the target response (“information absent” determination), or (c) data are insufficient to make a determination with a high statistical confidence in either direction (indeterminate—no determination is made). All determinations, both information present and information absent, are made with at least a 90% statistical confidence
Fig. 2
Fig. 2
Classification CIT Bootstrap Probabilities and Determinations. The bootstrapping probability computation computes the probability that information present is the correct determination. The probability that information absent is correct is 100% minus the probability that information present is correct. A determination of either information present or information absent requires at least a 90% probability that the selected determination is correct, equivalent to 10% probability that the opposite determination is correct. Otherwise, no determination is made
Fig. 3
Fig. 3
Comparison CIT Data Analysis. The comparison CIT uses bootstrapping to determine if (a) there is greater than a 90% probability that the probe response is larger than the irrelevant response, resulting in an information-present determination; or (b) there is less than a 90% probability that the probe response is larger than the irrelevant response, resulting in an information-absent determination. The probability that information absent is the correct determination is 100% minus the probability that information present is correct. Information-present determinations have a statistical confidence of at least 90%. Information-absent determinations have a statistical confidence of greater than 10%. The statistical model predicts that the average statistical confidence for information-absent determinations is 50% (chance). If the statistical confidence is greater than 50%, the determination is valid, i.e., there is a computed probability of greater than chance that the selected determination is correct. If the statistical confidence is less than 50%, the determination is invalid, i.e., there is a computed probability of less than chance that the determination is correct
Fig. 4
Fig. 4
Comparison CIT Bootstrap Probabilities and Determinations. If the probability is greater than 90% that information present is the correct determination (less than 10% probability that information absent is correct), the subject is determined as information present. If the probability is less than 90% that information present is correct (greater than 10% probability that information absent is correct), the subject is determined as information absent. If the selected information-absent determination has greater than chance (50%) probability of being correct, it is a valid information-absent determination. If the probability that the selected information-absent determination is correct is less than chance (50%), it is an invalid information-absent determination
Fig. 5
Fig. 5
Brain Responses, Experiment 1, Information-Present Subjects. Brain responses to Target, Irrelevant, and Probe stimuli at the Pz electrode site for information-present subjects. X axis : time post-stimulus onset, 0–1800 ms. Y axis : amplitude in microvolts
Fig. 6
Fig. 6
Brain Responses, Experiment 1, Information-Absent Subjects. Brain responses to Target, Irrelevant, and Probe stimuli at the Pz electrode site for information-absent subjects. X axis : time post-stimulus onset, 0–1800 ms. Y axis : amplitude in microvolts
Fig. 7
Fig. 7
COC for Classification CIT: % Correct Determinations as a Function of Bootstrap Probability Criteria. Classification operating characteristic (COC) curve representing the percentage of classification-CIT information-present and information-absent determinations that are correct as a function of bootstrap probability criteria. For information-present subjects: X axis is all possible information-present bootstrap probability criteria in 1% increments in descending order, 99.9%, 99%, 98%…2%, 1%, 0.1%. Y axis is the percentage of correct information-present determinations at each criterion, plotted as distance from the bottom of the graph. For information-absent subjects: X axis is all possible information-absent bootstrap probability criteria in 1% increments in ascending order, 0.1%, 1%, 2%…98%, 99%, 99.9%. Y axis is the percentage of correct information-absent determinations at each criterion, plotted as distance from the top of the graph. At each point along the X axis, the difference between the curves represents the percentage of subjects who would be classified correctly by both the corresponding criteria, information present and information absent. The area between the curves (ABC) is the sum of these differences. Perfect discrimination produces an area of 1. Random discrimination produces an area of 0. The error prevention buffer is the range of bootstrap probability criteria where all determinations, information-present and information-absent, would be correct. Setting the respective criteria at any point in this range results in 0% error rate
Fig. 8
Fig. 8
Comparison CIT: % Correct Determinations as a Function of Bootstrap Probability Criteria. Classification operating characteristic (COC) curve representing the percentage of comparison-CIT information-present and information-absent determinations that are correct as a function of bootstrap probability criteria. Axes, values, and area between curves (ABC) as in Fig. 7. This figure includes all information-present determinations and all information-absent determinations, both valid and invalid
Fig. 9
Fig. 9
Comparison CIT: % Correct, Valid Determinations as a Function of Bootstrap Probability Criteria. Classification operating characteristic (COC) curve representing the percentage of comparison-CIT information-present and information-absent determinations that are correct as a function of bootstrap probability criteria. Axes, values, and area between curves (ABC) as in Fig. 7. This figure includes all (correct) information-present determinations and only information-absent determinations that are correct and valid. Invalid determinations (those with a computed probability of less than 50% of being correct) are excluded
Fig. 10
Fig. 10
Comparison CIT Data Analysis for Subject 18. The comparison CIT compared the amplitude of the probe response with the amplitude of the irrelevant response and determined that the probe response was larger. Target brain responses are not included in the analysis or the plot. Determination: Information Present. Statistical confidence: 99.9%. This determination was an error. Since this is the highest possible statistical confidence, the same erroneous determination would be reached at all possible criteria
Fig. 11
Fig. 11
Classification CIT Data Analysis for Subject 18. The BF classification CIT classified the probe brain response as being more similar to the target brain response than to the irrelevant brain response based on bootstrap correlations. Determination: Information Absent. Statistical confidence: 98.3%. This determination was correct. The same determination would be reached at any criterion less than or equal to 98%

Similar articles

References

    1. Allen J, Iacono WG. A comparison of methods for the analysis of event-related potentials in deception detection. Psychophysiology. 1997;34:234–240. doi: 10.1111/j.1469-8986.1997.tb02137.x. - DOI - PubMed
    1. Bergström ZM, Anderson MC, Buda M, Simon JS, Richardson-Klavehn A. Intentional retrieval suppression can conceal guilty knowledge in ER memory detection tests. Biol Psychol. 2013;94(2013):1–11. doi: 10.1016/j.biopsycho.2013.04.012. - DOI - PMC - PubMed
    1. Efron B. Bootstrap methods: another look at the jackknife. Ann Stat. 1979;7:1–26. doi: 10.1214/aos/1176344552. - DOI
    1. Farwell LA. Brain fingerprinting: corrections to Rosenfeld. Sci Rev Mental Health Pract. 2011;8(2):56–68.
    1. Farwell LA. Brain fingerprinting: a comprehensive tutorial review of detection of concealed information with event-related brain potentials. Cogn Neurodyn. 2012;6:115–154. doi: 10.1007/s11571-012-9192-2. - DOI - PMC - PubMed