Treatment with the senolytics dasatinib/quercetin reduces SARS-CoV-2-related mortality in mice
- PMID: 36704839
- PMCID: PMC10014049
- DOI: 10.1111/acel.13771
Treatment with the senolytics dasatinib/quercetin reduces SARS-CoV-2-related mortality in mice
Abstract
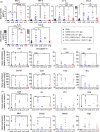
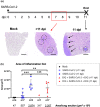
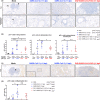
The enormous societal impact of the ongoing COVID-19 pandemic has been particularly harsh for some social groups, such as the elderly. Recently, it has been suggested that senescent cells could play a central role in pathogenesis by exacerbating the pro-inflammatory immune response against SARS-CoV-2. Therefore, the selective clearance of senescent cells by senolytic drugs may be useful as a therapy to ameliorate the symptoms of COVID-19 in some cases. Using the established COVID-19 murine model K18-hACE2, we demonstrated that a combination of the senolytics dasatinib and quercetin (D/Q) significantly reduced SARS-CoV-2-related mortality, delayed its onset, and reduced the number of other clinical symptoms. The increase in senescent markers that we detected in the lungs in response to SARS-CoV-2 may be related to the post-COVID-19 sequelae described to date. These results place senescent cells as central targets for the treatment of COVID-19, and make D/Q a new and promising therapeutic tool.
Keywords: COVID-19; SARS-CoV-2; cellular senescence; senolytics; survival.
© 2023 The Authors. Aging Cell published by Anatomical Society and John Wiley & Sons Ltd.
Conflict of interest statement
C.V.K. declares that he is co‐founder of SenCell Therapeutics S.L.
Figures


Similar articles
-
Senolytics decrease senescent cells in humans: Preliminary report from a clinical trial of Dasatinib plus Quercetin in individuals with diabetic kidney disease.EBioMedicine. 2019 Sep;47:446-456. doi: 10.1016/j.ebiom.2019.08.069. Epub 2019 Sep 18. EBioMedicine. 2019. PMID: 31542391 Free PMC article.
-
Senolytic drugs, dasatinib and quercetin, attenuate adipose tissue inflammation, and ameliorate metabolic function in old age.Aging Cell. 2023 Feb;22(2):e13767. doi: 10.1111/acel.13767. Epub 2023 Jan 13. Aging Cell. 2023. PMID: 36637079 Free PMC article.
-
Targeting senescent cells for the treatment of age-associated diseases.J Biochem. 2025 Mar 4;177(3):177-187. doi: 10.1093/jb/mvae091. J Biochem. 2025. PMID: 39727337 Review.
-
Virus-induced senescence is a driver and therapeutic target in COVID-19.Nature. 2021 Nov;599(7884):283-289. doi: 10.1038/s41586-021-03995-1. Epub 2021 Sep 13. Nature. 2021. PMID: 34517409
-
Pharmacological Targeting of Senescence with Senolytics as a New Therapeutic Strategy for Neurodegeneration.Mol Pharmacol. 2024 Jan 10;105(2):64-74. doi: 10.1124/molpharm.123.000803. Mol Pharmacol. 2024. PMID: 38164616 Review.
Cited by
-
Bioinformatics and system biology approach to discover the common pathogenetic processes between COVID-19 and chronic hepatitis B.PLoS One. 2025 May 23;20(5):e0323708. doi: 10.1371/journal.pone.0323708. eCollection 2025. PLoS One. 2025. PMID: 40408617 Free PMC article.
-
Dasatinib inhibits betacoronavirus replication in macrophages and attenuates pro-inflammatory mediators via SRC-MAPK pathway modulation.Med Microbiol Immunol. 2025 Aug 27;214(1):37. doi: 10.1007/s00430-025-00850-2. Med Microbiol Immunol. 2025. PMID: 40864243
-
The central role of DNA damage in immunosenescence.Front Aging. 2023 Jul 3;4:1202152. doi: 10.3389/fragi.2023.1202152. eCollection 2023. Front Aging. 2023. PMID: 37465119 Free PMC article. Review.
-
Disorganization of secondary lymphoid organs and dyscoordination of chemokine secretion as key contributors to immune aging.Semin Immunol. 2023 Nov;70:101835. doi: 10.1016/j.smim.2023.101835. Epub 2023 Aug 29. Semin Immunol. 2023. PMID: 37651849 Free PMC article. Review.
-
FDA-approved drug repurposing screen identifies inhibitors of SARS-CoV-2 pseudovirus entry.Front Pharmacol. 2025 Mar 17;16:1537912. doi: 10.3389/fphar.2025.1537912. eCollection 2025. Front Pharmacol. 2025. PMID: 40166473 Free PMC article.
References
-
- Boumaza, A. , Gay, L. , Mezouar, S. , Bestion, E. , Diallo, A. B. , Michel, M. , Desnues, B. , Raoult, D. , la Scola, B. , Halfon, P. , Vitte, J. , Olive, D. , & Mege, J. L. (2021). Monocytes and macrophages, targets of severe acute respiratory syndrome coronavirus 2: The clue for coronavirus disease 2019 immunoparalysis. The Journal of Infectious Diseases, 224, 395–406. 10.1093/infdis/jiab044 - DOI - PMC - PubMed
-
- Camell, C. D. , Yousefzadeh, M. J. , Zhu, Y. , Prata, L. G. P. L. , Huggins, M. A. , Pierson, M. , Zhang, L. , O'Kelly, R. D. , Pirtskhalava, T. , Xun, P. , Ejima, K. , Xue, A. , Tripathi, U. , Espindola‐Netto, J. M. , Giorgadze, N. , Atkinson, E. J. , Inman, C. L. , Johnson, K. O. , Cholensky, S. H. , … Robbins, P. D. (2021). Senolytics reduce coronavirus‐related mortality in old mice. Science, 373, eabe4832. 10.1126/science.abe4832 - DOI - PMC - PubMed
-
- Chen, J. , Lau, Y. F. , Lamirande, E. W. , Paddock, C. D. , Bartlett, J. H. , Zaki, S. R. , & Subbarao, K. (2010). Cellular immune responses to severe acute respiratory syndrome coronavirus (SARS‐CoV) infection in senescent BALB/c mice: CD4 + T cells are important in control of SARS‐CoV infection. Journal of Virology, 84, 1289–1301. 10.1128/jvi.01281-09 - DOI - PMC - PubMed
Publication types
MeSH terms
Substances
LinkOut - more resources
Full Text Sources
Medical
Molecular Biology Databases
Miscellaneous

