. 2023 Jul;75(7):1120-1131.
doi: 10.1002/art.42455. Epub 2023 Apr 23.

Association of Dipeptidylpeptidase 4 (CD26) With Chondrocyte Senescence and Radiographic Progression in Knee Osteoarthritis

Affiliations

Association of Dipeptidylpeptidase 4 (CD26) With Chondrocyte Senescence and Radiographic Progression in Knee Osteoarthritis

Yu-Hsiu Chen et al. Arthritis Rheumatol. 2023 Jul.

Abstract

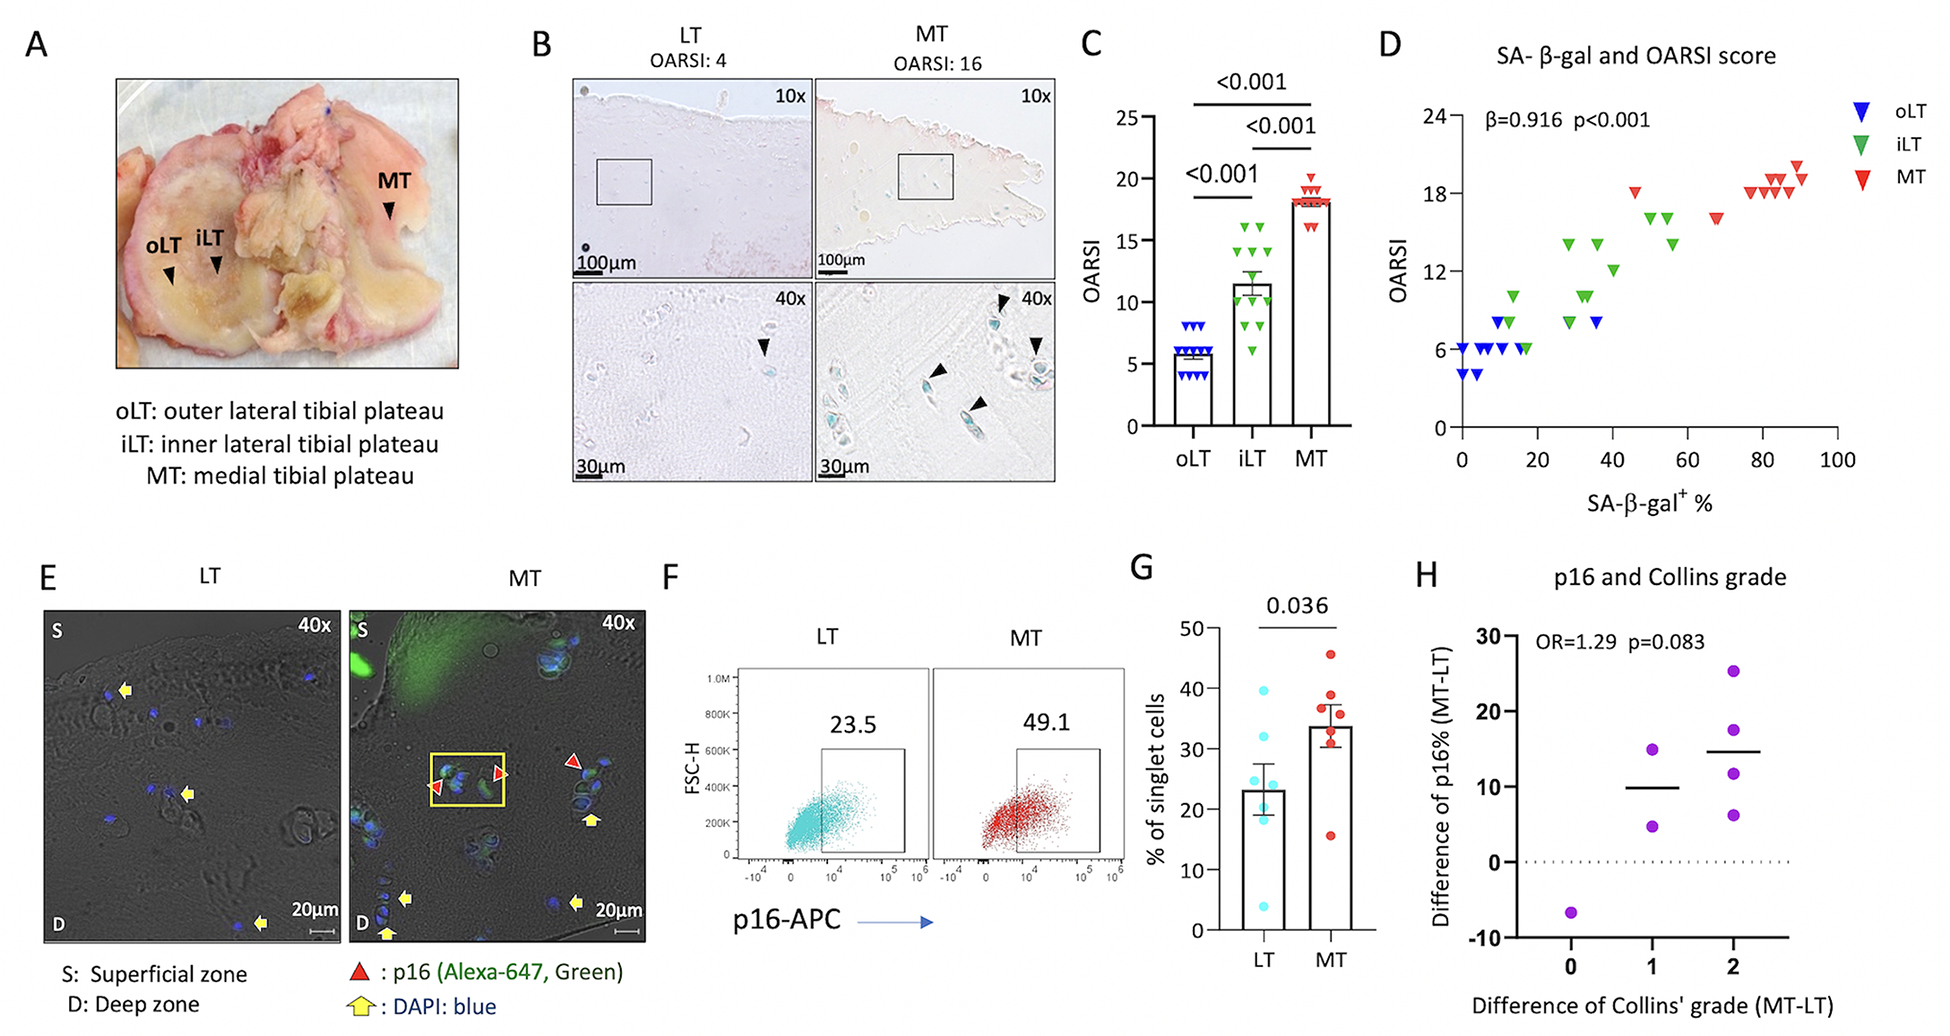
Objective: To evaluate the association of dipeptidylpeptidase 4 (DPP-4; also known as CD26) with cellular senescence of human cartilage and progression of knee osteoarthritis (OA).

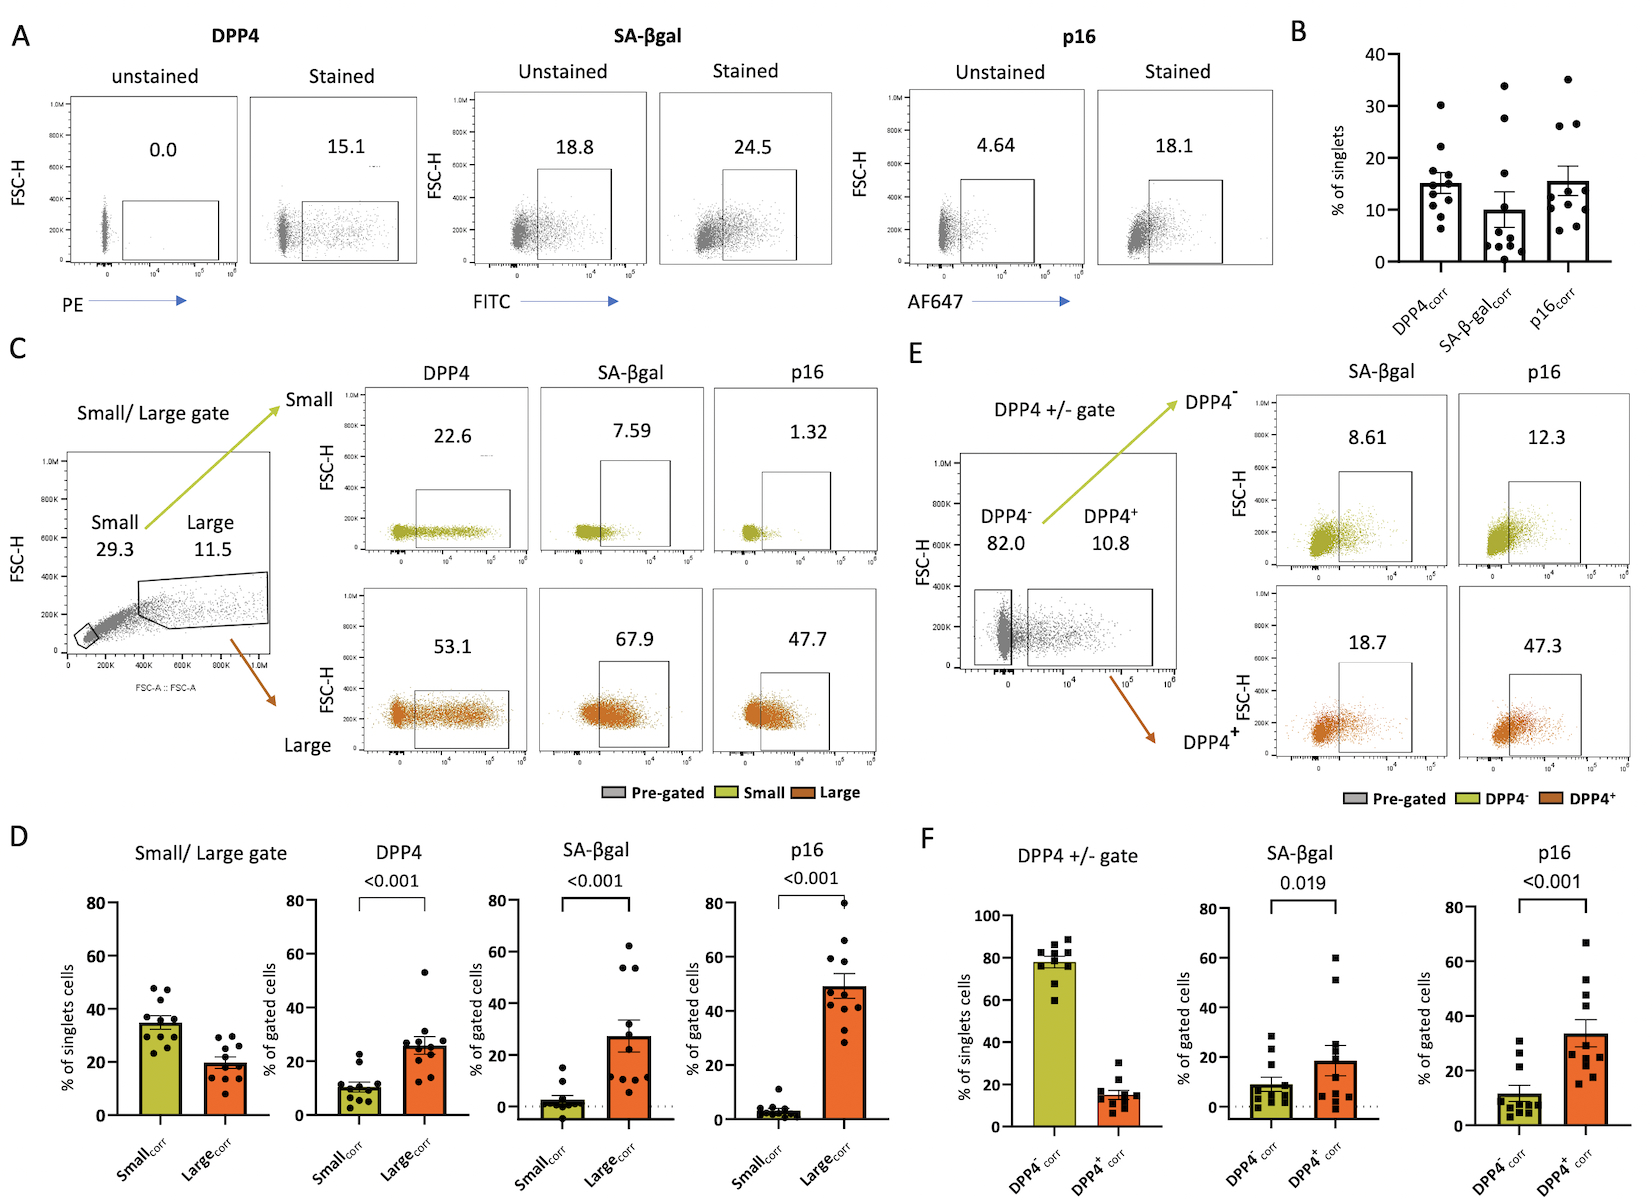
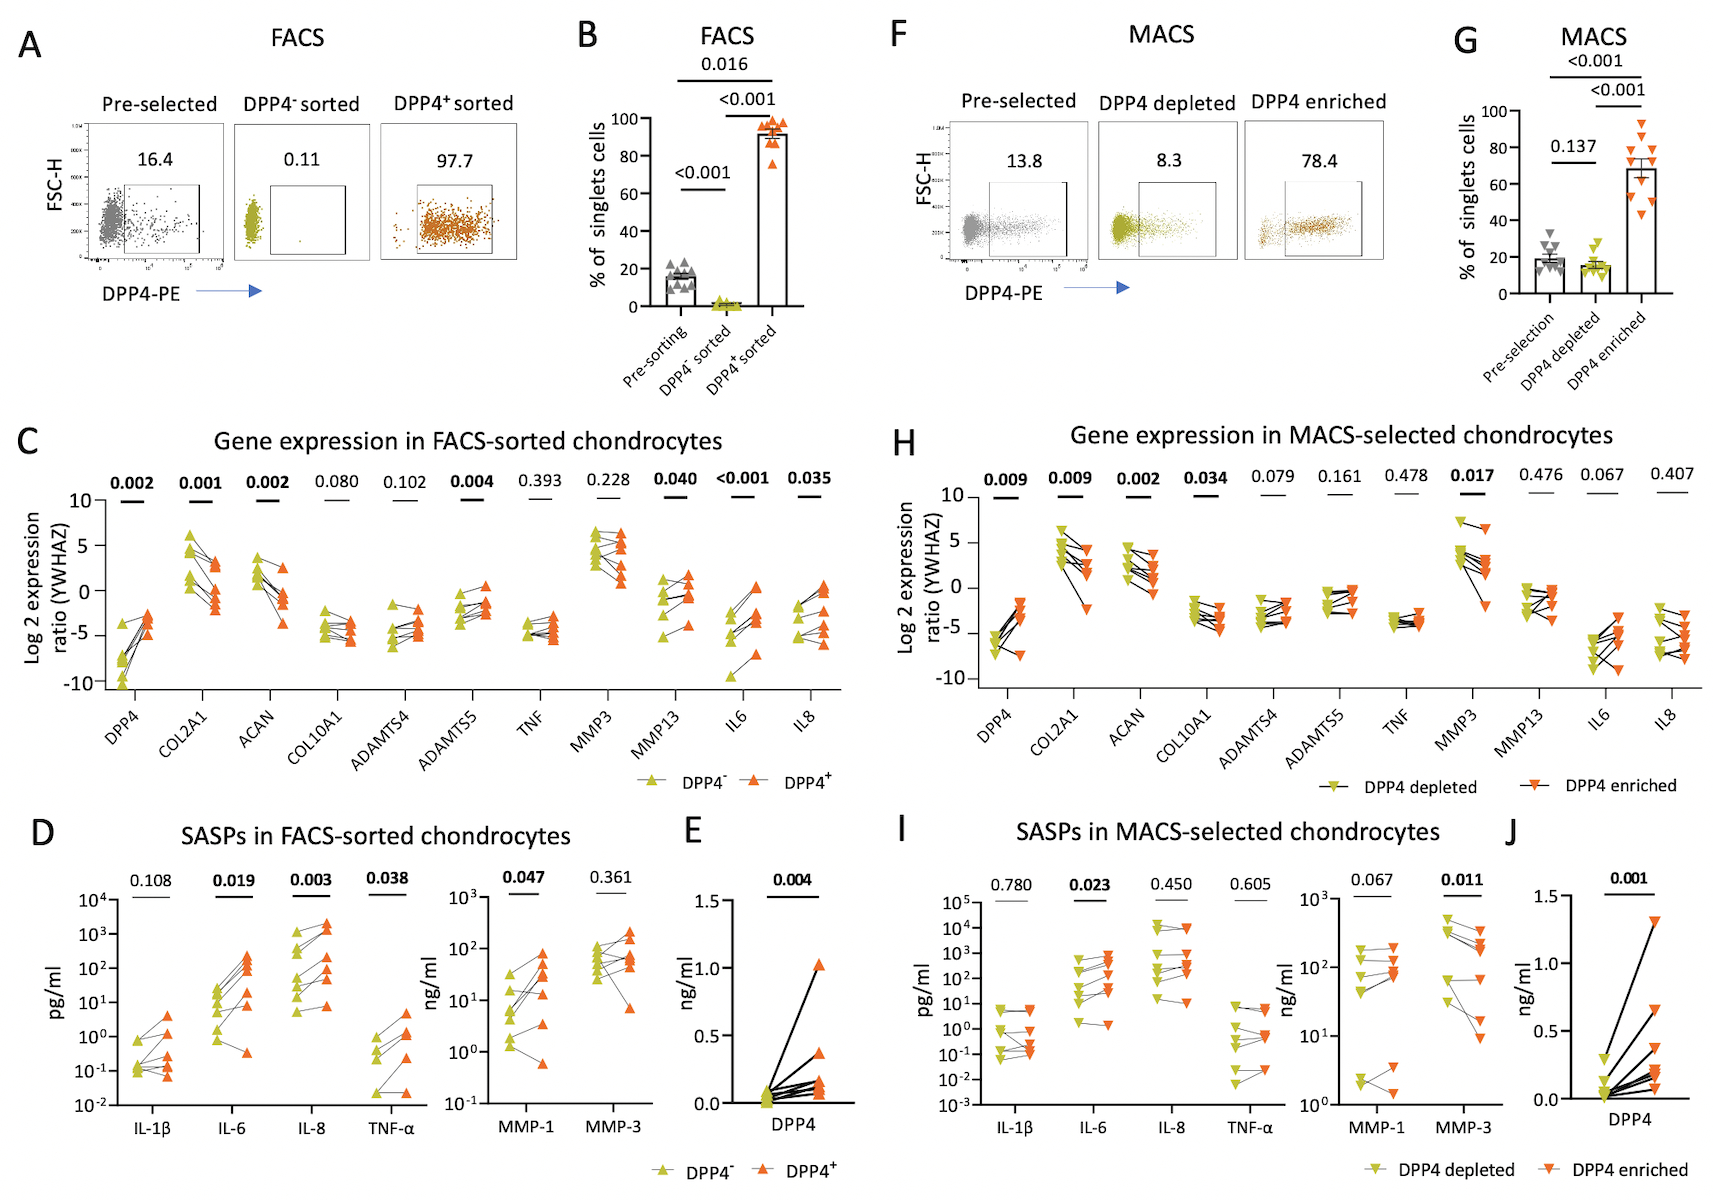
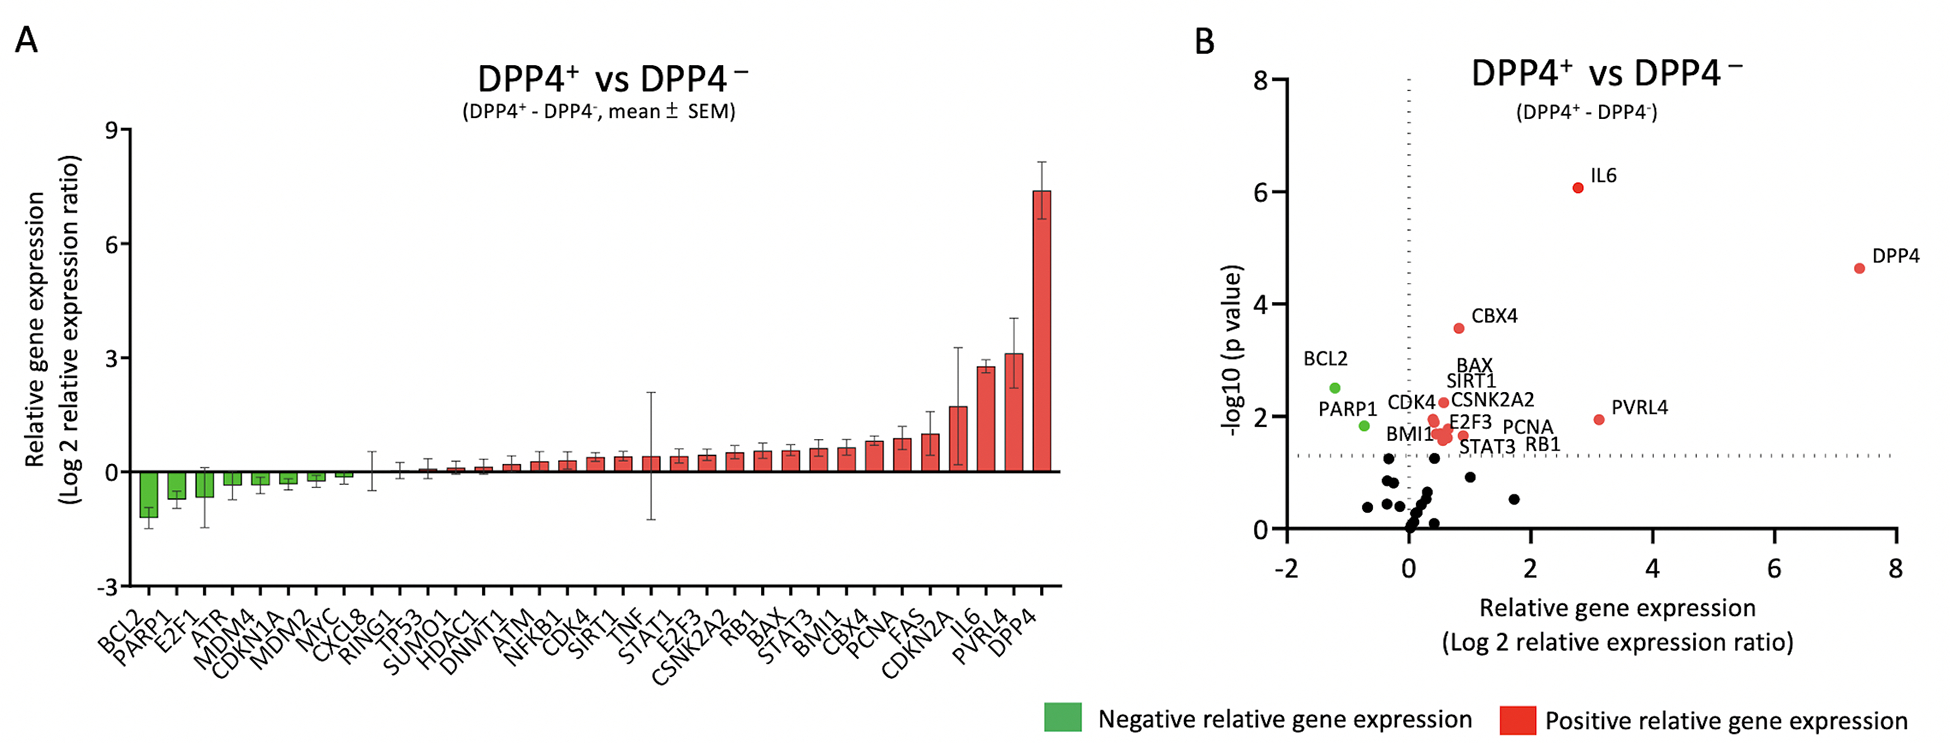
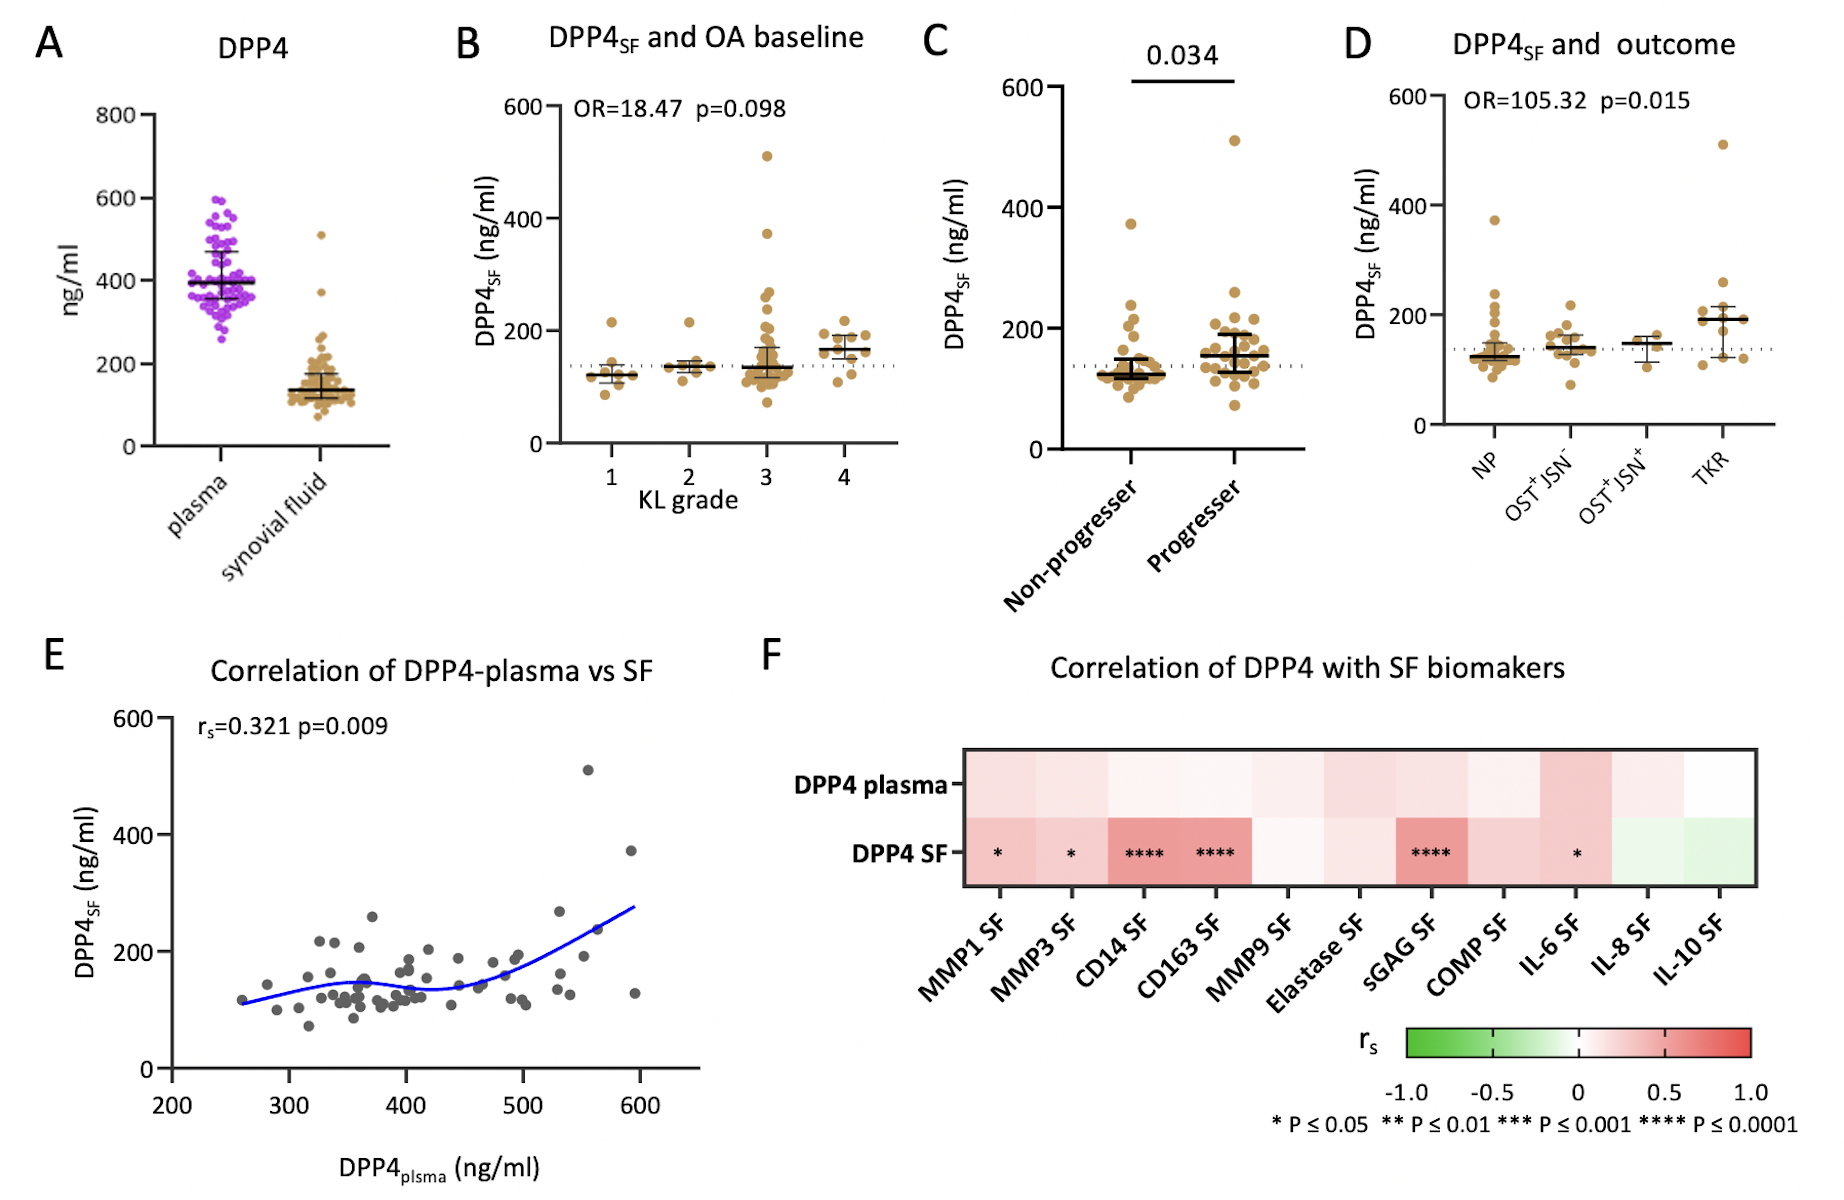
Methods: Articular cartilage sections and chondrocytes were acquired from 35 individuals undergoing total knee replacement for OA to evaluate the following: 1) the association between OA severity and established senescence markers (senescence-associated β-galactosidase activity and p16), which was quantified using immunohistochemistry and flow cytometry (n = 19 samples); 2) the coexpression of DPP-4 with established senescence markers, which was assessed using flow cytometry; and 3) expression levels of anabolic and catabolic genes, senescence-related genes, and senescence-associated secretory phenotypes in DPP-4+ and DPP-4- cells, which were isolated using fluorescence-activated cell sorting or magnetic-activated cell sorting (n = 16 samples). The concentration of soluble DPP-4 was measured in samples of synovial fluid and samples of plasma from the Prediction of Osteoarthritis Progression cohort and then evaluated for association with the severity of radiographic knee OA at baseline (n = 65 samples) and the progression of structural radiographic OA (n = 57 samples) over a 3-year period.

Results: DPP-4 expression was associated with higher senescence-associated β-galactosidase activity, p16 expression, senescence-related gene and catabolic gene (ADAMTS5, MMP13, IL6, and IL8) expression, higher senescence-associated secretory phenotype secretion, and lower anabolic gene (COL2A1 and ACAN) expression in primary chondrocytes. Synovial fluid DPP-4 concentration was associated with radiographic OA progression (odds ratio 105.32; P = 0.015), proteases (synovial fluid matrix metalloproteinase 1 and matrix metalloproteinase 3), aggrecan degradation (synovial fluid sulfated glycosaminoglycan), indicators of activated macrophages (synovial fluid CD14 and CD163), and inflammation (synovial fluid interleukin-6).

Conclusion: Our study identifies DPP-4 as a key surface marker in senescent chondrocytes and a predictor of radiographic OA progression.


Conflict of interest statement

Conflicts of Interest

All authors declare that there are no conflicts of interest associated with this study.

Figures

Figure 1.
Figure 1.. SA- β-gal activity and p16 in chondrocytes were associated with knee OA severity.
Data from 12 patients with medial compartment dominant OA. A) Human tibial plateau demonstrating the gradient of OA severity within an individual: MT>iLT>oLT severity of OA. B) Representative microscopic image demonstrating higher OARSI score of OA severity and SA-β-gal activity in MT than LT. C) OARSI score demonstrating MT>iLT>oLT OA severity (repeated measures ANOVA, n=12). D) Significant positive correlation of OARSI histological scores vs % SA-β-gal+ chondrocyte data scores (n=12). Shown are the correlation of raw values, however, for purposes of statistical analysis, these scores were transformed using a rank-based inverse normal transformation for use in mixed models yielding a significant correlation (β=0.916, p<0.001). p16 expression was qualitatively greater in MT than LT (representative immunofluorescence image in E); the percentage of p16+ chondrocytes by flow cytometry was greater in chondrocytes isolated from MT than LT (F, G, n=7). H) Dot plot demonstrating the correlation of difference in percentage of p16+ chondrocytes (MT-LT) and difference in Collins’ grade (MT-LT) (n=7).
Figure 2.
Figure 2.. DPP4 expressing chondrocytes expressed high levels of traditional senescence markers, SA-β-gal and p16.
A) Representative flow-cytometry image of SA-β-gal activity, p16 and DPP4 expression in stained vs unstained chondrocytes. B) Bar graph depicting the percentage of DPP4, SA-β-Gal activity and p16 expression determined by flow cytometry (n=11). C) Representative flow-cytometry image of SA-β-gal activity, p16 and DPP4 expression in size-gated chondrocytes. D) Bar graphs depicting the higher expression of DPP4, SA-β-gal activity and p16 in large compared with small chondrocytes (n=11). E) Representative flow cytometry image demonstrating the higher expression of SA-β-gal activity and p16 expression in DPP4+ compared with DPP4 gated chondrocytes. F) Bar graph depicting a greater percentage of cells expressing DPP4, SA-β-Gal activity and p16 in DPP4+ compared with DPP4 chondrocytes (n=11).
Figure 3.
Figure 3.. Gene expression and SASPs secretion in osteoarthritic chondrocytes with differential DPP4 expression.
Chondrocytes were sorted based on DPP4 expression using fluorescence-activated cell sorting (FACS) and magnetic-activated cell sorting (MACS) in 16 patients. A) Representative scatterplots display enriched DPP4 expression in FACS-sorted DPP4+ compared with pre-selected, and DPP4 chondrocytes. B) Bar graph depicting a greater percentage of DPP4+ expressing cells in FACS-sorted DPP4+ compared with pre-selected, and DPP4 chondrocytes determined by flow cytometry (n=10). C) Gene expression in FACS-sorted DPP4 and DPP4+ chondrocytes relative to expression of the housekeeping YWHAZ control gene (n=7). D-E) The concentration of the indicated cytokines (I) and DPP4 (J) in the culture supernatants of FACS-sorted DPP4 and DPP4+ chondrocytes (n=7). F) Representative scatterplot displays DPP4 expression in pre-selected, and MACS-selected DPP4depleted and DPP4enriched chondrocytes. G) The percentage of DPP4+ expressing cells in pre-sorted, and MACS-selected DPP4depleted and DPP4enriched chondrocytes determined by flow cytometry (n=10). H) Gene expression in MACS-selected DPP4depleted and DPP4enriched chondrocytes relative to expression of the housekeeping YWHAZ control gene (n=7). I-J) The concentration of the indicated cytokines (I) and DPP4 (J) in the culture supernatants of MACS-selected DPP4depleted and DPP4enriched chondrocytes (n=7).
Figure 4.
Figure 4.. Senescence related genes in DPP4 expressing osteoarthritic chondrocytes.
Osteoarthritic chondrocytes from 8 patients were sorted by DPP4 surface expression using FACS. A) Gene expression was ordered based on the relative differences between sorted DPP4+ and DPP4 chondrocytes. The relative mean (± SEM) difference in gene expression of DPP4+ minus DPP4 sorted osteoarthritic chondrocytes is shown for 33 senescence-related genes. B) Volcano plot of relative gene expression of DPP4+ vs DPP4 sorted chondrocytes demonstrating in DPP4+ a higher expression of DPP4, PVRL4, IL6, CBX4, BAX, SIRT1, CSNK2A, E2F3, PCNA, RB1, CDK4, BMI1, and STAT3 and lower expression of BCL2 and PARP1. Green: negative relative gene expression, red: positive relative gene expression.
Figure 5.
Figure 5.. Soluble DPP4 in knee OA severity and progression.
A) Plasma DPP4 concentration (purple) was higher than median SF DPP4 concentration (brown) (dot plot representing the median and interquartile ranges of DPP4 concentration; n=65 SF and matched plasma). B) SF DPP4 was modestly associated with baseline OA severity represented by KL grade (n=65, Odds ratio=18.47, p=0.098). C) Dot plot demonstrating higher SF DPP4 in the progressor group (defined as any progression), which included OST progression only (OST+/JSN), or OST and JSN progression (OST+JSN+), or TKR during the follow-up interval (n=29), compared with the non-progressor group who had neither OST nor JSN increased scores, nor TKR performed during the follow-up interval (n=28), (Mann-Whitney test, p=0.034). D) SF DPP4 was significantly associated with OA progression (N=57, OR=105.35, p=0.015) defined by outcome groups (NP, OST+JSN, OST+JSN+ and TKR). E) Dot plot with a spline line demonstrating the positive correlation between plasma DPP4 and synovial fluid DPP4 (n=65, rs=0.321 p=0.009). F) SF but not plasma DPP4 correlated significantly with several other OA-related biomarkers in SF.

Comment in

Similar articles

Cited by

References

    1. Kumari R, Jat P. Mechanisms of Cellular Senescence: Cell Cycle Arrest and Senescence Associated Secretory Phenotype. Frontiers in Cell and Developmental Biology. 2021;9(485). - PMC - PubMed
    1. McCulloch K, Litherland GJ, Rai TS. Cellular senescence in osteoarthritis pathology. Aging Cell. 2017;16(2):210–8. - PMC - PubMed
    1. Price JS, Waters JG, Darrah C, Pennington C, Edwards DR, Donell ST, et al. The role of chondrocyte senescence in osteoarthritis. Aging Cell. 2002;1(1):57–65. - PubMed
    1. Diekman BO, Sessions GA, Collins JA, Knecht AK, Strum SL, Mitin NK, et al. Expression of p16(INK) (4a) is a biomarker of chondrocyte aging but does not cause osteoarthritis. Aging cell. 2018;17(4):e12771–e. - PMC - PubMed
    1. Philipot D, Guérit D, Platano D, Chuchana P, Olivotto E, Espinoza F, et al. p16INK4a and its regulator miR-24 link senescence and chondrocyte terminal differentiation-associated matrix remodeling in osteoarthritis. Arthritis Research & Therapy. 2014;16(1):R58. - PMC - PubMed

Publication types

MeSH terms