

MitoStores: chaperone-controlled protein granules store mitochondrial precursors in the cytosol
- PMID: 36704946
- PMCID: PMC10068336
- DOI: 10.15252/embj.2022112309
MitoStores: chaperone-controlled protein granules store mitochondrial precursors in the cytosol
Abstract
Hundreds of nucleus-encoded mitochondrial precursor proteins are synthesized in the cytosol and imported into mitochondria in a post-translational manner. However, the early processes associated with mitochondrial protein targeting remain poorly understood. Here, we show that in Saccharomyces cerevisiae, the cytosol has the capacity to transiently store mitochondrial matrix-destined precursors in dedicated deposits that we termed MitoStores. Competitive inhibition of mitochondrial protein import via clogging of import sites greatly enhances the formation of MitoStores, but they also form during physiological cell growth on nonfermentable carbon sources. MitoStores are enriched for a specific subset of nucleus-encoded mitochondrial proteins, in particular those containing N-terminal mitochondrial targeting sequences. Our results suggest that MitoStore formation suppresses the toxic potential of aberrantly accumulating mitochondrial precursor proteins and is controlled by the heat shock proteins Hsp42 and Hsp104. Thus, the cytosolic protein quality control system plays an active role during the early stages of mitochondrial protein targeting through the coordinated and localized sequestration of mitochondrial precursor proteins.
Keywords: chaperones; mitochondria; proteasome; protein aggregates; protein translocation.
© 2023 The Authors. Published under the terms of the CC BY 4.0 license.
Conflict of interest statement
The authors declare that they have no conflict of interest.
Figures
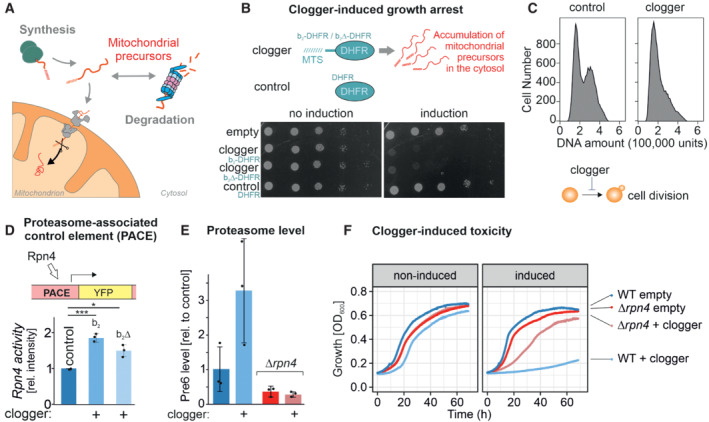
Mitochondrial protein import is under the surveillance of the proteasome.
Competitive inhibition of mitochondrial protein import by clogger proteins inhibits cell growth. Yeast cells expressing clogger proteins (cytochrome b 2‐DHFR and cytochrome b 2Δ19‐DHFR) or cytosolic DHFR for comparison under the control of the galactose‐inducible promoter were grown to mid‐log phase on lactate medium. Ten‐fold serial dilutions were dropped on lactate (no induction) or lactate with 0.5% galactose medium (induction). MTS, matrix‐targeting signal.
After expression of the clogger b 2‐DHFR or the DHFR control, cellular DNA was stained with propidium iodide and DNA content was assessed by flow cytometry. Please note that the first peak shows cells in G1 phase, and the second peak represents cells in the G2 phase.
Rpn4‐driven gene induction was measured using a reporter that expressed the yellow fluorescence protein under control of a PACE element. Cells were grown in lactate medium, and clogger expression was induced for 4.5 h with galactose before starting the experiment (Boos et al, 2019). Data are displayed as mean ± standard deviations from n = 3 independent biological replicates. Significance was assessed using a two‐sided, paired Student's t‐test. P‐values are indicated as asterisks. *P ≤ 0.05, ***P ≤ 0.001.
Levels of the proteasome protein Pre6 were detected upon the expression of cytosolic DHFR or clogger by Western blotting and quantified from three replicates. Cells were grown in lactate medium and clogger expression was induced for 4.5 h with 0.5% galactose before samples were harvested and lysed. Data are displayed as mean ± standard deviations from n = 3 independent biological replicates.
Cells of the indicated strains were grown to log phase and diluted in lactate (no induction) or lactate with 0.5% galactose (induction) to 0.1 OD600. Growth was monitored upon constant agitation at 30°C.
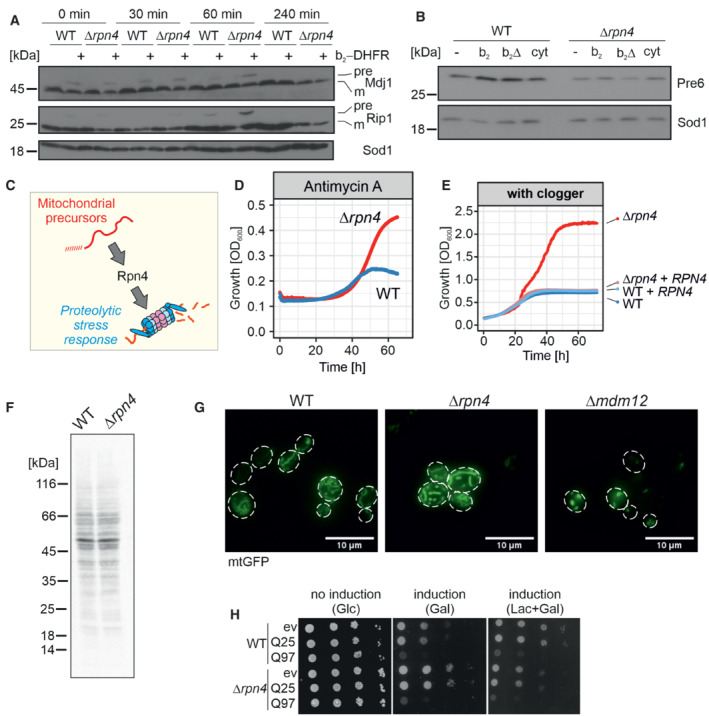
After 4.5 h of clogger expression in wild‐type and Δrpn4 cells, the medium was exchanged for a noninducing lactate medium. Precursor (pre) and mature (m) forms of the mitochondrial proteins Mdj1 and Rip1 were visualized by Western blotting. Sod1 was used as a loading control.
After 4.5 h expression of clogger and control, protein levels of the proteasome subunit Pre6 were visualized by Western Blotting. Please note, that in Δrpn4 cells, clogger expression does not lead to Pre6 induction. Sod1 served as a loading control.
Schematic representation of Rpn4‐dependent proteasome induction after mitoprotein‐induced stress.
Cells of the indicated strains were grown to log phase and diluted in lactate medium to 0.1 OD600. After the addition of 100 μg/ml antimycin A, growth was monitored upon constant agitation. Since antimycin A loses its activity over time, cells start growing once the membrane potential reaches a level that allows mitochondrial biogenesis. Δrpn4 cells escaped the antimycin A‐mediated growth inhibition more efficiently than wild‐type cells.
Clogger‐expressing wild‐type and Δrpn4 cells harboring empty or Rpn4‐expression plasmids were grown over time in lactate plus 0.5% galactose medium.
Wild‐type and Δrpn4 cells were grown in lactate medium to log phase. 2 μl of 22 μCi of 35S‐methionine was added to the cell suspension. After 5 min, cells were harvested, lysed, and subjected to SDS gel electrophoresis and autoradiography.
The indicated strains were transformed with plasmids expressing mitochondria‐targeted GFP (mtGFP). The mitochondrial network was visualized by microscopy upon growth on galactose. Cells lacking Mdm12 were used as a control for a strain showing defective mitochondrial network formation (Dimmer et al, 2002). Scale bars, 10 μm.
Yeast cells expressing a fusion protein of the N‐terminal region of human huntingtin with different lengths of glutamine residues (Q25‐GFP and Q97‐GFP, respectively; Schlagowski et al, 2021) and GFP under control of the galactose‐inducible promoter, or a control for comparison were grown to mid‐log phase on noninducing glucose medium. Ten‐fold serial dilutions were dropped on glucose (no induction), galactose (induction), or lactate with 0.5% galactose medium (induction).
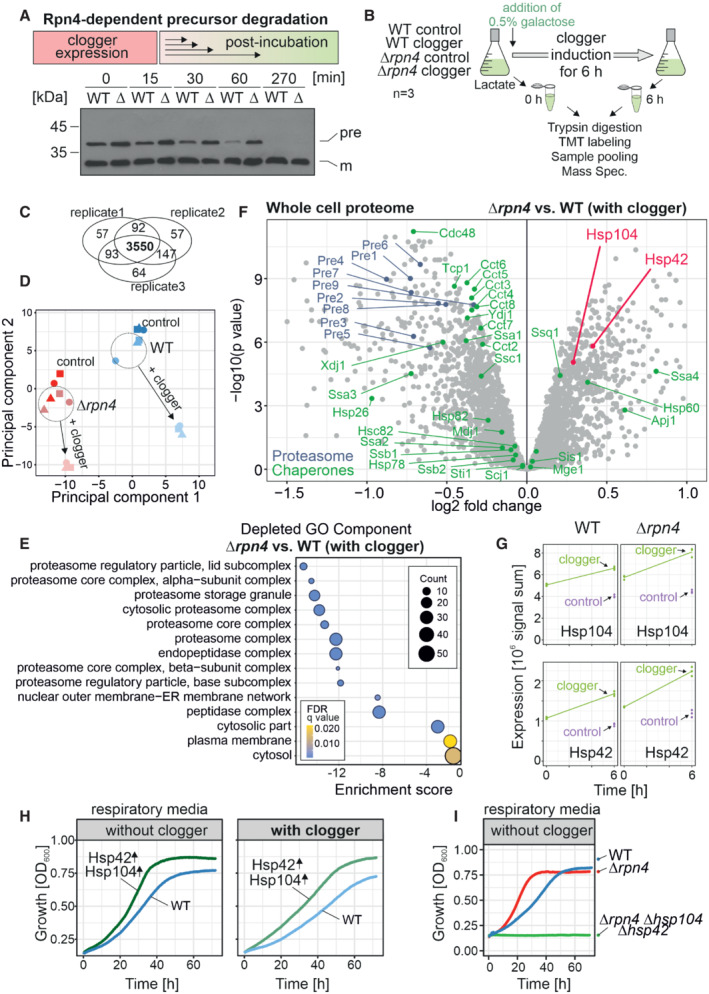
The clogger was expressed in wild‐type (WT) and Δrpn4 (Δ) cells for 4.5 h with medium containing 0.5% galactose. Medium was exchanged for a noninducing lactate medium. Precursor (pre) and mature (m) forms of the b 2Δ‐DHFR clogger were visualized by Western blotting using a DHFR‐specific antibody.
The clogger was induced for 6 h with 0.5% galactose before cellular proteomes were measured by mass spectrometry. See Materials and Methods for further details.
3,550 proteins were measured in all samples of the three replicates.
Principal component analysis. Presence of Rpn4 and clogger expression caused specific changes in the proteome. The different shapes of the data points indicate the three different biological replicates.
GO Term Analysis was done using the GOrilla tool (
http://cbl‐gorilla.cs.technion.ac.il/ ; Eden et al, 2009). The absence of Rpn4 caused a broad reduction in the components of the proteasome‐ubiquitin system. The number of proteins in the indicated GO components is stated as “Counts.”Comparison of the proteome of wild‐type and Δrpn4 cells after clogger expression for 6 h. Positions of proteins of the proteasome and chaperone systems are indicated in blue and green, respectively. Please note that Hsp104 and Hsp42 (indicated in magenta) show a higher abundance in Δrpn4 cells. See Dataset EV1 for details.
Signals of Hsp104 and Hsp42 before and after clogger induction in wild‐type and Δrpn4 cells. The cytosolic soluble DHFR protein was expressed for control. The strains were grown in lactate medium and clogger expression was induced with 0.5% galactose for 6 h.
Wild‐type carrying plasmids for the GAL‐induced expression of the clogger and for the constitutive expression (from TPI promoter) of Hsp42 and Hsp104 were grown on lactate medium to mid‐log phase and used to inoculate cultures with synthetic lactate (no clogger expression) or lactate plus 0.5% galactose (with clogger). Cell growth was measured over time.
The respective strains were grown in lactate medium. Growth was monitored upon constant agitation at 30°C.
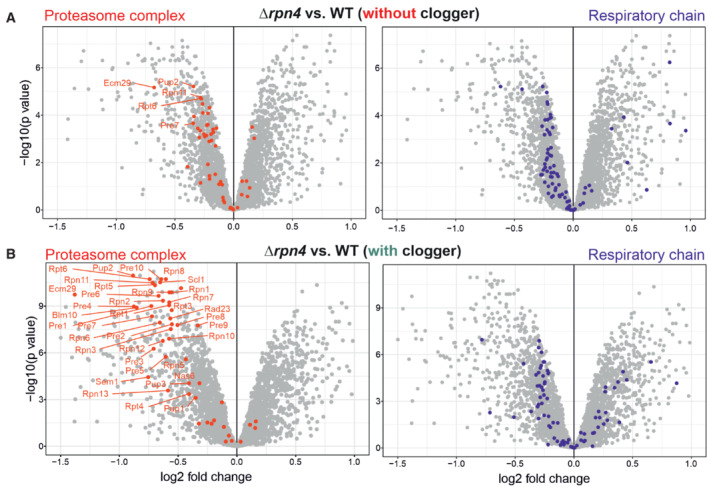
- A, B
Comparison of the proteome of wild‐type and Δrpn4 cells before and after clogger expression for 6 h. Positions of proteins of the proteasome and the respiratory chain systems are indicated in red and purple, respectively (Morgenstern et al, ; Boos et al, 2019). Please note especially the proteasomal proteins show a lower abundance in Δrpn4 cells.
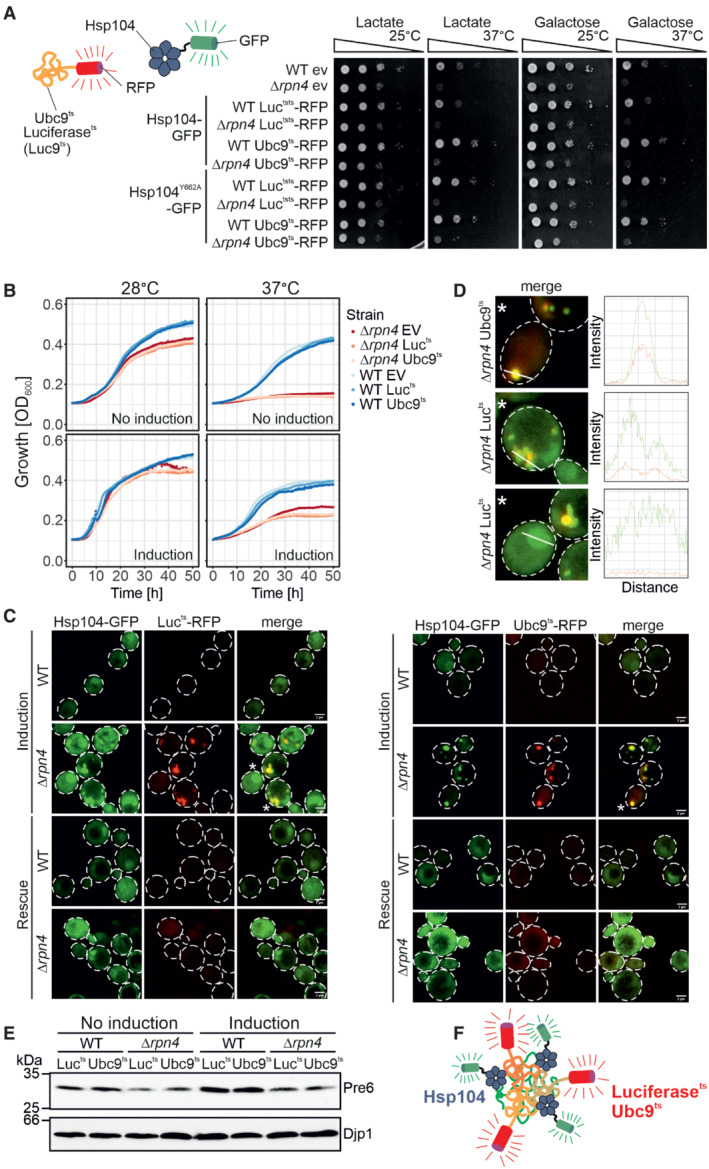
Yeast cells expressing the temperature‐sensitive, aggregation‐prone proteins luciferasets‐RFP (Lucts‐RFP) and Ubc9ts‐RFP under galactose‐inducible promoters together with constitutively expressed Hsp104‐GFP or Hsp104Y662A‐GFP were grown to mid‐log phase on lactate medium. Ten‐fold serial dilutions were dropped on lactate (no induction) or galactose medium (induction) and incubated at 25°C or 37°C as indicated.
Cells of the indicated strains were grown to log phase and diluted in lactate (no induction) or galactose (induction) to 0.1 OD. Growth was monitored upon constant agitation at 28°C and 37°C, respectively.
After 2 h of Lucts‐RFP or Ubc9ts‐RFP expression together with constitutive Hsp104‐GFP expression at 37°C (induction), cells were incubated for 4 h in the absence of galactose at 30°C (rescue). Scale bars, 2 μm.
Fluorescence intensity profiles of cells marked with an asterisk in (C). The measured area is indicated with a white line.
After 4 h growth on lactate medium (no induction) or galactose medium (induction), the protein level of the proteasomal protein Pre6 was visualized by Western Blotting. Djp1 was used as a loading control.
Schematic representation of the interaction of aggregation‐prone proteins with Hsp104.
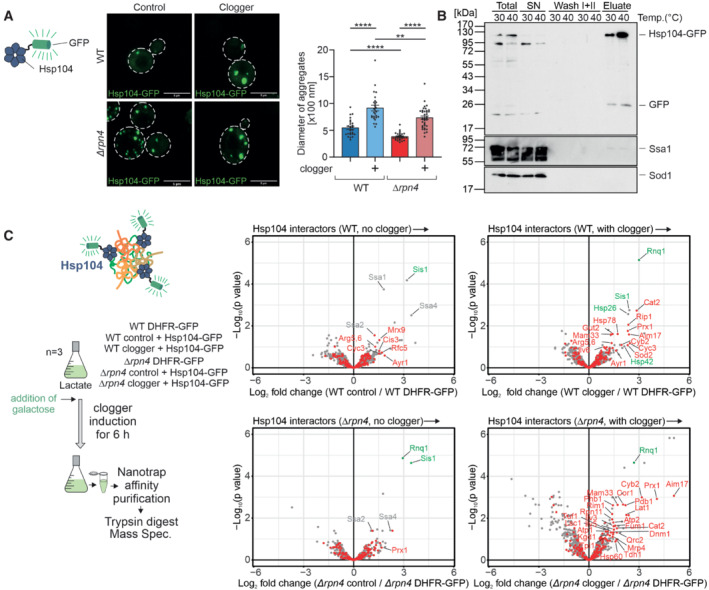
Cytosolic DHFR (control) or the clogger protein b 2‐DHFR was expressed in wild‐type and Δrpn4 cells for 4.5 h. The distribution of constitutively expressed Hsp104‐GFP was visualized by fluorescence microscopy. Diameter of Hsp104‐GFP‐bound aggregates was quantified. Data are displayed as mean ± standard deviations from n = 36 independent biological replicates. Significance was assessed using a two‐sided, paired Student's t‐test. P‐values are indicated as asterisks **P ≤ 0.01, ****P ≤ 0.0001. See also Fig EV4A for quantification of the number of aggregates per cell. Scale bars, 5 μm.
Hsp104‐GFP was purified on nanotrap sepharose in wild‐type cells that were grown at the indicated temperatures. SN, supernatant representing the nonbound fraction. The signals for Ssa1 and Sod1 are shown for control.
Hsp104‐GFP or DHFR‐GFP were co‐expressed with clogger or the DHFR control in wild‐type and Δrpn4 cells. Clogger expression was induced with 0.5% galactose for 6 h before cells were lysed, and the extracts were subjected to nanotrap sepharose chromatography. Purified proteins were analyzed by tandem mass spectrometry. Mitochondrial proteins are highlighted in red, specific chaperones and Rnq1 are indicated in gray or green. The Hsp104 data point was omitted for better scaling of the figure. See Dataset EV2 for details.
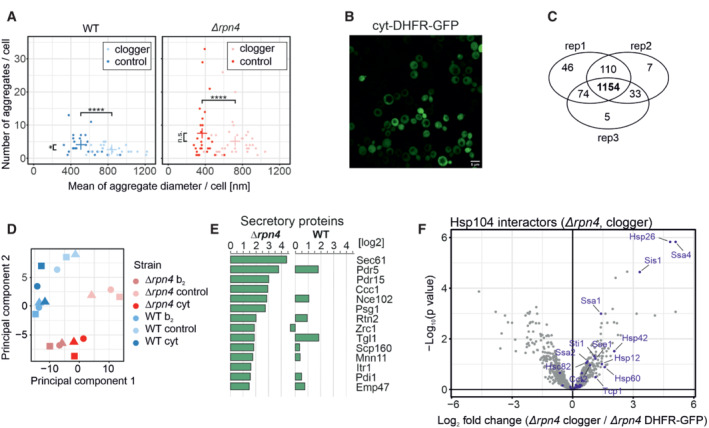
Quantification of aggregate formation in WT and Δrpn4 cells expressing either the clogger or a cytosolic DHFR as a control for 4.5 h. Plotted are the mean diameters of the individual aggregates in nm, as well as the number of aggregates per cell. Data are displayed as mean ± standard deviations from n = 36 independent biological replicates. Significance was assessed using a two‐sided, paired Student's t‐test. P‐values are indicated as asterisks. asterisks **P ≤ 0.01, ****P ≤ 0.0001.
After expressing the cytosolic DHFR‐GFP construct for 4.5 h in WT cells, the expression was visualized by confocal microscopy. Scale bars, 10 μm.
Identification overview of the mass spectrometry. 1,154 proteins were measured in all samples of the three replicates.
Principal component analysis. Rpn4 deletion and clogger expression caused specific changes in the proteome. The different shapes of the individual data points indicate the three biological replicates.
Purified proteins of the secretory pathway interacting with Hsp104‐GFP in Δrpn4 expressing the clogger normalized to the control.
Hsp104 interactors in the presence of clogger relative to interactors of DHFR‐GFP. Chaperones are shown in purple.
- A
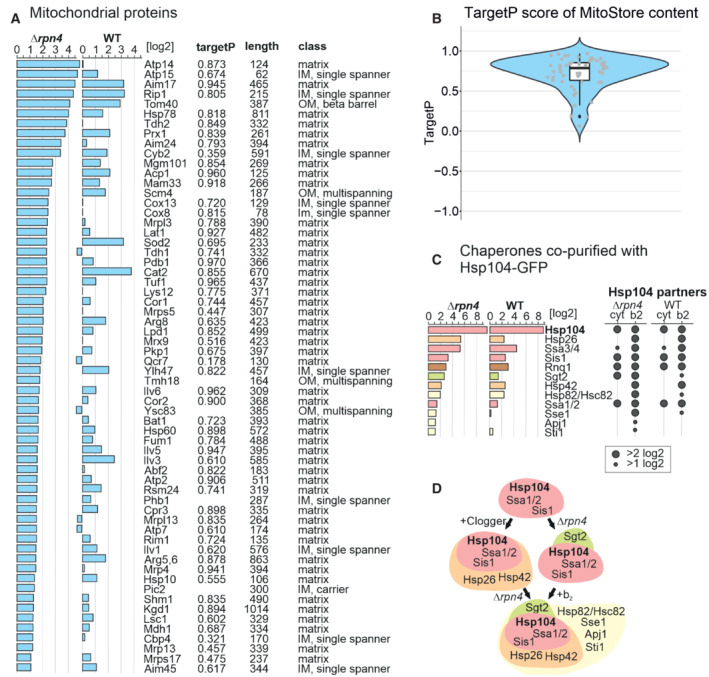
Mitochondrial precursor proteins co‐purified with Hsp104‐GFP upon clogger expression in Δrpn4 and wild‐type cells. Proteins were listed according to their enrichment in the Hsp104‐GFP sample in comparison to the DHFR‐GFP control. Scores for matrix‐targeting probabilities (targetP; Emanuelsson et al, 2000) and mitochondrial location of the proteins are shown. IM, inner membrane; OM, outer membrane. TargetP values were calculated for matrix and presequence‐containing IM proteins.
- B
MitoStore clients are characterized by high probability scores for mitochondrial targeting. The central band denotes the median, the box denotes the first and third quartiles, and the whiskers extend to the largest value no further than 1.5 times the interquartile range from the box.
- C, D
Chaperones co‐isolated on the nanotrap beads with the Hsp104‐GFP protein (in comparison to DHFR‐GFP) in the presence of the clogger or the control. Hsp26, Hsp42, and Sse1 are co‐isolated with Hsp104 in the presence of clogger but not upon expression of the DHFR control.
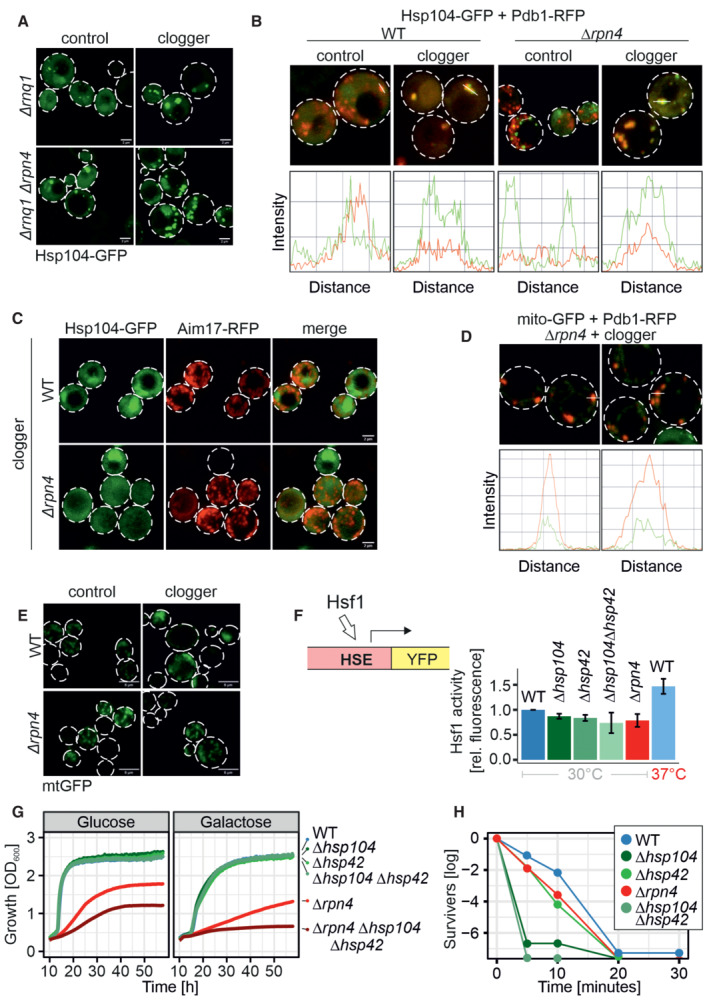
Microscopy of Δrnq1 and Δrpn4Δrnq1 cells expressing Hsp104‐GFP constitutively and the clogger or cytosolic control for 4.5 h. Please note that the formation of MitoStores did not depend on the yeast prion protein Rnq1. Scale bars, 2 μm.
Quantification of the colocalization of Hsp104‐GFP with Pdb1‐RFP after clogger expression for 4.5 h.
After 4.5 h of clogger and Aim17‐RFP expression, WT and Δrpn4 cells were incubated for 4 h in the absence of galactose. Whereas Hsp104‐GFP was distributed throughout the cytosol after this chase period, Aim17‐RFP showed a distribution pattern characteristic of mitochondrial proteins.
Quantification of the colocalization of mito‐GFP with Pdb1‐RFP after clogger expression for 4.5 h in the Δrpn4 mutant.
Cells expressing mitochondria‐targeted GFP (mtGFP) were grown in lactate medium containing 0.5% galactose for 4.5 h and visualized. Whereas Δrpn4 cell mtGFP shows a typical mitochondrial staining even upon clogger expression, the fluorescence in the clogger‐expressing wild‐type cells is more patchy and less defined. Scale bars, 5 μm.
Expression of a heat shock response reporter that uses a YFP cassette expressed under the control of a heat shock element in the different strains indicated (Zheng et al, ; Boos et al, 2019). Cells were grown in lactate containing medium. Note that induction to 37°C activated the heat shock promoter, but the deletion of Hsp42, Hsp104, or Rpn4 under the nonchallenged conditions of the experiment did not. Data are displayed as mean ± standard deviations from n = 3 independent biological replicates.
Cells of the indicated strains were grown to log phase and diluted in glucose or galactose medium to 0.1 OD600. Growth was monitored upon constant agitation at 37°C, respectively.
Cells were grown in lactate to mid‐log phase before 50°C heat stress was performed for the indicated time points. After each time aliquots were removed, and the number of living cells was assessed by a plating assay.
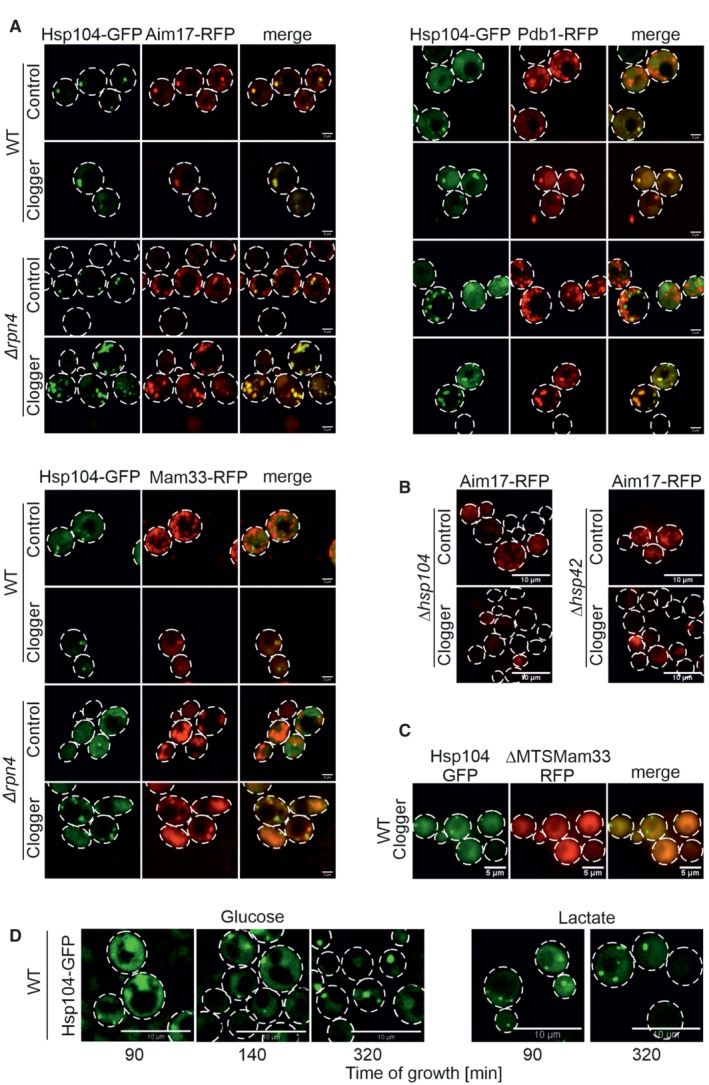
The mitochondrial proteins Pdb1, Mam33, and Aim17 were co‐expressed for 4.5 h with clogger as fusions with the red fluorescent protein RFP (mCherry). Fluorescence microscopic images of the indicated mitochondrial proteins visualized 4.5 h after induction of the clogger or cytosolic DHFR for control. For quantification of colocalization see Fig EV5D. Scale bars, 2 μm.
Mutants lacking Hsp104 and Hsp42 were transformed with Aim17‐expressing plasmids and grown to mid‐log phase in lactate medium. Clogger expression was induced for 4.5 h with 0.5% galactose before microscopy was performed. Please note that in the absence of Hsp42 and Hsp104, no Aim17‐RFP‐containing granules are formed. Scale bars, 10 μm.
Wild‐type cells were transformed with plasmids for the simultaneous expression of the clogger and an N‐terminally truncated version of Mam33‐RFP (both under control of GAL promoter) together with constitutively expressed Hsp104‐GFP (TPI promoter). The cells were grown on lactate plus 0.5% galactose‐containing medium for 4.5 h. The distribution of the fluorescent proteins was visualized by microscopy. Scale bars, 5 μm.
Wild‐type cells expressing Hsp104‐GFP were grown on glucose or lactate medium to log phase. Cells were diluted and visualized by life cell imaging. Please note, that in glucose media, Hsp104‐GFP is initially dispersed in cells and only aggregates when cells become stationary. By contrast, Hsp104‐GFP‐containing granules are frequent on lactate medium even at the log phase. See Movie EV1 for life cell imaging of glucose‐grown cells. Scale bars, 10 μm.
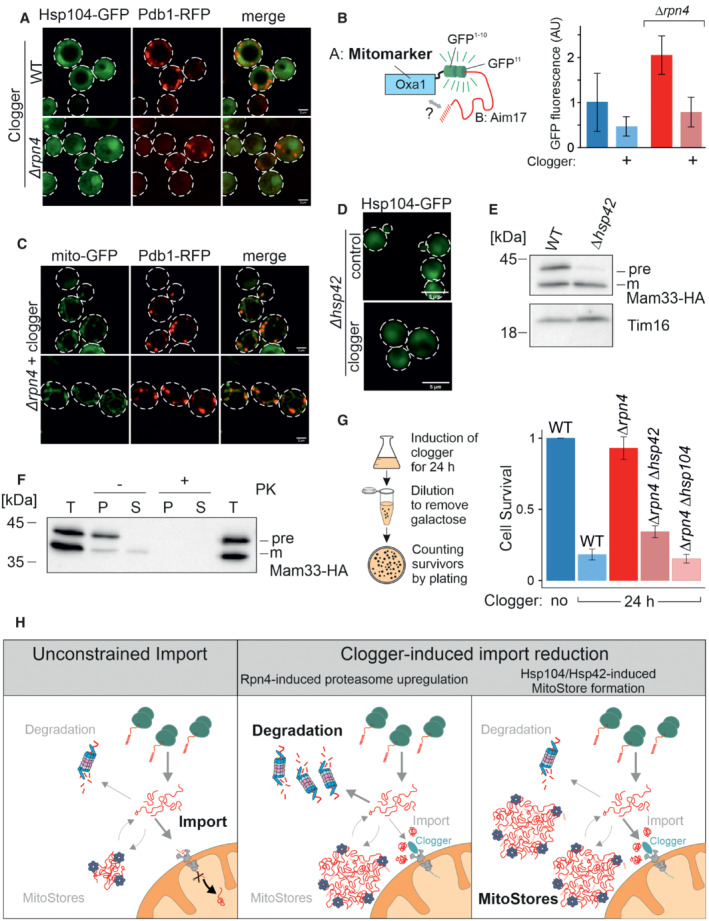
After 4.5 h of the galactose‐induced expression of clogger and Pdb1‐RFP, cells were incubated for 4 h in the absence of galactose. Whereas Hsp104‐GFP was distributed throughout the cytosol after this chase period, Pdb1‐RFP showed a distribution pattern characteristic of mitochondrial proteins. Scale bars, 2 μm.
To verify that stored proteins are chased into the mitochondrial matrix, Aim17‐GFP11 was co‐expressed with a clogger for 4.5 h in cells containing mitochondria with Oxa1‐GFP1‐10. Cells were washed in galactose‐free buffer and further incubated for 4 h before fluorescence was measured to quantify the matrix‐localized Aim17 proteins. Data are displayed as mean ± standard deviations from n = 3 independent biological replicates.
Clogger was expressed for 4.5 h before colocalization of MitoStores (visualized by Pdb1‐RFP), and mitochondria (stained with matrix‐residing mito‐GFP) were assessed. Scale bars, 2 μm.
Clogger was expressed for 4.5 h in Δhsp42 cells before Hsp104‐GFP was visualized. Please note that in the absence of Hsp42, no aggregates were detected. Scale bars, 5 μm.
Clogger and Mam33‐HA were co‐expressed for 4.5 h in wild‐type and Δhsp42 cells. Mitochondria were isolated and subjected to Western blotting to detect mature (m) and precursor (pre) forms of Mam33‐HA. The matrix protein Tim16 served as a loading control.
The mitochondria used for (E) were treated with proteinase K (PK) to remove surface‐exposed proteins. Mitochondrial membranes were lysed with NP‐40 and soluble (S) and aggregated (P) proteins were separated by centrifugation. T, total.
To measure the toxicity of clogger expression, clogger proteins were induced for 24 h with lactate medium containing 0.5% galactose in the mutants indicated. Aliquots were removed, and the number of living cells was assessed by a plating assay on glucose‐containing plates. The resistance of Δrpn4 to clogger expression depends on Hsp104 and Hsp42. Data are displayed as mean ± standard deviations from n = 3 independent biological replicates.
Schematic representation of cytosolic MitoStores.
Comment in
-
MitoStores: a place for precursors to ride out the storm.EMBO J. 2023 Apr 3;42(7):e113576. doi: 10.15252/embj.2023113576. Epub 2023 Mar 6. EMBO J. 2023. PMID: 36876922 Free PMC article.
References
-
- Benjamini Y, Hochberg Y (1995) Controlling the false discovery rate: a practical and powerful approach to multiple testing. J R Stat Soc B Methodol 57: 289–300
Publication types
MeSH terms
Substances
LinkOut - more resources
Full Text Sources
Molecular Biology Databases
