. 2023 Jul;19(7):2078-2093.
doi: 10.1080/15548627.2023.2170962. Epub 2023 Feb 10.

Blockage of autophagosome-lysosome fusion through SNAP29 O-GlcNAcylation promotes apoptosis via ROS production

Affiliations

Blockage of autophagosome-lysosome fusion through SNAP29 O-GlcNAcylation promotes apoptosis via ROS production

Francesca Romana Pellegrini et al. Autophagy. 2023 Jul.

Abstract

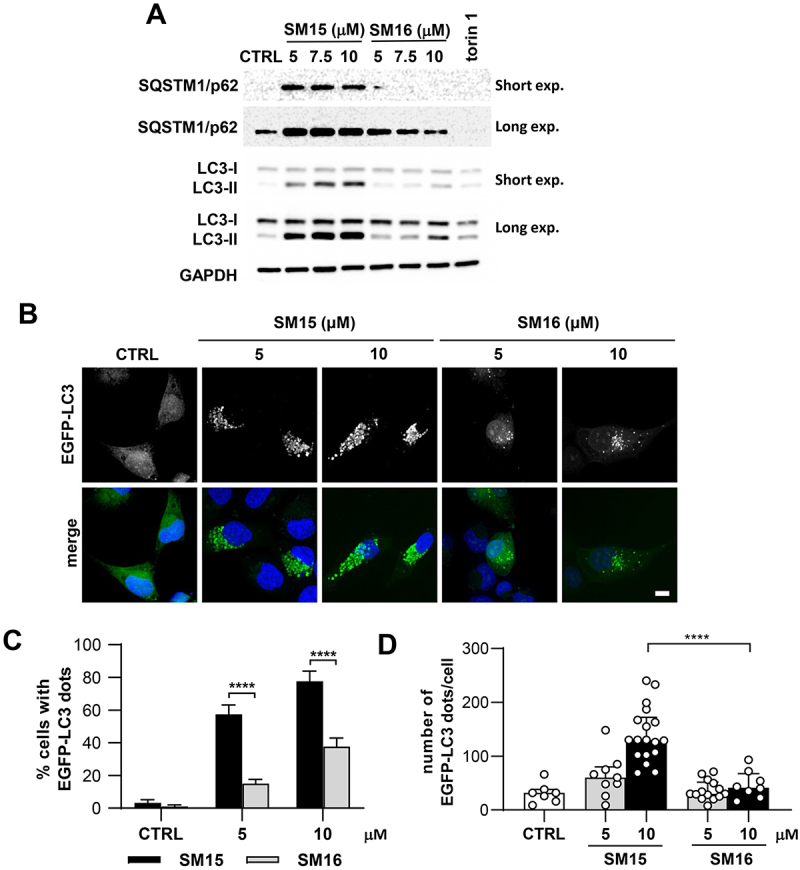
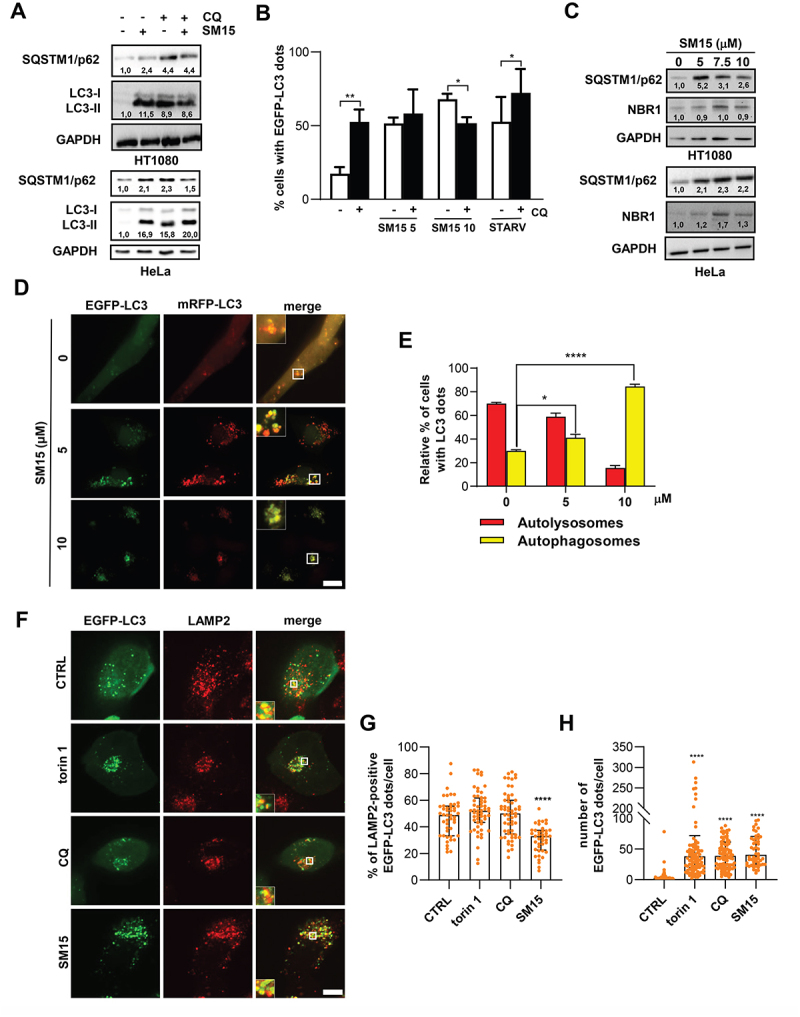
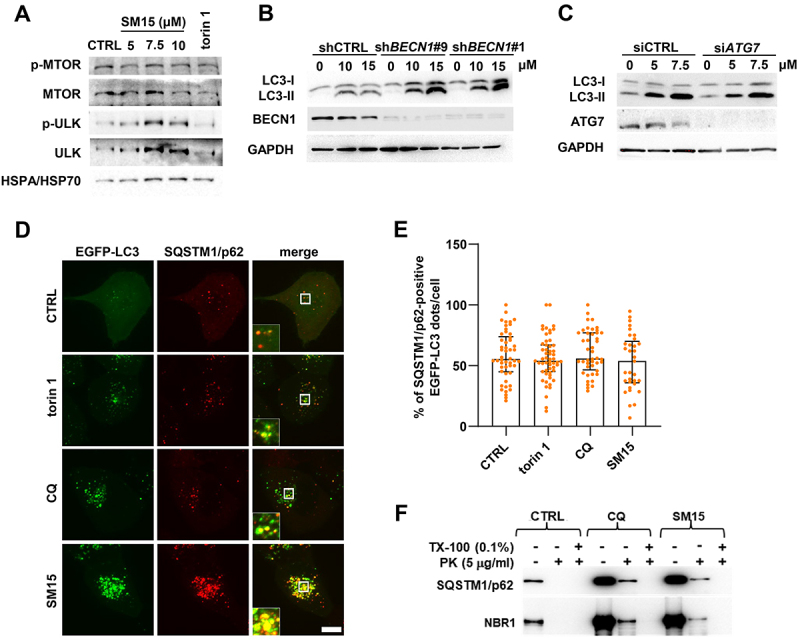
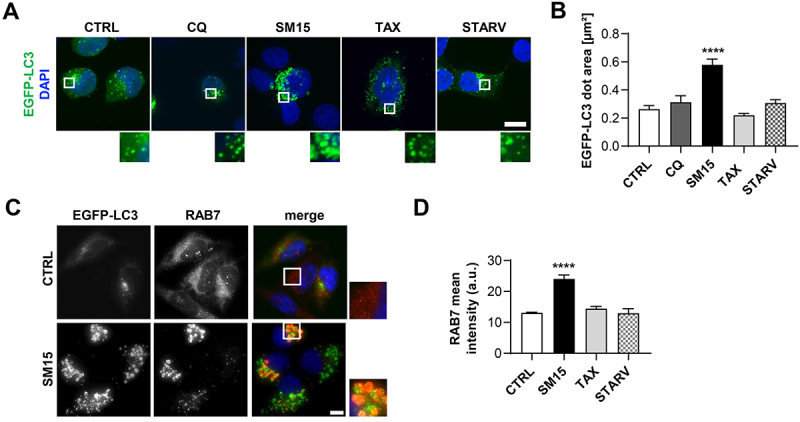
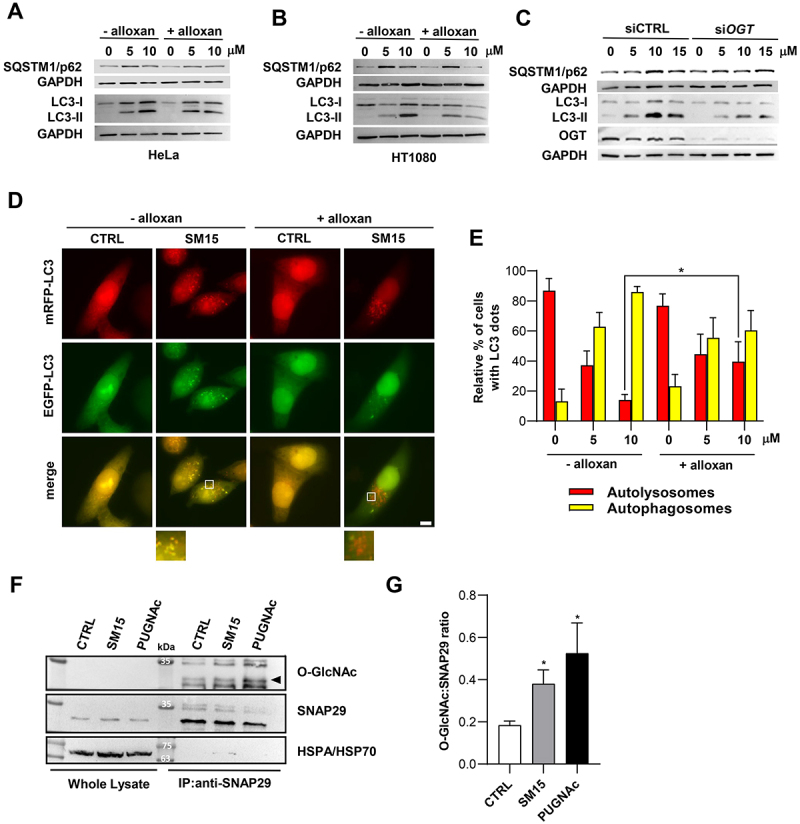
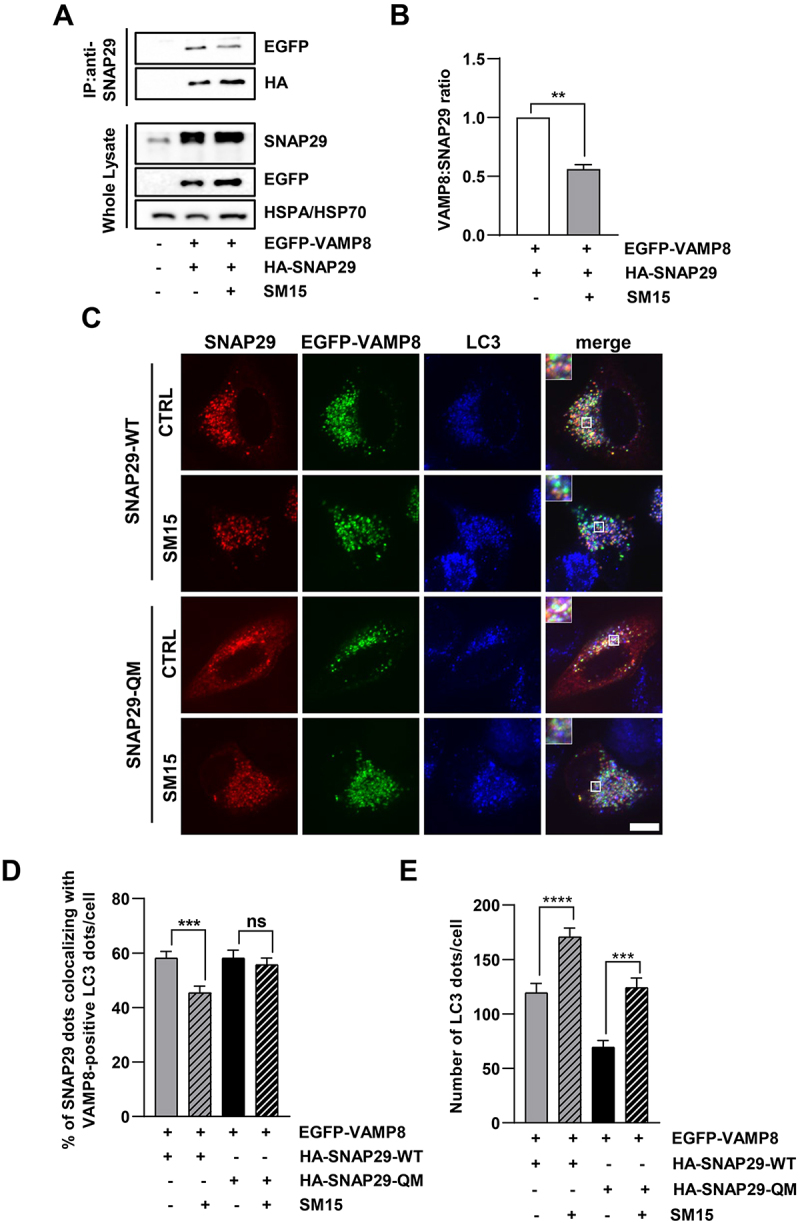
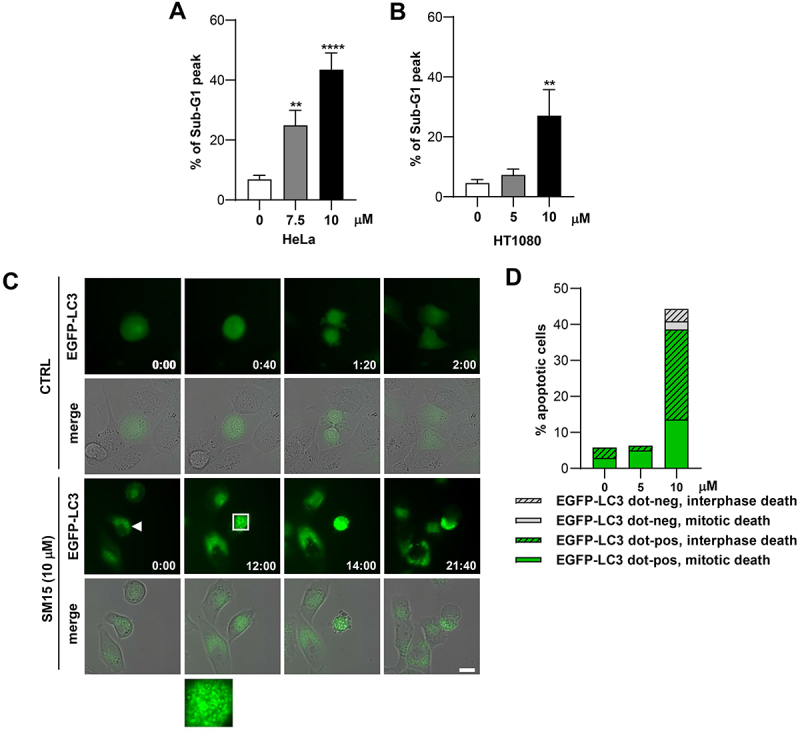
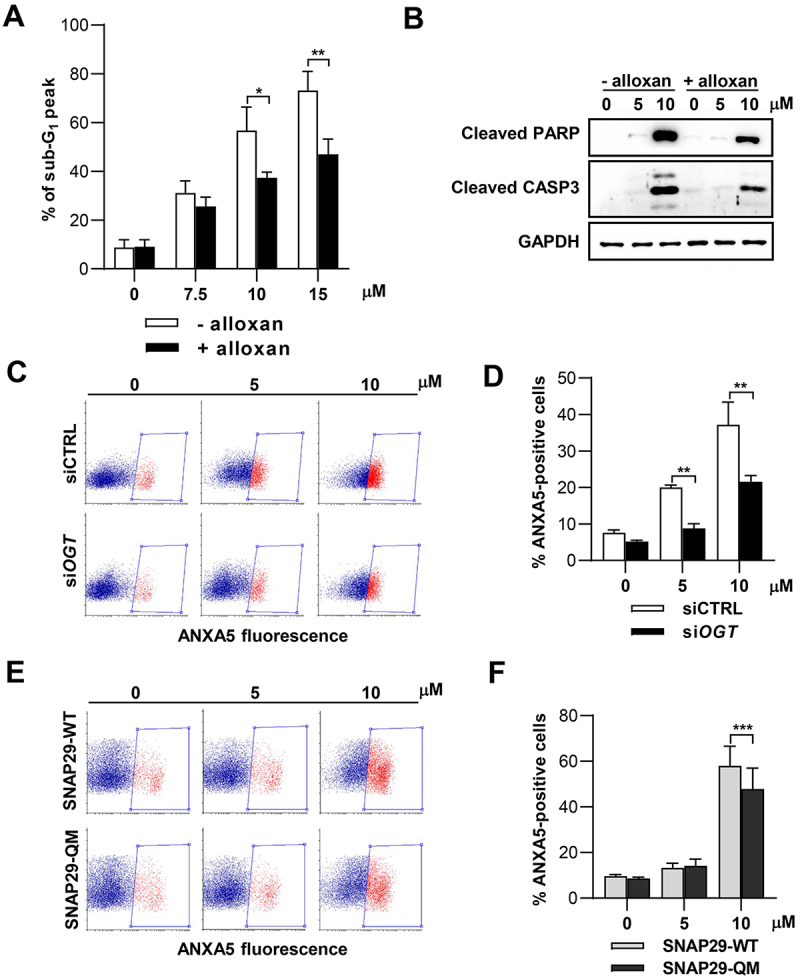
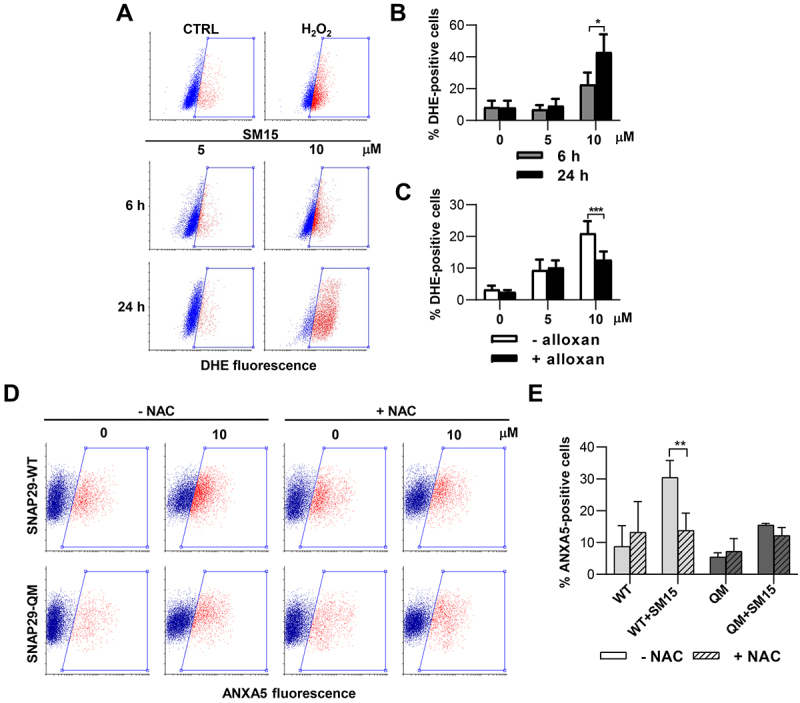
Macroautophagy/autophagy has been shown to exert a dual role in cancer i.e., promoting cell survival or cell death depending on the cellular context and the cancer stage. Therefore, development of potent autophagy modulators, with a clear mechanistic understanding of their target action, has paramount importance in both mechanistic and clinical studies. In the process of exploring the mechanism of action of a previously identified cytotoxic small molecule (SM15) designed to target microtubules and the interaction domain of microtubules and the kinetochore component NDC80/HEC1, we discovered that the molecule acts as a potent autophagy inhibitor. By using several biochemical and cell biology assays we demonstrated that SM15 blocks basal autophagic flux by inhibiting the fusion of correctly formed autophagosomes with lysosomes. SM15-induced autophagic flux blockage promoted apoptosis-mediated cell death associated with ROS production. Interestingly, autophagic flux blockage, apoptosis induction and ROS production were rescued by genetic or pharmacological inhibition of OGT (O-linked N-acetylglucosamine (GlcNAc) transferase) or by expressing an O-GlcNAcylation-defective mutant of the SNARE fusion complex component SNAP29, pointing to SNAP29 as the molecular target of SM15 in autophagy. Accordingly, SM15 was found to enhance SNAP29 O-GlcNAcylation and, thereby, inhibit the formation of the SNARE fusion complex. In conclusion, these findings identify a new pathway in autophagy connecting O-GlcNAcylated SNAP29 to autophagic flux blockage and autophagosome accumulation, that, in turn, drives ROS production and apoptotic cell death. Consequently, modulation of SNAP29 activity may represent a new opportunity for therapeutic intervention in cancer and other autophagy-associated diseases.

Keywords: Anticancer therapy; O-GlcNAcylation; SNAP29; apoptosis; autophagic flux; autophagy; kinetochore; reactive oxygen species.


Conflict of interest statement

No potential conflict of interest was reported by the author(s).

Figures

Figure 1.
Figure 1.
SM15 promotes autophagosome accumulation. (A) HT1080 cells were treated with SM15 or its inactive analog SM16 for 24 h or were exposed to 50 nM torin 1 for 2 h. Cell lysates were collected to assess LC3 conversion and SQSTM1/p62 levels by immunoblotting. (B) Representative images of EGFP-LC3 HT1080 exposed to SM15 or SM16 for 24 h and stained with DAPI. Scale bar: 10 μm. (C) Quantification of the percentage of cells showing ≥ 10 EGFP-LC3 dots in cells treated as in (B). ****P < 0.0001 (SM15 vs. SM16). (D) Quantification of the number of EGFP-LC3 dots/cell in cells treated as in (B). Data are presented as median with interquartile range. Symbols represent individual cells. ****P < 0.0001 (SM15 vs. SM16).
Figure 2.
Figure 2.
SM15 inhibits the autophagic flux. (A) HT1080 and HeLa cells were incubated with 10 μM SM15 or 25 μM CQ alone or in combination, and cell lysates were collected 24 h later to assess LC3 conversion and SQSTM1/p62 levels by immunoblotting. Numbers report the densitometric values of band intensity. (B) Quantification of the percentage of cells showing ≥ 10 EGFP-LC3 dots in EGFP-LC3 HT1080 cells treated with 5 or 10 μM SM15 for 24 h or incubated in HBSS for 6 h (STARV), alone or in combination with 25 μM CQ. *P < 0.05; **P < 0.01 (- CQ vs. + CQ). (C) Immunoblot analysis of the autophagic proteins SQSTM1/p62 and NBR1 in HT1080 and HeLa cells treated with SM15 for 24 h. Numbers report the densitometric values of band intensity. (D) Representative fluorescence images of HT1080 cells stably expressing mRFP-EGFP-LC3 treated with 5 or 10 μM SM15 for 24 h. Insets show a 3-fold enlargement of the boxed areas. Scale bar: 10 μm. (E) Quantification of the relative percentage of cells showing mRFP (red, autolysosomes) or mRFP-EGFP (yellow, autophagosomes) dots for the experiments shown in (D). *P < 0.05; ****P < 0.0001 vs. CTRL. (F) Representative fluorescence images of LAMP2 signal on EGFP-LC3 dots in EGFP-LC3 HT1080 cells immunostained for the lysosomal marker LAMP2. Cells were exposed to 50 nM torin 1 for 2 h, 25 µM CQ for 6 h or 10 µM SM15 for 24 h. Insets show a 3-fold enlargement of the boxed areas. Scale bar: 10 μm. (G) Quantification of LAMP2 and EGFP-LC3 dot colocalization in EGFP-LC3 HT1080 cells. Images were acquired by spinning disk confocal microscopy and analyzed for dot colocalization using the ComDet plugin of Fiji ImageJ. Data are presented as median with interquartile range. N ≥ 40 cells per sample from two independent experiments. Symbols represent individual cells. ****P < 0.0001 vs. CTRL. (H) Quantification of the number of EGFP-LC3 dots/cell in EGFP-LC3 HT1080 cells treated as in (F). Dots were counted using CellProfiler software. Data are presented as median with interquartile range. N ≥ 50 cells per sample. Symbols represent individual cells. ****P < 0.0001 vs. CTRL.
Figure 3.
Figure 3.
SM15 does not affect early autophagic events. (A) HeLa cells were treated with SM15 or 50 nM torin 1, cell lysates were collected 24 h later and immunoblotted with anti-phospho-MTOR (Ser2448), anti-MTOR, anti-phospho-ULK1 (Ser555), and anti-ULK1 antibodies. (B) H1299 clones stably transfected with shRNA targeting BECN1 (shBECN1#9 and shBECN1#1) or with scramble shRNA (shCTRL) were treated with SM15 and LC3 conversion was assessed by immunoblotting. (C) HeLa cells transiently transfected with an untargeted siRNA (siCTRL) or siRNA against ATG7 were treated with SM15 and LC3 conversion was assessed by immunoblotting. (D) Representative fluorescence images of SQSTM1/p62 signal on EGFP-LC3 dots in EGFP-LC3 HT1080 cells immunostained for the cargo receptor SQSTM1/p62. Cells were treated with 50 nM torin 1 for 2 h, 25 µM CQ for 6 h, or 10 µM SM15 for 24 h. Insets show a 3-fold enlargement of the boxed areas. Scale bar: 10 μm. (E) Quantification of SQSTM1/p62 and EGFP-LC3 dot colocalization in EGFP-LC3 HT1080 cells treated as in (D). Images were acquired by spinning disk confocal microscopy and analyzed for dot colocalization using the ComDet plugin of Fiji ImageJ. Data are presented as median with interquartile range. N ≥ 33 cells per sample from two independent experiments. Symbols represent individual cells. (F) Lysates from untreated, 25 µM CQ or 10 µM SM15-treated HT1080 cells were subjected to proteinase K (PK) and/or Triton X-100 (TX-100) treatment, and SQSTM1/p62 or NBR1 levels were analyzed by immunoblot. Cargo receptors in autophagosomes are protected from the addition of the external protease unless Triton X-100 is present.
Figure 4.
Figure 4.
SM15 produces large autophagosomes that accumulate RAB7. (A) Representative images of EGFP-LC3 HT1080 cells treated for 24 h with 5 µM SM15, 100 nM taxol (TAX) or after 4 h incubation in HBSS (STARV) or in 25 µM CQ. Cells were counterstained with DAPI. Insets show a 3-fold enlargement of the boxed areas. Scale bar: 10 µm. (B) Quantification of the dimension of EGFP-LC3 dots in EGFP-LC3 HT1080 cells treated as in (a). N ≥ 10 cells per sample. ****P < 0.0001 vs. CTRL. (C) Representative fluorescence images of cells immunostained for RAB7 and counterstained with DAPI. Cells were treated for 24 h with 5 µM SM15. Insets show a 3-fold enlargement of the boxed areas. Scale bar: 10 µm. (D) Quantification of RAB7 mean intensity/cell (arbitrary units) in EGFP-LC3 HT1080 cells treated for 24 h with 5 µM SM15, 100 nM TAX or after 4 h incubation in HBSS (STARV). N ≥ 20 cells per sample from two independent experiments. ****P < 0.0001 vs. CTRL.
Figure 5.
Figure 5.
SM15-induced SNAP29 O-GlcNAcylation promotes autophagic flux blockage. (A) Immunoblot analysis of LC3 conversion and SQSTM1/p62 levels in HeLa cells treated for 24 h with SM15 alone or in combination with 5 mM of the OGT inhibitor alloxan. (B) Immunoblot analysis of LC3 conversion and SQSTM1/p62 levels in HT1080 cells treated as in (A). (C) Immunoblot analysis of LC3 conversion and SQSTM1/p62 levels in HeLa cells transfected with untargeted siRNA (siCTRL) or siOGT RNA and treated with SM15 for 24 h. (D). Representative images of HeLa cells stably expressing mRFP-EGFP-LC3 treated for 24 h with SM15 alone or in combination with 5 mM alloxan. Insets show a 3-fold enlargement of boxed areas. Scale bar: 10 μm. (E) Quantification of the relative percentage of cells showing mRFP (red, autolysosomes) or mRFP-EGFP (yellow, autophagosomes) dots for the experiments shown in (D). *P < 0.05 (- alloxan vs. + alloxan). (F) Immunoprecipitation analysis of SNAP29 O-GlcNAcylation. HeLa cells were treated with 15 μM SM15 for 6 h or 10 μM PUGNAc for 24 h, SNAP29 was immunoprecipitated using an agarose conjugated anti-SNAP29 antibody and immunoprecipitates were immunoblotted with anti O-GlcNAc and anti-SNAP29 antibodies. (G) Densitometric analysis of SNAP29 O-GlcNAcylation in SNAP29 immunoprecipitates. Values represent the ratio of O-GlcNAc to SNAP29 band intensity from four independent experiments. *P < 0.05 vs. CTRL.
Figure 6.
Figure 6.
SM15 inhibits SNARE complex formation. (A) HeLa cells were transiently transfected with HA-SNAP29 and EGFP-VAMP8. 42 h after transfection cells were treated for 6 h with 15 μM SM15. SNAP29 was then immunoprecipitated using anti-SNAP29 antibody and it was revealed by immunoblotting with HA-HRP antibody. To detect VAMP8 interaction with SNAP29, EGFP-VAMP8 was revealed by anti-GFP antibody. (B) Densitometric analysis of VAMP8/SNAP29 ratio. Values represent the ratio of EGFP to HA band intensity from two independent experiments and are reported as fold change over the control value. **P < 0.01. (C) HeLa cells were transiently transfected with HA-SNAP29-WT or HA-SNAP29-QM and EGFP-VAMP8. 42 h after transfection, cells were treated for 6 h with 15 μM SM15. Samples were immunostained using SNAP29 and LC3 antibodies and images were acquired by spinning disk confocal microscopy. Insets show a 3-fold enlargement of the boxed areas. Scale bar: 10 μm. (D) Quantification of the percentage of SNAP29 dots colocalizing with VAMP8-positive LC3 dots in HA-SNAP29-WT and HA-SNAP29-QM untreated or SM15-treated HeLa cells. N ≥ 33 cells per sample from two independent experiments. Colocalization of SNAP29, VAMP8 and LC3 dots was analyzed using the ComDet plugin of Fiji ImageJ. (E) Quantification of the number of LC3 dots/cell detected by anti-LC3 antibody staining in HA-SNAP29-WT and HA-SNAP29-QM untreated or SM15-treated cells. ***P < 0.001, ****P < 0.0001.
Figure 7.
Figure 7.
SM15 induces apoptosis in cells showing autophagic vesicles. (A) Quantification of the sub-G1 peak in HeLa cells treated with SM15 for 24 h. **P < 0.01; ****P < 0.0001 vs. untreated. (B) Quantification of the sub-G1 peak in HT1080 cells treated with SM15 for 24 h. **P < 0.01 vs. untreated. (C) Still images of an untreated EGFP-LC3 HT1080 cell (CTRL) or a SM15-treated EGFP-LC3 HT1080 cell (SM15, arrowhead) recorded by time-lapse microscopy for 48 h under phase contrast and EGFP fluorescence. The merge image shows the superimposition of the phase contrast and fluorescence images. Time is given in h:min. The inset is a 5-fold enlargement of the boxed area, showing accumulation of autophagosomes over time. (D) Quantitative analysis of the different cell death fates (interphase death vs. mitotic death) in EGFP-LC3 HT1080 cells showing (EGFP-LC3 dot-pos) or lacking (EGFP-LC3 dot-neg) EGFP-LC3 dots. Values derive from the sum of the number of cells observed in two independent experiments. CTRL N = 35; 5 μM SM15 N = 80; 10 μM SM15 N = 88. Scale bar: 20 µm.
Figure 8.
Figure 8.
Pharmacological or genetic inhibition of O-GlcNAcylation reverts apoptosis. (A) Quantification of the sub-G1 peak in HeLa cells treated with SM15 for 24 h with or without 5 mM alloxan. *P < 0.05; **P < 0.01 (- alloxan vs. + alloxan). (B) Immunoblot analysis of the cleaved form of the apoptosis markers PARP and CASP3 in HeLa cells treated with SM15 for 24 h with or without alloxan. (C) Representative cytofluorimetric plots of ANXA5 fluorescence after siCTRL or siOGT RNA transfection in SM15-treated HeLa cells. Boxed areas represent ANXA5-positive cells. (D) Quantification of ANXA5-positive cells after siCTRL or siOGT RNA transfection and treatment with SM15 for 24 h. **P < 0.01 (siCTRL vs. siOGT). (E) Representative cytofluorimetric plots of ANXA5 fluorescence after SNAP29-WT or SNAP29-QM expression in SM15-treated HeLa cells. Boxed areas represent ANXA5-positive cells. (F) Quantification of ANXA5-positive cells after SNAP29-WT or SNAP29-QM expression and treatment with SM15 for 24 h. ***P < 0.001 (SNAP29-WT vs. SNAP29-QM).
Figure 9.
Figure 9.
SNAP29 O-GlcNAcylation promotes ROS-mediated cell death. (A) Representative cytofluorimetric plots of DHE fluorescence in HT1080 treated with SM15 for different incubation times or treated with the ROS producer H2O2 (5 mM) for 30 min. (B) Quantification of DHE-positive HT1080 cells treated as in (A). *P < 0.05 (6 h vs. 24 h). (C) Quantification of DHE-positive HeLa cells treated with SM15 for 24 h with or without 5 mM alloxan. ***P < 0.001 (- alloxan vs. + alloxan). (D) Representative cytofluorimetric plots of ANXA5 fluorescence in SNAP29-WT or SNAP29-QM expressing HeLa cells. Cells were treated with SM15 for the last 24 h of the expression time, NAC was added 30 min before SM15. Boxed areas represent ANXA5-positive cells. (E) Quantification of ANXA5-positive cells treated as in (D). **P < 0.01 (SNAP29-WT vs. SNAP29-QM).

Similar articles

Cited by

References

    1. Dikic I, Elazar Z.. Mechanism and medical implications of mammalian autophagy. Nat Rev Mol Cell Biol. 2018;19(6):349–364. - PubMed
    1. Levine B, Kroemer G. Biological functions of autophagy genes: a disease perspective. Cell. 2019;176(1–2):11–42. - PMC - PubMed
    1. Yang Y, Klionsky DJ. Autophagy and disease: unanswered questions. Cell Death Differ. 2020;27(3):858–871. - PMC - PubMed
    1. Dossou AS, Basu A. The emerging roles of mTORC1 in macromanaging autophagy. Cancers (Basel). 2019;11(10):1422. - PMC - PubMed
    1. Yu L, Chen Y, Tooze SA. Autophagy pathway: cellular and molecular mechanisms. Autophagy. 2018;14(2):207–215. - PMC - PubMed

Publication types