

Promoter-pervasive transcription causes RNA polymerase II pausing to boost DOG1 expression in response to salt
- PMID: 36705062
- PMCID: PMC9975946
- DOI: 10.15252/embj.2022112443
Promoter-pervasive transcription causes RNA polymerase II pausing to boost DOG1 expression in response to salt
Abstract
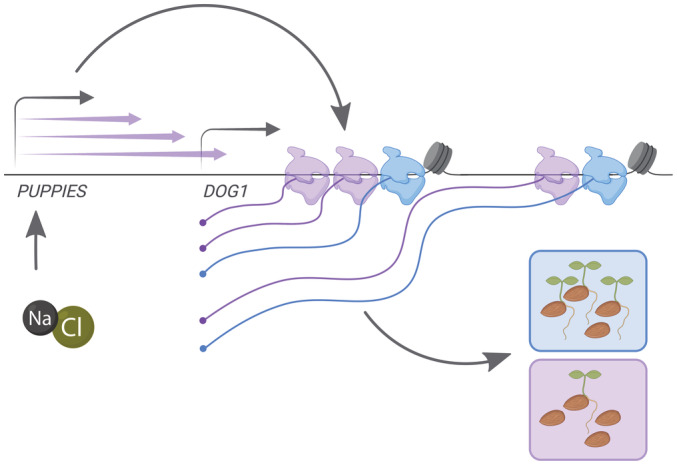
Eukaryotic genomes are pervasively transcribed by RNA polymerase II. Yet, the molecular and biological implications of such a phenomenon are still largely puzzling. Here, we describe noncoding RNA transcription upstream of the Arabidopsis thaliana DOG1 gene, which governs salt stress responses and is a key regulator of seed dormancy. We find that expression of the DOG1 gene is induced by salt stress, thereby causing a delay in seed germination. We uncover extensive transcriptional activity on the promoter of the DOG1 gene, which produces a variety of lncRNAs. These lncRNAs, named PUPPIES, are co-directionally transcribed and extend into the DOG1 coding region. We show that PUPPIES RNAs respond to salt stress and boost DOG1 expression, resulting in delayed germination. This positive role of pervasive PUPPIES transcription on DOG1 gene expression is associated with augmented pausing of RNA polymerase II, slower transcription and higher transcriptional burst size. These findings highlight the positive role of upstream co-directional transcription in controlling transcriptional dynamics of downstream genes.
Keywords: RNA polymerase II pausing; long noncoding RNAs; salt stress; transcriptional dynamics.
© 2023 The Authors. Published under the terms of the CC BY 4.0 license.
Figures
- A
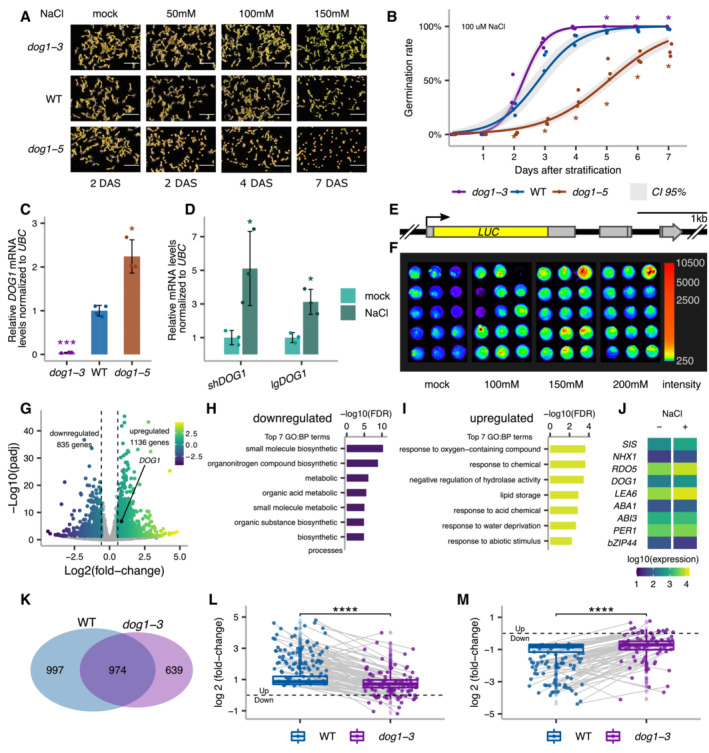
Germination of dog1‐3 (knockout), WT and dog1‐5 (DOG1 upregulation) seeds in media supplemented with NaCl for the indicated number of days after stratification (DAS). Scale bar represents 5 mm.
- B
Germination rate in 100 mM NaCl measured during 7 days after stratification for seeds of different genotypes. Lines represent the fitted curves with a 95% confidence interval (grey area). *P‐value < 0.05 from two‐tailed Student's t‐test. Data for WT are the same as plotted in Fig 3C.
- C
shDOG1 expression levels normalized to UBC21 (AT5G25760) in dog1‐3 and dog1‐5 relative to WT.
- D
shDOG1 and lgDOG1 expression levels normalized to UBC21 in seeds treated with 100 mM NaCl relative to mock.
- E
Schematics of the pDOG1‐LUC::DOG1 construct with LUC reporter inserted after DOG1 ATG, including complete intergenic regions upstream and downstream of the DOG1 gene (Fedak et al, 2016).
- F
Luciferase reporter activity in seeds in different concentrations of NaCl or mock. The colour bar shows the luminescence in counts per second on a logarithmic scale.
- G
Volcano plot shows DEGs as coloured points (DESeq2; |log2fold‐change| > log2(1.5), FDR < 0.05). The colour scale shows log2fold‐change. DOG1 gene is highlighted in black. The number of downregulated and upregulated genes is provided on the plot.
- H, I
Top 7 nonredundant Gene Ontology terms for biological process (GO:BP) for down‐ (H) and upregulated genes (I).
- J
Mean absolute expression levels from 3'RNA‐seq of selected genes known to be involved in salt stress response and/or seed germination. Data from mock (−) and 100 mM NaCl (+).
- K
Venn diagram shows the overlap between genes affected by salt treatment in WT and dog1‐3 (DESeq2; |log2fold‐change| > log2(1.5), FDR < 0.05).
- L, M
Box plots represent the behaviour of genes upregulated (L) and downregulated (M) by salt in WT. Points show genes for which expression is more than two times higher or lower in dog1‐3 compared with WT. Grey lines connect the same genes. The box plot's central band marks the median, boxes mark the first and third quartiles, and whiskers extend the boxes to the largest value no further than 1.5 times the interquartile range. For the comparison of transcriptomic responses, the Wilcoxon rank‐sum test was applied using each gene (DEG in WT) as a biological replicate. Sample size n = 1,136 for both WT and dog1‐3 (L) and n = 835 for both WT and dog1‐3 (M) ****P‐value < 0.0001.
- A
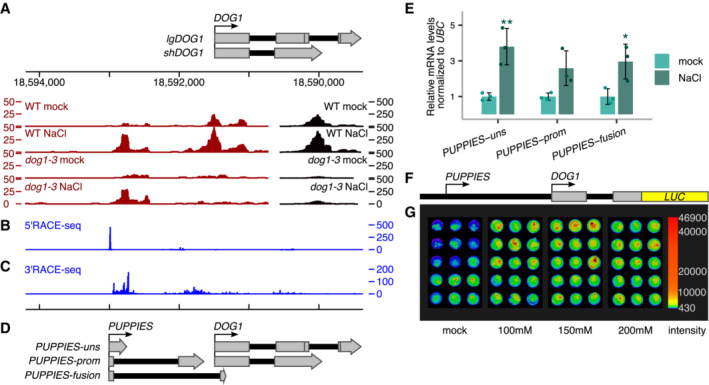
3'RNA‐seq read coverage on DOG1 locus. Black colour is used for coverage within the scale on the right‐hand side (0–500), and red is used for coverage within the scale on the left‐hand side (0–50). Above is a schematic representation of the annotated transcripts from the DOG1 locus and the chromosome coordinates.
- B
5'RACE‐seq from a primer within the DOG1 promoter reveals a transcription start site (TSS) upstream of the DOG1 gene.
- C
3'RACE‐seq results show novel transcription termination sites (TTS) along the DOG1 promoter and gene body.
- D
Schematics of newly annotated PUPPIES isoforms, co‐directionally transcribed upstream of DOG1.
- E
RT–qPCR with primers specific for PUPPIES‐uns, PUPPIES‐prom, and PUPPIES‐fusion isoforms. Expression levels normalized to UBC21 for 100 mM NaCl‐treated seeds and relative to mock. Bars and error bars represent the mean ± SD. Points represent biological replicates. *P‐value < 0.05, **P‐value < 0.01 from two‐tailed Student's t‐test.
- F
Schematics of psDOG1::LUC construct with Luciferase reporter sequence inserted at the end of DOG1 exon 2 (Fedak et al, 2016).
- G
Luciferase activity in seeds in different concentrations of NaCl or mock. The colour bar shows the luminescence in counts per second on a logarithmic scale.
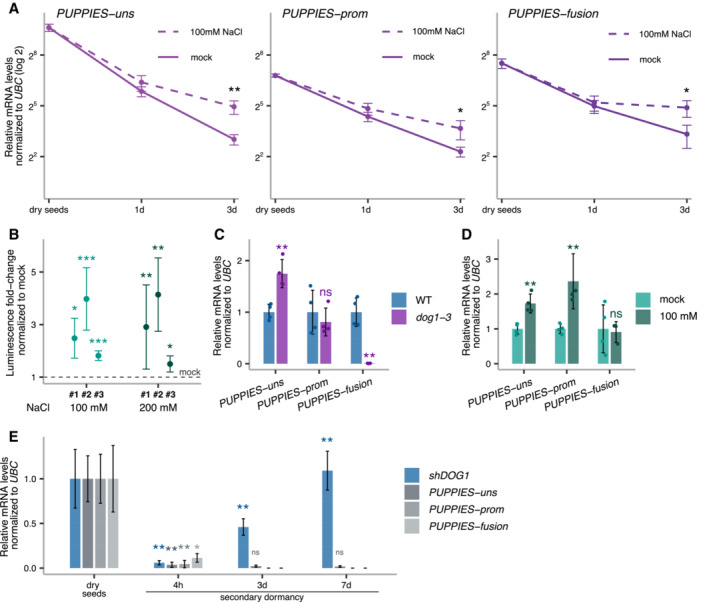
Relative quantification of PUPPIES‐uns, PUPPIES‐prom and PUPPIES‐fusion (from left to right) normalized to UBC21 in dry seeds and seeds imbibed for 1 and 3 days in mock versus 100 mM NaCl. RT–qPCR points and error bars represent the mean ± SD. *P‐value < 0.05, **P‐value < 0.01 from two‐tailed Student's t‐test.
Luciferase reporter assay. Plots represent the luminescence fold‐change of seeds under 100 or 200 mM NaCl normalized to mock (horizontal dashed line) for three independent transgenic lines (#1, #2, #3) carrying the reporter construct psDOG1::LUC. Error bars represent the mean ± SD. *P‐value < 0.05, **P‐value < 0.01, ***P‐value < 0.001 from paired Student's t‐test comparing the raw luminescence levels in counts per second between mock and NaCl‐treated samples.
RT–qPCR for PUPPIES‐uns, PUPPIES‐prom and PUPPIES‐fusion. Expression in seeds treated with 100 mM NaCl in dog1‐3 relative to WT.
Expression in dog1‐3 mutant seeds treated with 100 mM NaCl relative to mock.
RT–qPCR for shDOG1, PUPPIES‐uns, PUPPIES‐prom and PUPPIES‐fusion during heat stress induction of secondary dormancy of WT seeds. Bars and error bars represent the mean ± SD with n = 3. Expression levels normalized to UBC21. Expression levels of PUPPIES‐prom and PUPPIES‐fusion at 3 and 7 days were undetectable. Asterisks show the statistical significance for each transcript from the two‐tailed Student's t‐test for the comparison of each timepoint to its previous timepoint. ns P‐value > 0.05, *P‐value < 0.05, **P‐value < 0.01.
- A
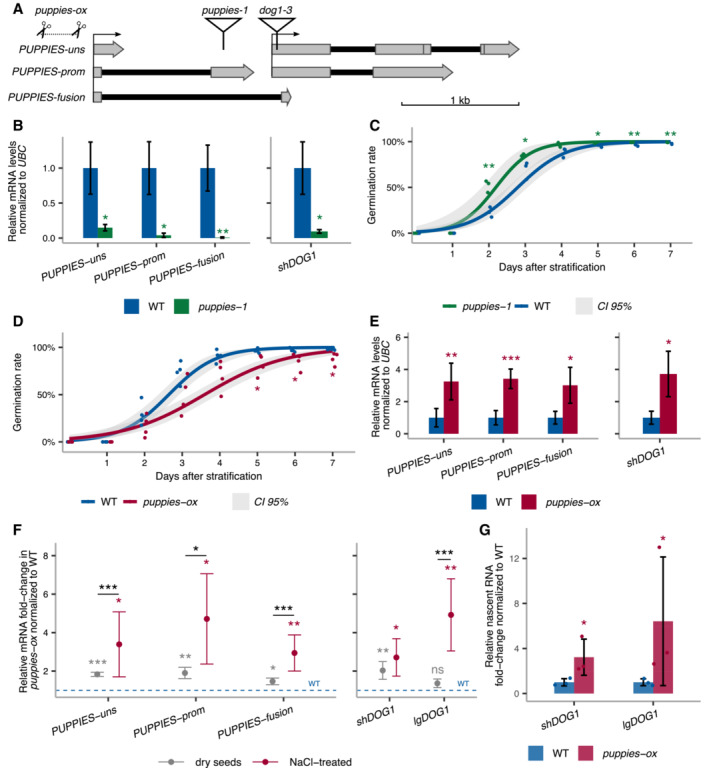
Schematics of DOG1 locus with PUPPIES and DOG1 TSS indicated by black arrows. The T‐DNA insertions in puppies‐1 and dog1‐3 mutants, and CRISPR‐Cas9 deletion in puppies‐ox are shown.
- B
RT–qPCR with primers specific for PUPPIES‐uns, PUPPIES‐prom, PUPPIES‐fusion and shDOG1. Expression levels normalized to UBC21 in seeds treated with 100 mM NaCl in the puppies‐1 mutant relative to WT.
- C, D
Germination time‐course in 100 mM NaCl after stratification for puppies‐1 (C) and puppies‐ox (D) relative to WT. Lines represent fitted curves with a 95% confidence interval (grey area), dots represent data points, *P‐value < 0.05 from the two‐tailed Student's t‐test. (C) Data for WT are the same as plotted in Fig 1B.
- E
RT–qPCR (same as in B) in puppies‐ox relative to WT.
- F
RT–qPCR fold‐change induction of PUPPIES‐uns, PUPPIES‐prom, PUPPIES‐fusion, shDOG1 and lgDOG1 in puppies‐ox relative to WT (blue dashed line), in dry (light grey) and imbibed seeds in the presence of 100 mM NaCl (red). Significance from the two‐tailed Student's t‐test for comparing dry seeds of WT and puppies‐ox is represented with light grey asterisks, and salt‐imbibed seeds of WT and puppies‐ox are represented with red asterisks. Black asterisks represent significance from two‐way ANOVA with Tukey's multiple comparisons test for dry seeds versus imbibed seeds. ns P‐value > 0.05, *P‐value < 0.05, **P‐value < 0.01, ***P‐value < 0.001. Error bars represent the mean ± SD. n = 4 biological replicates.
- G
RT–qPCR with primers for shDOG1 and lgDOG1 on nascent RNA from seeds imbibed in 100 mM NaCl from puppies‐ox relative to WT. Nascent RNA levels were normalized to UBC21. Bars and error bars represent the mean ± SD. Points represent biological replicates. Statistical significance from two‐tailed Student's t‐test. *P‐value < 0.05.
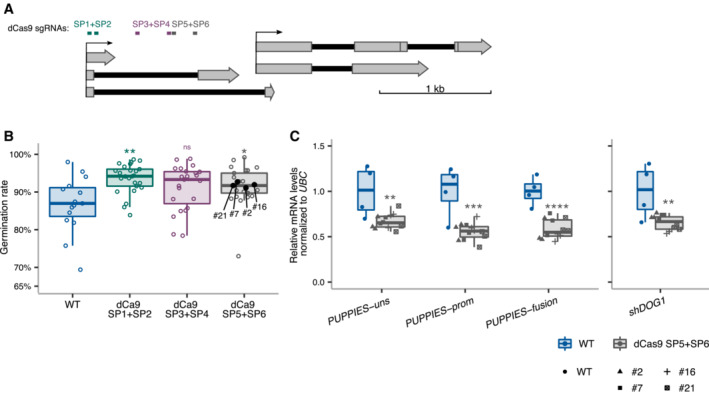
Schematics of DOG1 locus with PUPPIES and DOG1 TSS indicated by black arrows. Two sgRNAs per construct were introduced in WT targeting a ubiquitously expressed “dead” Cas9 protein (dCas9) to block PUPPIES transcription. The sgRNA positions are: SP1 + SP2 (in green), SP3 + SP4 (in purple), SP5 + SP6 (in grey).
Box plots showing the percentage of germination in 150 mM NaCl at 4 days after stratification for WT (blue) and T2 seeds from selected transformants carrying dCas9 and the sgRNA pairs SP1 + SP2 (green), SP3 + SP4 (purple), SP5 + SP6 (grey). Points show the germination of seeds from each individual transgenic plant. Four independent SP5 + SP6 plants (#2, #7, #16, #21, represented by black points) with germination closest to the median were propagated and gene expression analyses (C) were carried out in the T3 seeds imbibed in the presence of 100 mM NaCl. Points represent biological replicates.
Box plots show the expression levels measured by RT–qPCR of PUPPIES‐uns, PUPPIES‐prom, PUPPIES‐fusion and shDOG1 normalized to UBC21 in the four different transgenic lines of SP5 + SP6 dCas9 (grey) relative to WT (blue). Points represent biological replicates.
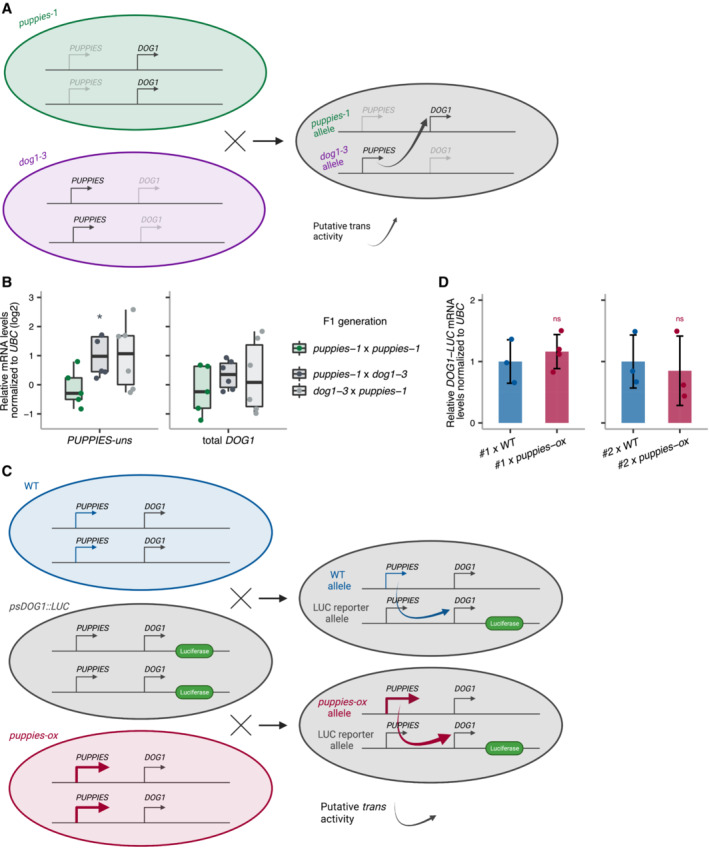
Schematic representation of the cross between both diploid homozygous puppies‐1 and dog1‐3 mutants. The heterozygous F1 is used to test if supplying PUPPIES expression (from the dog1‐3 allele) induces DOG1 expression (from the puppies‐1 allele) compared with the homozygous puppies‐1.
RT–qPCR for PUPPIES‐uns and total DOG1 normalized to UBC21 in F1 seeds imbibed in the presence of 100 mM NaCl. y‐axis in logarithmic scale. Points represent biological replicates. The box plot's central band marks the median, boxes mark the first and third quartiles, and whiskers extend the boxes to the largest value no further than 1.5 times the interquartile range. Statistical significance from two‐tailed Student's t‐test. *P‐value < 0.05.
Schematic representation of the crosses between psDOG1::LUC and either WT or puppies‐ox. The heterozygous F1 from psDOG1::LUC crossed with puppies‐ox is used to test if supplying PUPPIES expression (from the puppies‐ox allele) induces DOG1‐LUC expression (from the reporter allele) relative to the levels of DOG1‐LUC in the psDOG1::LUC crossed with WT.
RT–qPCR with primers specific for DOG1‐LUC in F1 seeds of two independent psDOG1::LUC lines (#1 and #2) crossed with either WT or puppies‐ox imbibed in the presence of 100 mM NaCl. Expression was normalized to UBC21. Bars and error bars represent the mean ± SD. Points represent biological replicates. ns P‐value > 0.05 from two‐tailed Student's t‐test.
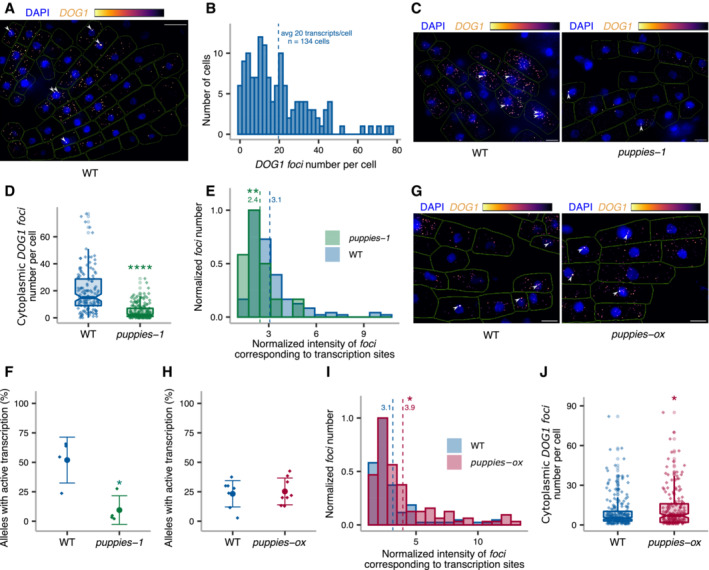
z‐stack max‐projection image of smFISH for DOG1 RNA. The “Inferno” colour scale is used for the intensity of fluorescence from Quasar670 fluorophore (DOG1). The blue colour shows fluorescence from DAPI (nuclei staining). Arrowheads point to foci corresponding to transcription sites (TS). The scale bar is 20 μm.
Distribution of cytoplasmic DOG1 foci per cell in WT. The blue vertical dashed line indicates the average.
z‐stack max‐projection images of DOG1 smFISH in seeds imbibed in 100 mM NaCl of WT (left) versus puppies‐1 (right). Arrowheads point to foci corresponding to TS. The scale bar is 5 μm.
Notched box plots showing the cytoplasmic DOG1 foci number per cell in WT and puppies‐1. Diamond‐shaped points represent each cell, n = 134 cells from WT and n = 182 cells from puppies‐1.
Distribution of intensities of foci corresponding to DOG1 transcription sites in WT and puppies‐1. In the x‐axis is the fluorescence intensity fold‐change of foci classified as TS to the average intensity of nuclear foci. In the y‐axis is the number of foci normalized to their maximum value. Vertical dashed lines indicate the average fluorescence fold‐change for WT (3.1) and puppies‐1 (2.4). n = 135 foci from WT, n = 29 foci from puppies‐1.
Plot showing the frequency of alleles with detected foci corresponding to DOG1 TS for WT and puppies‐1. Points and error bars represent the mean ± SD. Diamond‐shaped points represent single embryos.
z‐stack max‐projection images from seeds imbibed in 100 mM NaCl of WT (left) versus puppies‐ox (right). Arrowheads point to foci corresponding to TS. The scale bar is 5 μm.
Same as (F), for WT and puppies‐ox.
Same as in (E), in WT and puppies‐ox. Vertical dashed lines indicate the average fluorescence fold‐change for WT (3.1) and puppies‐ox (3.9). n = 107 foci from WT and n = 105 foci from puppies‐ox.
Notched box plot, same as (D), in WT and puppies‐ox. n = 212 cells from WT, n = 179 cells from puppies‐ox.
- A
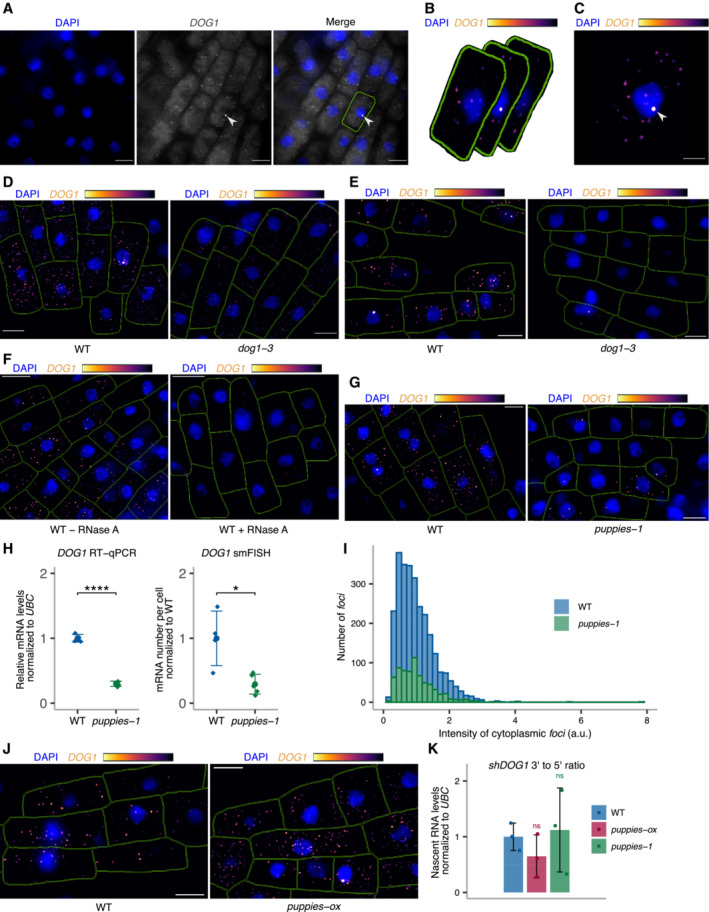
Single z‐section image of smFISH for DOG1 in embryo cells from imbibed seeds. Separate DAPI (blue) and DOG1 (grey) channels are shown on the left and middle images. A merged image is shown on the right. Manual segmentation (green outline) of the cells is performed based on a certain level of background fluorescence visible on the DOG1 channel. Arrowhead points to the focus corresponding to the transcription site (TS). For each cell, the segmented area is projected to the z‐sections above and below corresponding, respectively, to the top and bottom edges of the cell. Scale bar is 5 μm.
- B
After the projection of the cell segmentation across the z‐stack, the image is denoised in each z‐section. A maximum projection of the denoised z‐stack is then performed to obtain a representative 2D image (C). The denoised z‐stack is also used for the reconstruction of the cell and foci detection in 3D (see Materials and Methods section).
- C
Arrowhead points to the focus corresponding to the TS. Scale bar is 2 μm.
- D, E
z‐stack max‐projection images of DOG1 smFISH in seeds imbibed in 100 mM NaCl of WT (left) versus dog1‐3 (right). The scale bar is 5 μm. Please note that WT picture in panel E is the same representative picture as used in Fig 4G.
- F
z‐stack max‐projection images of DOG1 smFISH in WT without (left) versus with (right) RNase A treatment before hybridization. The scale bar is 5 μm.
- G
z‐stack max‐projection images of DOG1 smFISH in seeds imbibed in 100 mM NaCl of WT (left) versus puppies‐1 (right). The scale bar is 5 μm.
- H
Comparison of fold‐change of DOG1 expression from RT–qPCR (left) with cytoplasmic DOG1 foci number per cell from smFISH (right; replotted data shown in Fig 4E) in puppies‐1 relative to WT. Points and error bars represent the mean ± SD. Diamond‐shaped points in the RT–qPCR plot represent a pool of seeds collected from five plants, and diamond‐shaped points in the smFISH plot represent a single embryo. Statistical significance from two‐tailed Student's t‐test. *P‐value < 0.05, ****P‐value < 0.0001.
- I
Distribution of intensities of cytoplasmic DOG1 foci in WT and puppies‐1 in arbitrary units (a.u.).
- J
z‐stack max‐projection images of DOG1 smFISH in seeds imbibed in 100 mM NaCl of WT (left) versus puppies‐ox (right). The scale bar is 5 μm.
- K
RT–qPCR quantification of 3′ end and 5' end of shDOG1 on nascent RNA from seeds imbibed in 100 mM NaCl from WT, puppies‐ox and puppies‐1. The plot shows the ratio of 3′ end to 5′ end relative to WT. Nascent RNA levels were normalized to UBC21. Bars and error bars represent the mean ± SD. Statistical significance from two‐tailed Student's t‐test. ns P‐value > 0.05.
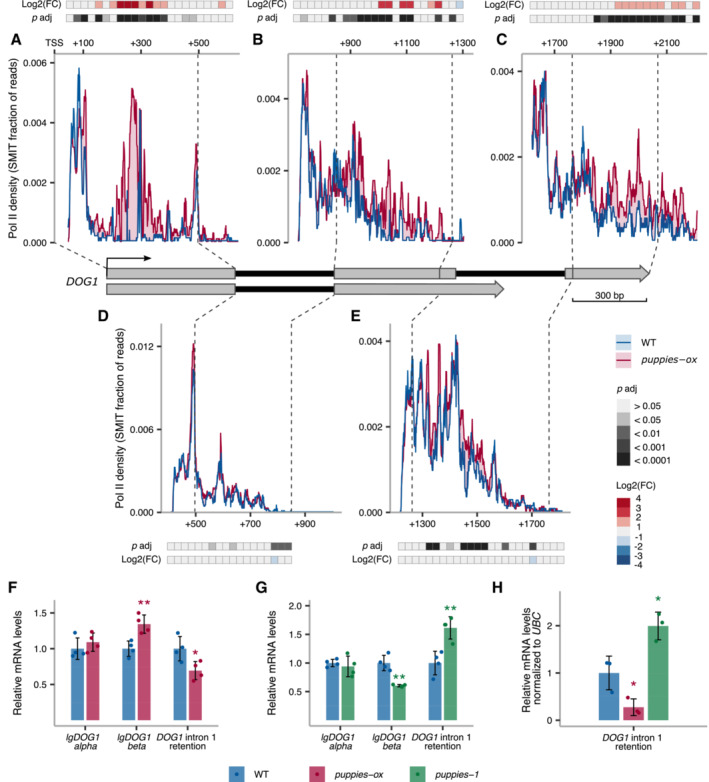
- A–E
The profile of Pol II during DOG1 transcription. Plots show the fraction of unique reads from targeted NET‐Seq using rolling median (11 nt). Targeted libraries for sequencing of DOG1 locus were obtained by usage of five primers across the gene. Pol II dynamics are analysed separately for each region sequenced in exon 1 (A), exon 2 (B), exon 3 (C), intron 1 (D) and intron 2 (E). The x‐axis shows the distance in bp from DOG1. A light red colour fill highlights the regions where Pol II density is higher in puppies‐ox. A light blue colour fill highlights the regions where Pol II density is higher in WT. For each plot, coloured tiles represent the fold‐change (puppies‐ox/WT) on a logarithmic scale. Greyscale tiles represent the result of a statistical test for the difference between genotypes from the two‐tailed Student's t‐test after Bonferroni correction. Tiles correspond to a 25 bp bin each. Vertical dashed lines connect the exon boundaries on the plots with the schematics of the DOG1 gene with grey boxes representing exons and black lines representing introns.
- F, G
RT–qPCR measurement of alternative splicing of lgDOG1 alpha and beta isoforms and unspliced intron 1 DOG1 isoforms levels in puppies‐ox, and puppies‐1 relative to WT, in seeds treated with 100 mM NaCl.
- H
RT–qPCR quantification of DOG1 intron 1 retention on nascent RNA from seeds imbibed in 100 mM NaCl from puppies‐ox and puppies‐1 relative to WT. Nascent RNA levels were normalized to UBC21.
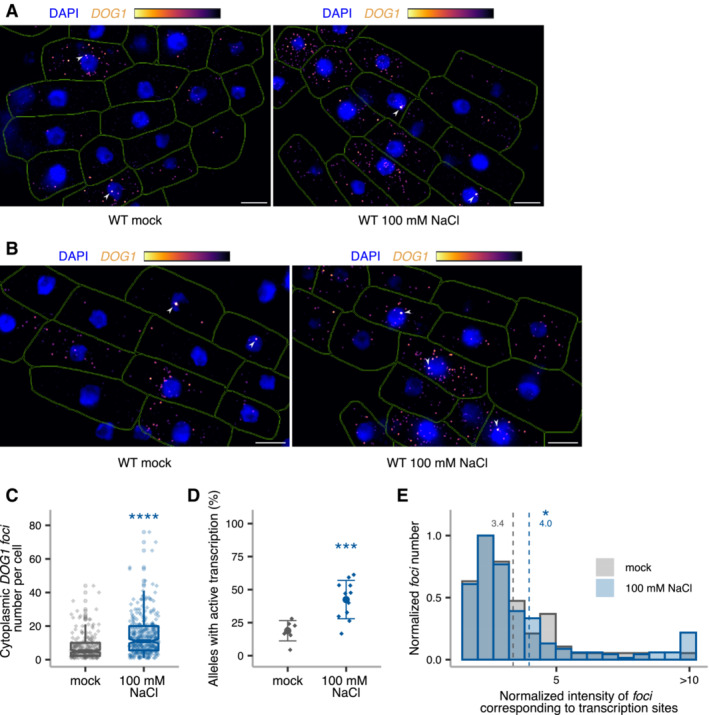
- A, B
z‐stack max‐projection images of DOG1 smFISH in WT embryos from imbibed seeds in mock (left) versus 100 mM NaCl (right). Arrowheads point to foci corresponding to the transcription sites (TS). The scale bar is 5 μm.
- C
Notched box plots showing the cytoplasmic DOG1 foci number per cell in mock versus salt treatment. Diamond‐shaped points represent each cell, n = 208 cells from mock and n = 309 cells from NaCl‐treated. The box plot's central band marks the median, lower and upper box limits mark the first and third quartiles, whiskers extend the boxes to the largest value no further than 1.5 times the interquartile range, and the notches extend to 1.58 times the interquartile range divided by sqrt (n).
- D
Plot showing the frequency of alleles with detected foci corresponding to DOG1 transcription sites for mock versus NaCl‐treated. Points and error bars represent the mean ± SD. Diamond‐shaped points represent single embryos.
- E
Distribution of intensities of foci corresponding to DOG1 TS in mock and NaCl‐treated. In the x‐axis is the fluorescence intensity fold‐change of foci classified as TS to the average intensity of nuclear foci. In the y‐axis is the number of foci normalized to their maximum value. Vertical dashed lines indicate the average fluorescence fold‐change for mock in green (3.4) and NaCl‐treated in blue (4.0). n = 47 foci from mock and n = 159 foci from NaCl‐treated.
Similar articles
-
The Arabidopsis DELAY OF GERMINATION 1 gene affects ABSCISIC ACID INSENSITIVE 5 (ABI5) expression and genetically interacts with ABI3 during Arabidopsis seed development.Plant J. 2016 Feb;85(4):451-65. doi: 10.1111/tpj.13118. Epub 2016 Feb 5. Plant J. 2016. PMID: 26729600
-
HSI2/VAL1 and HSL1/VAL2 function redundantly to repress DOG1 expression in Arabidopsis seeds and seedlings.New Phytol. 2020 Aug;227(3):840-856. doi: 10.1111/nph.16559. Epub 2020 Apr 25. New Phytol. 2020. PMID: 32201955 Free PMC article.
-
A transcription factor WRKY36 interacts with AFP2 to break primary seed dormancy by progressively silencing DOG1 in Arabidopsis.New Phytol. 2023 Apr;238(2):688-704. doi: 10.1111/nph.18750. Epub 2023 Feb 23. New Phytol. 2023. PMID: 36653950
-
Long Noncoding RNAs in Plants.Adv Exp Med Biol. 2017;1008:133-154. doi: 10.1007/978-981-10-5203-3_5. Adv Exp Med Biol. 2017. PMID: 28815539 Free PMC article. Review.
-
Delay of Germination-1 (DOG1): A Key to Understanding Seed Dormancy.Plants (Basel). 2020 Apr 9;9(4):480. doi: 10.3390/plants9040480. Plants (Basel). 2020. PMID: 32283717 Free PMC article. Review.
Cited by
-
Insights into the Epigenetic Basis of Plant Salt Tolerance.Int J Mol Sci. 2024 Oct 31;25(21):11698. doi: 10.3390/ijms252111698. Int J Mol Sci. 2024. PMID: 39519250 Free PMC article. Review.
-
Genome-Wide Identification of the DOG1 Gene Family in Pepper (Capsicum annuum) and Its Expression Profiles During Seed Germination.Plants (Basel). 2025 Jun 22;14(13):1913. doi: 10.3390/plants14131913. Plants (Basel). 2025. PMID: 40647924 Free PMC article.
-
Plant long noncoding RNAs: why do we not know more?Biol Res. 2025 Jun 10;58(1):37. doi: 10.1186/s40659-025-00610-9. Biol Res. 2025. PMID: 40490838 Free PMC article. Review.
-
The BRAHMA-associated SWI/SNF chromatin remodeling complex controls Arabidopsis seed quality and physiology.Plant Physiol. 2024 Dec 24;197(1):kiae642. doi: 10.1093/plphys/kiae642. Plant Physiol. 2024. PMID: 39661382 Free PMC article.
-
Chromatin retained MUSHER lncRNA integrates ABA and DOG1 signalling pathways to enhance Arabidopsis seeds dormancy.Nat Commun. 2025 Aug 14;16(1):7545. doi: 10.1038/s41467-025-62991-5. Nat Commun. 2025. PMID: 40813580 Free PMC article.
References
-
- Abel GH, MacKenzie AJ (1964) Salt tolerance of soybean varieties (Glycine max L. Merrill) during germination and later growth. Crop Sci 4: 157–161
-
- Apse MP, Aharon GS, Snedden WA, Blumwald E (1999) Salt tolerance conferred by overexpression of a vacuolar Na+/H+ Antiport in Arabidopsis . Science 285: 1256–1258 - PubMed
-
- Ariel F, Jegu T, Latrasse D, Romero‐Barrios N, Christ A, Benhamed M, Crespi M (2014) Noncoding transcription by alternative RNA polymerases dynamically regulates an auxin‐driven chromatin loop. Mol Cell 55: 383–396 - PubMed
Publication types
MeSH terms
Substances
Associated data
- Actions
- Actions
- Actions
LinkOut - more resources
Full Text Sources
Molecular Biology Databases
Research Materials
