. 2023 May;21(5):1044-1057.
doi: 10.1111/pbi.14017. Epub 2023 Feb 28.

Natural variation in Tiller Number 1 affects its interaction with TIF1 to regulate tillering in rice

Affiliations

Natural variation in Tiller Number 1 affects its interaction with TIF1 to regulate tillering in rice

Quan Zhang et al. Plant Biotechnol J. 2023 May.

Abstract

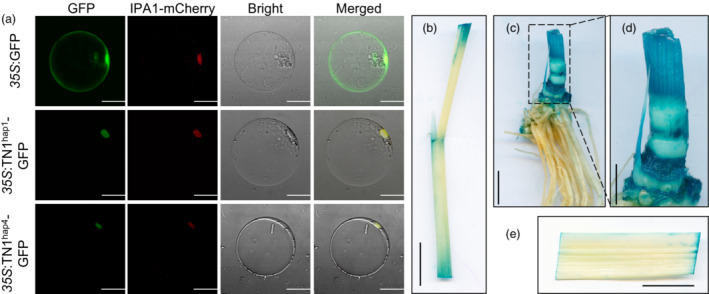
Tiller number per plant-a cardinal component of ideal plant architecture-affects grain yield potential. Thus, alleles positively affecting tillering must be mined to promote genetic improvement. Here, we report a Tiller Number 1 (TN1) protein harbouring a bromo-adjacent homology domain and RNA recognition motifs, identified through genome-wide association study of tiller numbers. Natural variation in TN1 affects its interaction with TIF1 (TN1 interaction factor 1) to affect DWARF14 expression and negatively regulate tiller number in rice. Further analysis of variations in TN1 among indica genotypes according to geographical distribution revealed that low-tillering varieties with TN1-hapL are concentrated in Southeast Asia and East Asia, whereas high-tillering varieties with TN1-hapH are concentrated in South Asia. Taken together, these results indicate that TN1 is a tillering regulatory factor whose alleles present apparent preferential utilization across geographical regions. Our findings advance the molecular understanding of tiller development.

Keywords: BAH domain; GWAS; geographical distribution; rice; tiller number.


Conflict of interest statement

The authors declare that they have no competing interests.

Figures

Figure 1
Figure 1
GWAS of tiller number to identify TN1. (a) Manhattan plot of GWAS results. Red dots represent QTLs. (b) Regional Manhattan plot of qTN2 and pairwise LD analysis. Significant SNPs (−log10(P) ≥ 4) are presented as red dots. Green and red boxes indicate annotated genes, triangles denote QTLs, and dots represent SNPs. (c) TN1‐based association mapping. Red dots indicate SNPs (−log10(P) ≥ 4) in the 2000 bp promoter and 7467 bp genomic sequence. (d) Haplotypes (hap) of TN1 among 279 accessions; major and minor alleles are indicated in yellow and green respectively. Data are presented as mean ± SE. Different letters indicate significant differences at P < 0.05 according to two‐tailed Student's t‐test.
Figure 2
Figure 2
Phenotypic characterization of TN1‐transgenic plants. (a) Sequences of CRISPR‐knockout lines. (b) Phenotypes of NIP and tn1‐1 lines at the reproductive stage. Scale bar = 20 cm. (c) Phenotypes of NIP and tn1‐2 and tn1‐3 lines at the reproductive stage. Scale bar = 20 cm. (d) Tiller number per plant of NIP and tn1‐1 lines. (e) Tiller number per plant of NIP and tn1‐2 and tn1‐3 lines. (f) Phenotype of NIP and TN1‐OE lines at the reproductive stage. Scale bar = 20 cm. (g) Expression level of TN1 in NIP versus TN1‐OE lines. Data are presented as mean ± SD. (n = 3 biologically independent samples). (h) Tiller number per plant of NIP and TN1‐OE lines. (i) Seed setting rate of NIP, tn1‐1, tn1‐2, tn1‐3, and TN1‐OE lines. (j) Heading date of NIP, tn1‐1, tn1‐2, tn1‐3, and TN1‐OE lines. In (d–j), P‐values were determined using two‐tailed Student's t‐tests. **P < 0.01. Data are presented as mean ± SD (n = 15).
Figure 3
Figure 3
Expression pattern of TN1. (a) Subcellular localization of TN1‐GFP fusion protein in rice protoplasts of different haplotypes. Scale bar = 20 μm. (b, c, e) GUS staining of tissues (leaf sheath, tiller, and leaf respectively) in ProTN1:GUS‐transgenic plants at 30 days after transplanting. Scale bar = 2 cm. (d) Enlarged version of dashed box in (c). Scale bar = 1 cm.
Figure 4
Figure 4
TN1 interacts with TIF1. (a) Phylogenetic analysis of the TN1 protein in 14 species. Monocots and dicots are indicated in orange and green respectively. (b) TN1 recognizes the H3K27me3 peptide in pull‐down assay. (c) Yeast two‐hybrid assay showing interactions of different genotypes of TN1 with TIF1. (d) Luciferase complementation image (LCI) assay in Nicotiana Benthamian leaves. The fluorescence intensity of TN1hap1 and TIF1 was set as 1, and the assay was repeated eight times. (e) Bimolecular fluorescence complementation (BiFC) assay in rice protoplasts. Scale bar = 10 μm. (f) TN1 directly interacts with TIF1 in Co‐IP assay. Black arrow indicates TIF1‐Myc.
Figure 5
Figure 5
TIF1 negatively regulates tiller number in rice. (a) Expression levels of TN1 in tillering tissues. Data are presented as mean ± SD (n = 3 independent biological samples). DT30_Ab, DT45_Ab, DT60_Ab, ST_1, ST_2, and ST_3 represent developmental stages described in Materials and Methods. (b) Mutation targets of tif1‐1 and tif1‐2. (c) Phenotypes of NIP and tif1‐CRISPR lines at the reproductive stage. Scale bar = 20 cm. (d) Tiller number per plant of NIP and tif1‐CRISPR lines. P‐values were determined using two‐tailed Student's t‐tests. **P < 0.01. Data are presented as mean ± SD (n = 15).
Figure 6
Figure 6
Both TN1 and TIF1 regulate D14 expression. (a) Volcano map of differentially expressed genes between NIP and tn1‐1. (b) Heat map showing the expression of tillering‐related genes in NIP and tn1‐1. (c) Relative expression levels of D14, OsCCA1, and D3 in NIP, tn1‐1, TN1‐OE, and tif1 lines. (d) Phenotypes of tn1‐1 and D14‐OE/tn1‐1 lines at the reproductive stage. Scale bar = 10 cm. (e, f) D14 expression and tiller number in tn1‐1 and D14‐OE/tn1‐1 lines at the reproductive stage. (g) Model of TN1 and TIF1 functioning synergistically to regulate tiller number by affecting D14 transcripts. Red dotted lines indicate transcript abundance. Dotted circles indicate dysfunctionality. Solid circles indicate full function. Broken circles indicate loss of function. Red crosses indicated inhibition. Data in (c) and (e) are presented as mean ± SD of three biologically independent samples.
Figure 7
Figure 7
Phylogenetic origins and utilization of TN1 in breeding. (a) Phylogenetic analysis of TN1 in a natural rice population. Colour of the outer circle refers to eight ecological groups, including Or‐I, Or‐II, Or‐III, Ind (XI‐1A, XI‐1B, XI‐2, and XI‐3), temperate japonica (GJ‐tmp), tropical japonica (GJ‐trp), Aus, and aromatic (Aro). Inner solid colours indicate the two haplotypes: TN1‐hapH and TN1‐hapL. (b) Haplotype analysis of the functional SNPs of TN1. Colours correspond to the inner branch in (a). (c) Frequencies of TN1‐hapH and TN1‐hapL in ecotypes XI‐1A, XI‐2, and XI‐3. (d‐e) Phenotypes of NIL‐TN1 93‐11 and NIL‐TN1 CH1230 at the reproductive stage. (f) Frequency of alleles in improved varieties (IMP) and landraces (LAN). (g) Combined haplotype analysis of TN1TIF1 in the indica subpopulation.

References

    1. Arite, T. , Iwata, H. , Ohshima, K. , Maekawa, M. , Nakajima, M. , Kojima, M. , Sakakibara, H. et al. (2007) DWARF10, an RMS1/MAX4/DAD1 ortholog, controls lateral bud outgrowth in rice. Plant J. 51, 1019–1029. - PubMed
    1. Arite, T. , Umehara, M. , Ishikawa, S. , Hanada, A. , Maekawa, M. , Yamaguchi, S. and Kyozuka, J. (2009) d14, a strigolactone‐Insensitive mutant of rice, shows an accelerated outgrowth of tillers. Plant Cell Physiol. 50, 1416–1424. - PubMed
    1. Callebaut, I. , Courvalin, J.C. and Mornon, J.P. (1999) The BAH (bromo‐adjacent homology) domain: a link between DNA methylation, replication and transcriptional regulation. FEBS Lett. 446, 189–193. - PubMed
    1. Chambers, A. , Pearl, L. , Oliver, A. and Downs, J. (2013) The BAH domain of Rsc2 is a histone H3 binding domain. Nucleic Acids Res. 41, 9168–9182. - PMC - PubMed
    1. Chen, S. , Wang, Z. and Cai, X. (2007) OsRRM, a Spen‐like rice gene expressed specifically in the endosperm. Cell Res. 17, 713–721. - PubMed

Publication types

MeSH terms

Substances

LinkOut - more resources