. 2023 Mar 15;210(6):807-819.
doi: 10.4049/jimmunol.2200215.

Long Noncoding RNA U90926 Is Induced in Activated Macrophages, Is Protective in Endotoxic Shock, and Encodes a Novel Secreted Protein

Affiliations

Long Noncoding RNA U90926 Is Induced in Activated Macrophages, Is Protective in Endotoxic Shock, and Encodes a Novel Secreted Protein

Bristy Sabikunnahar et al. J Immunol. .

Abstract

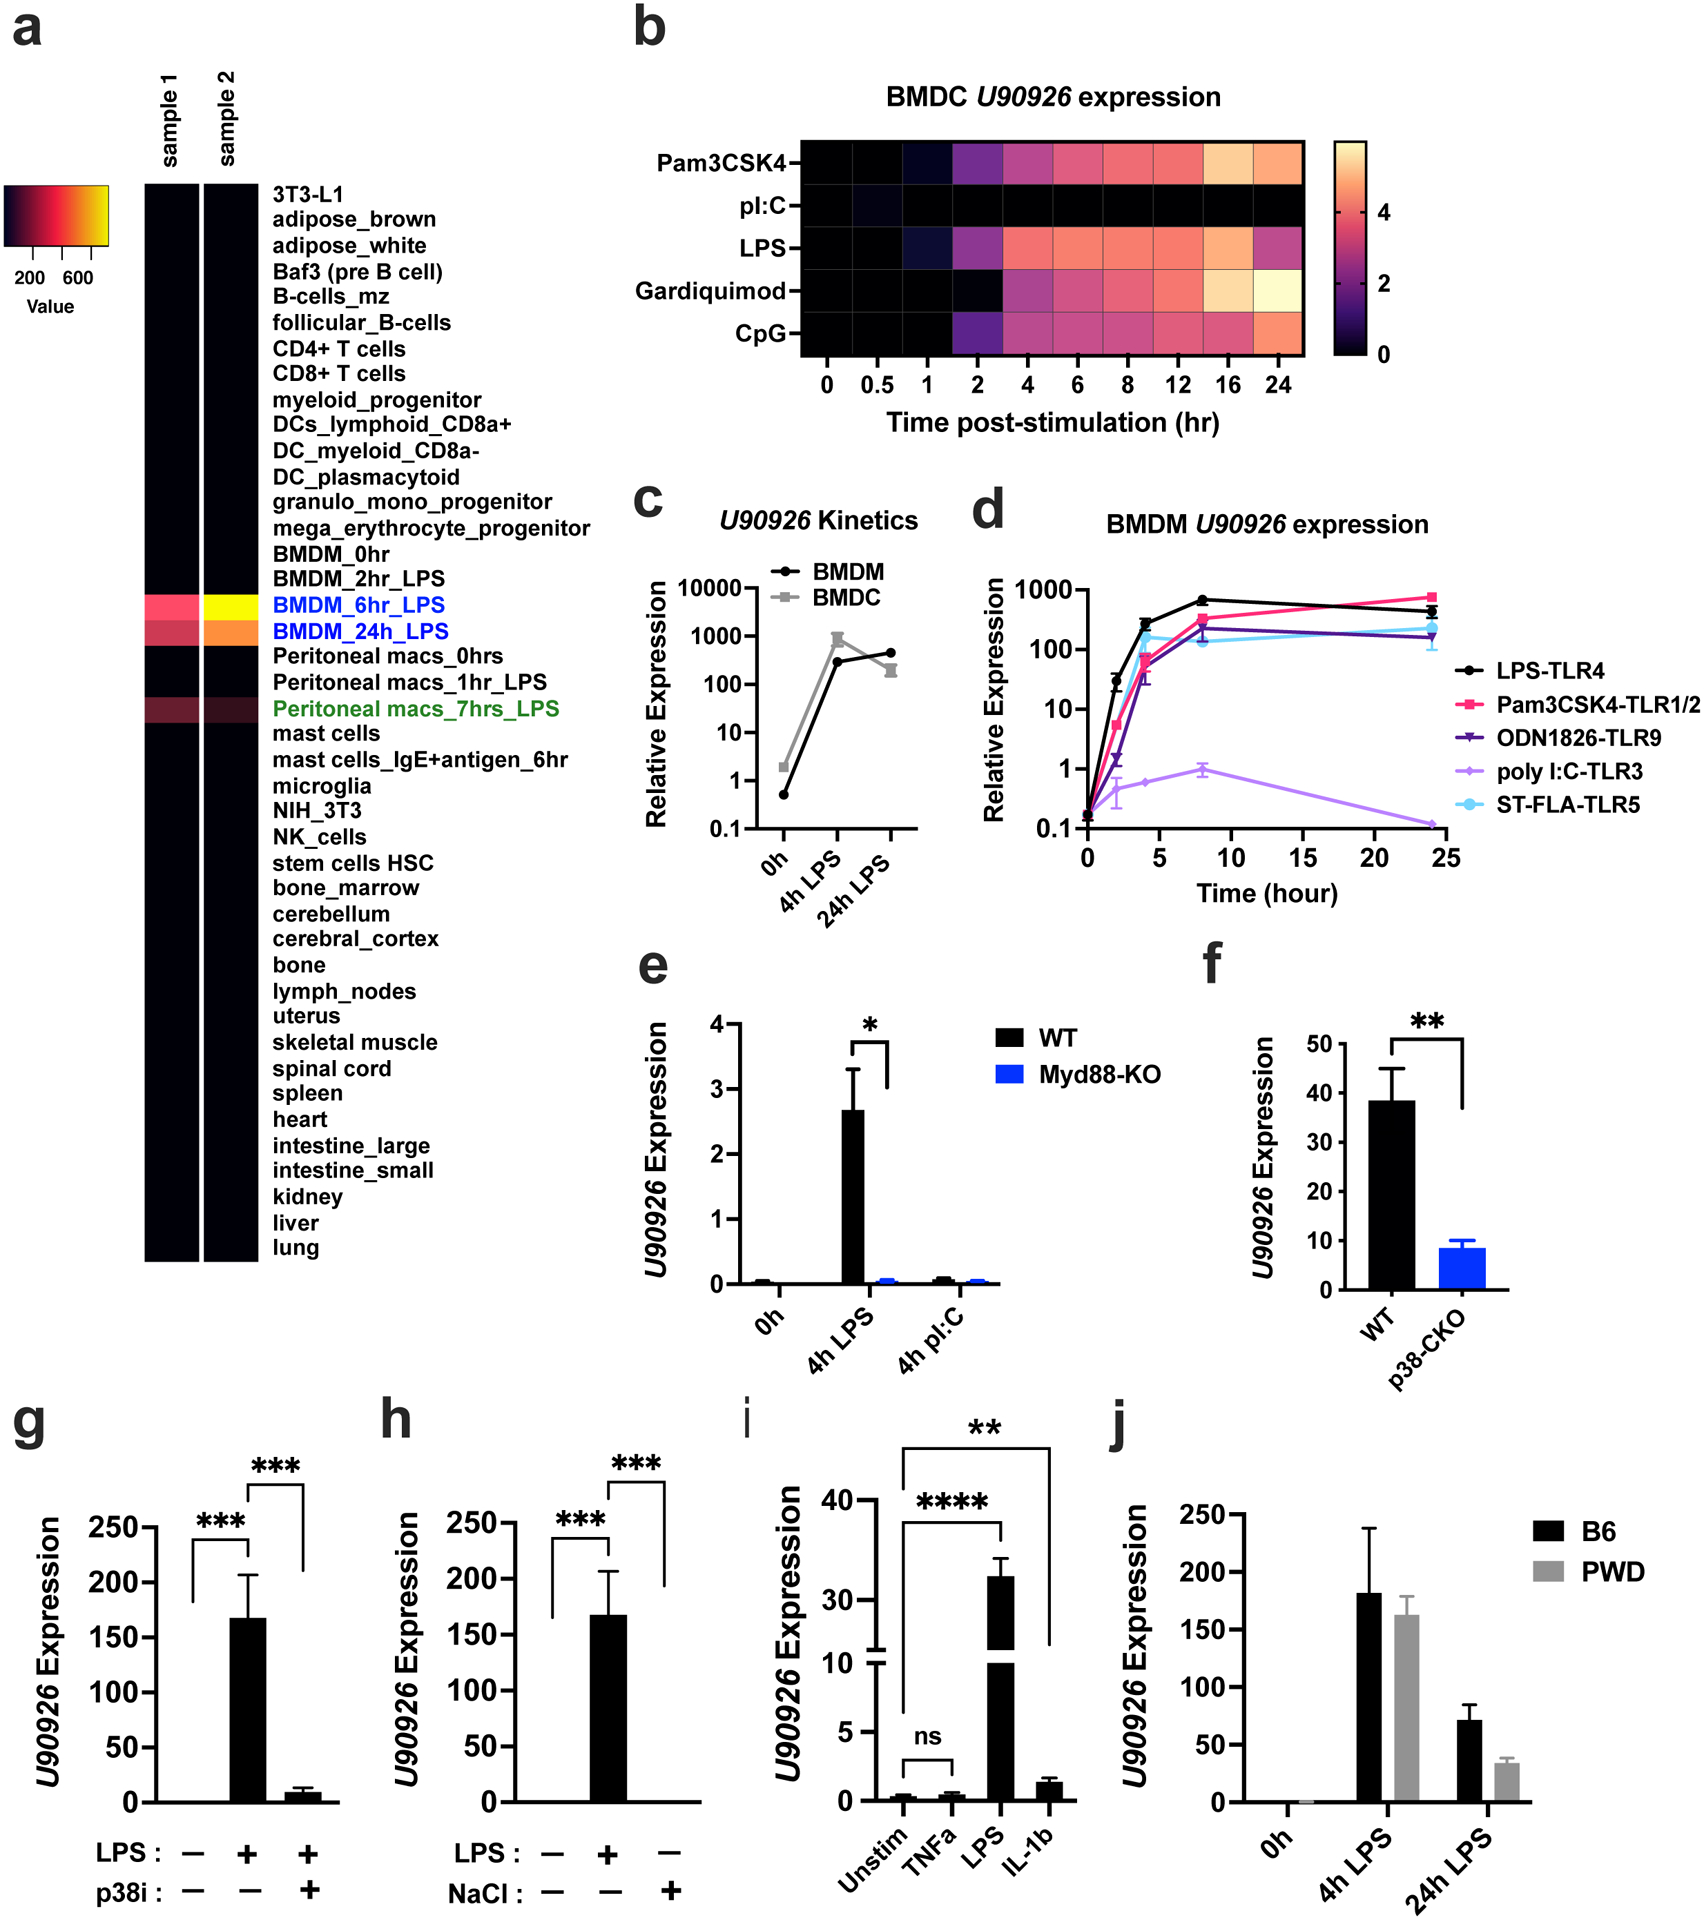
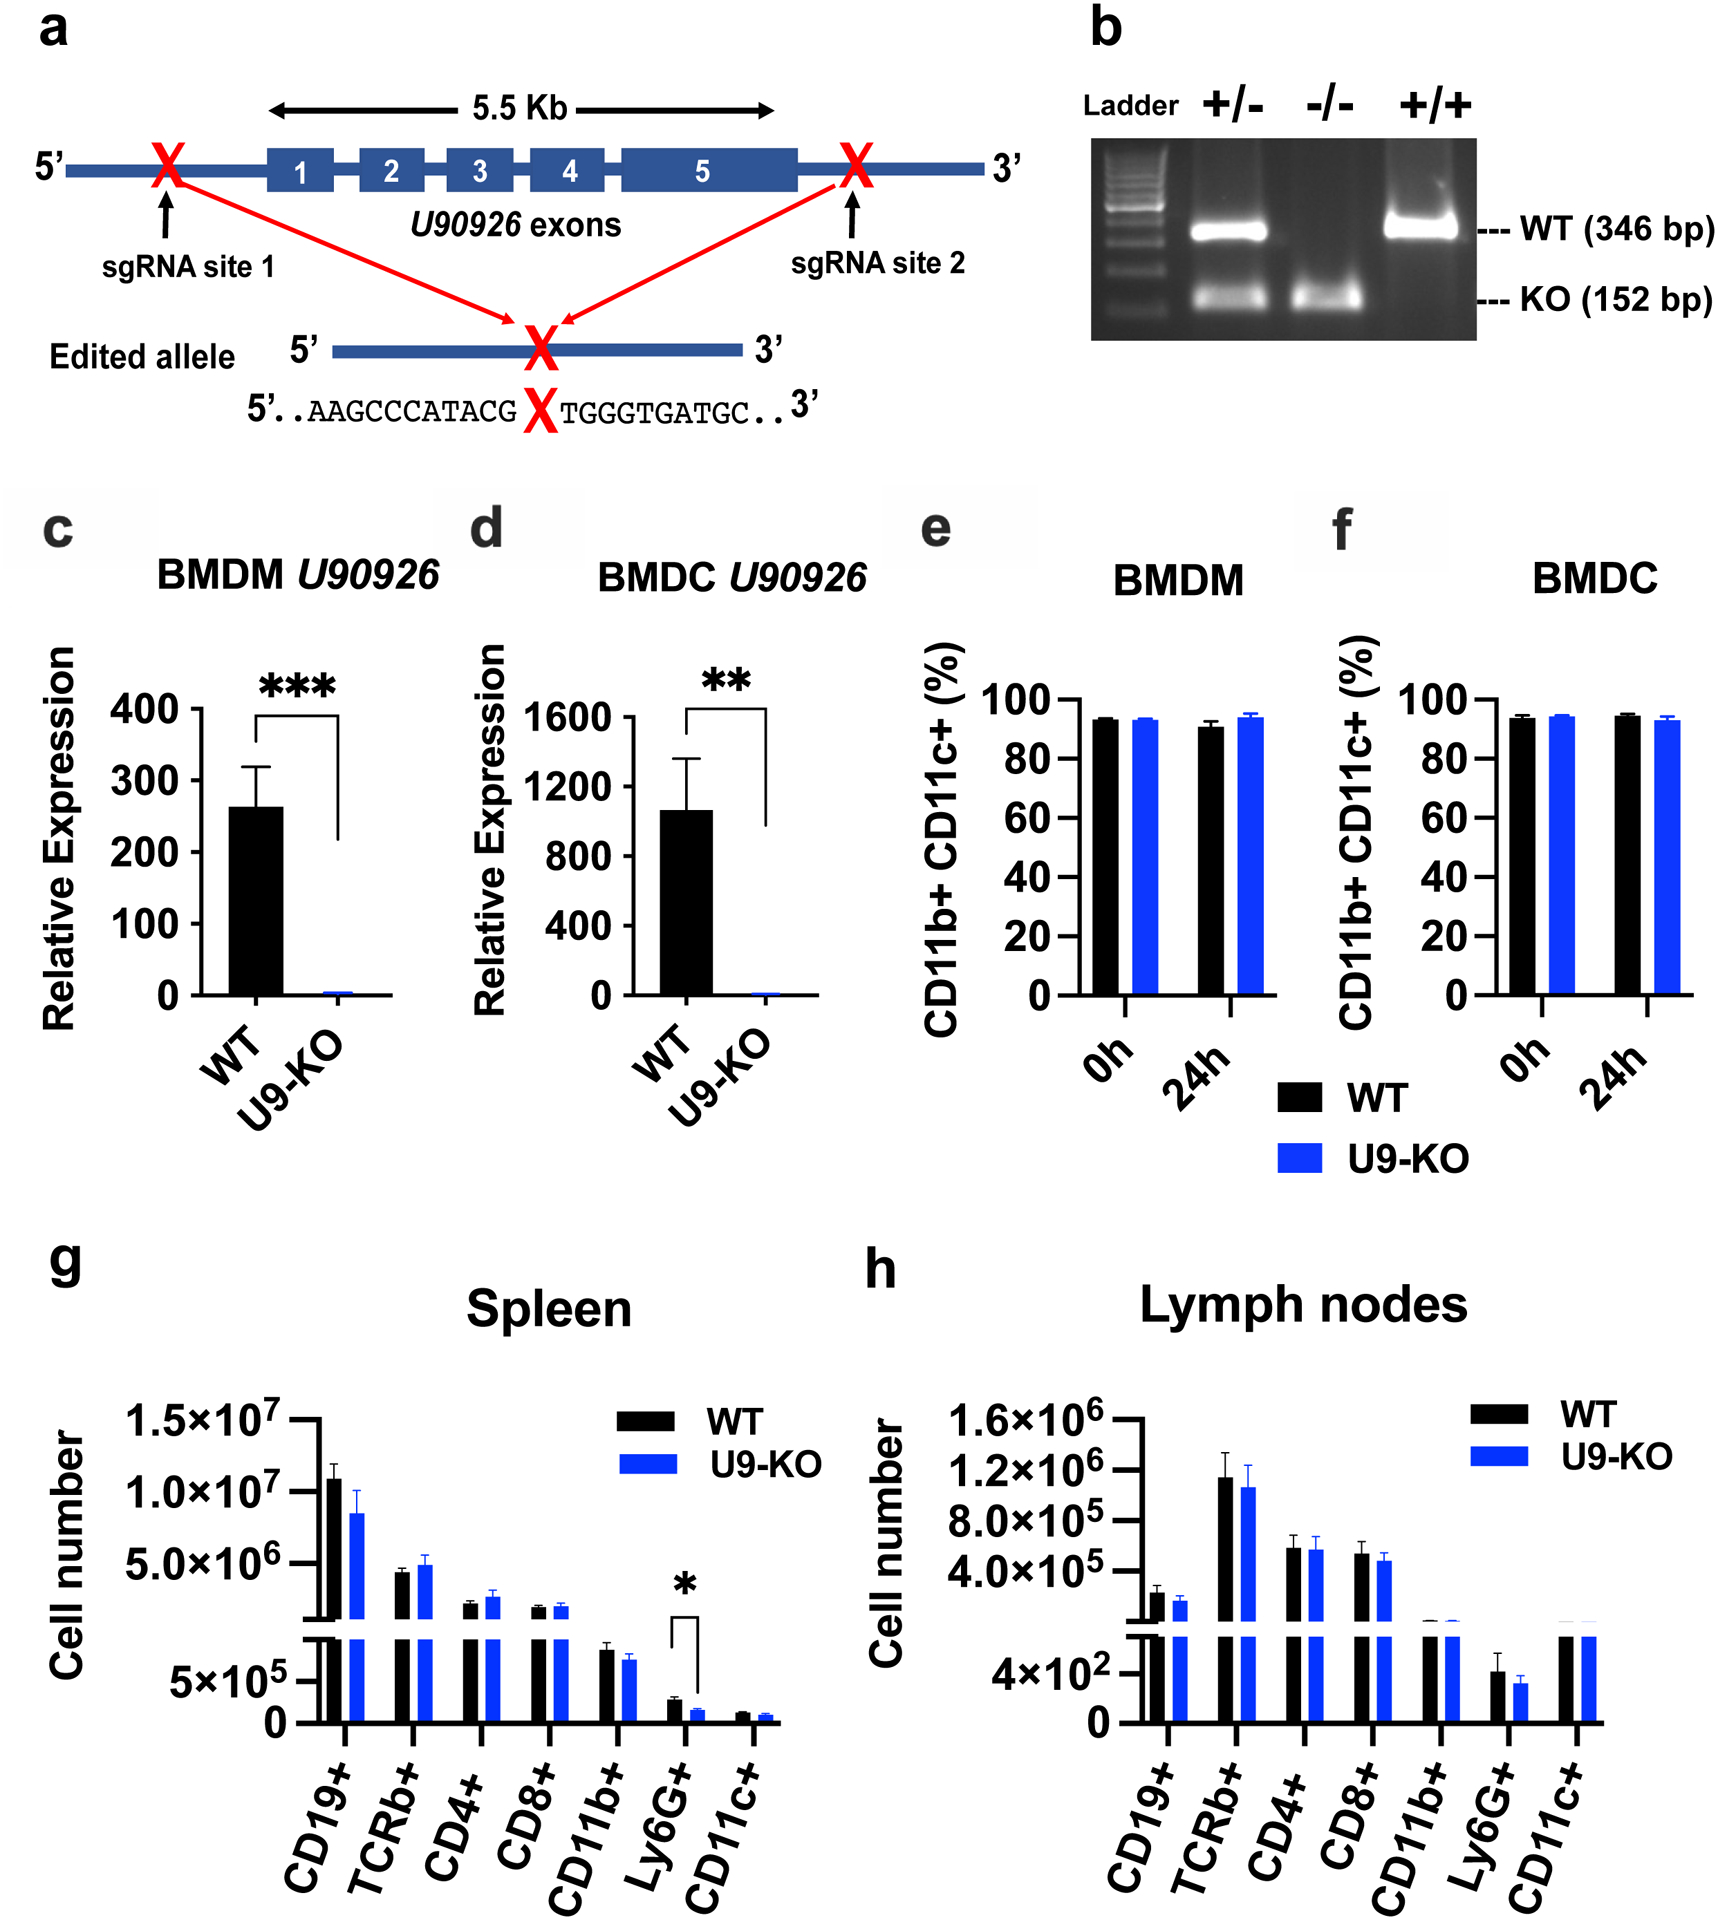
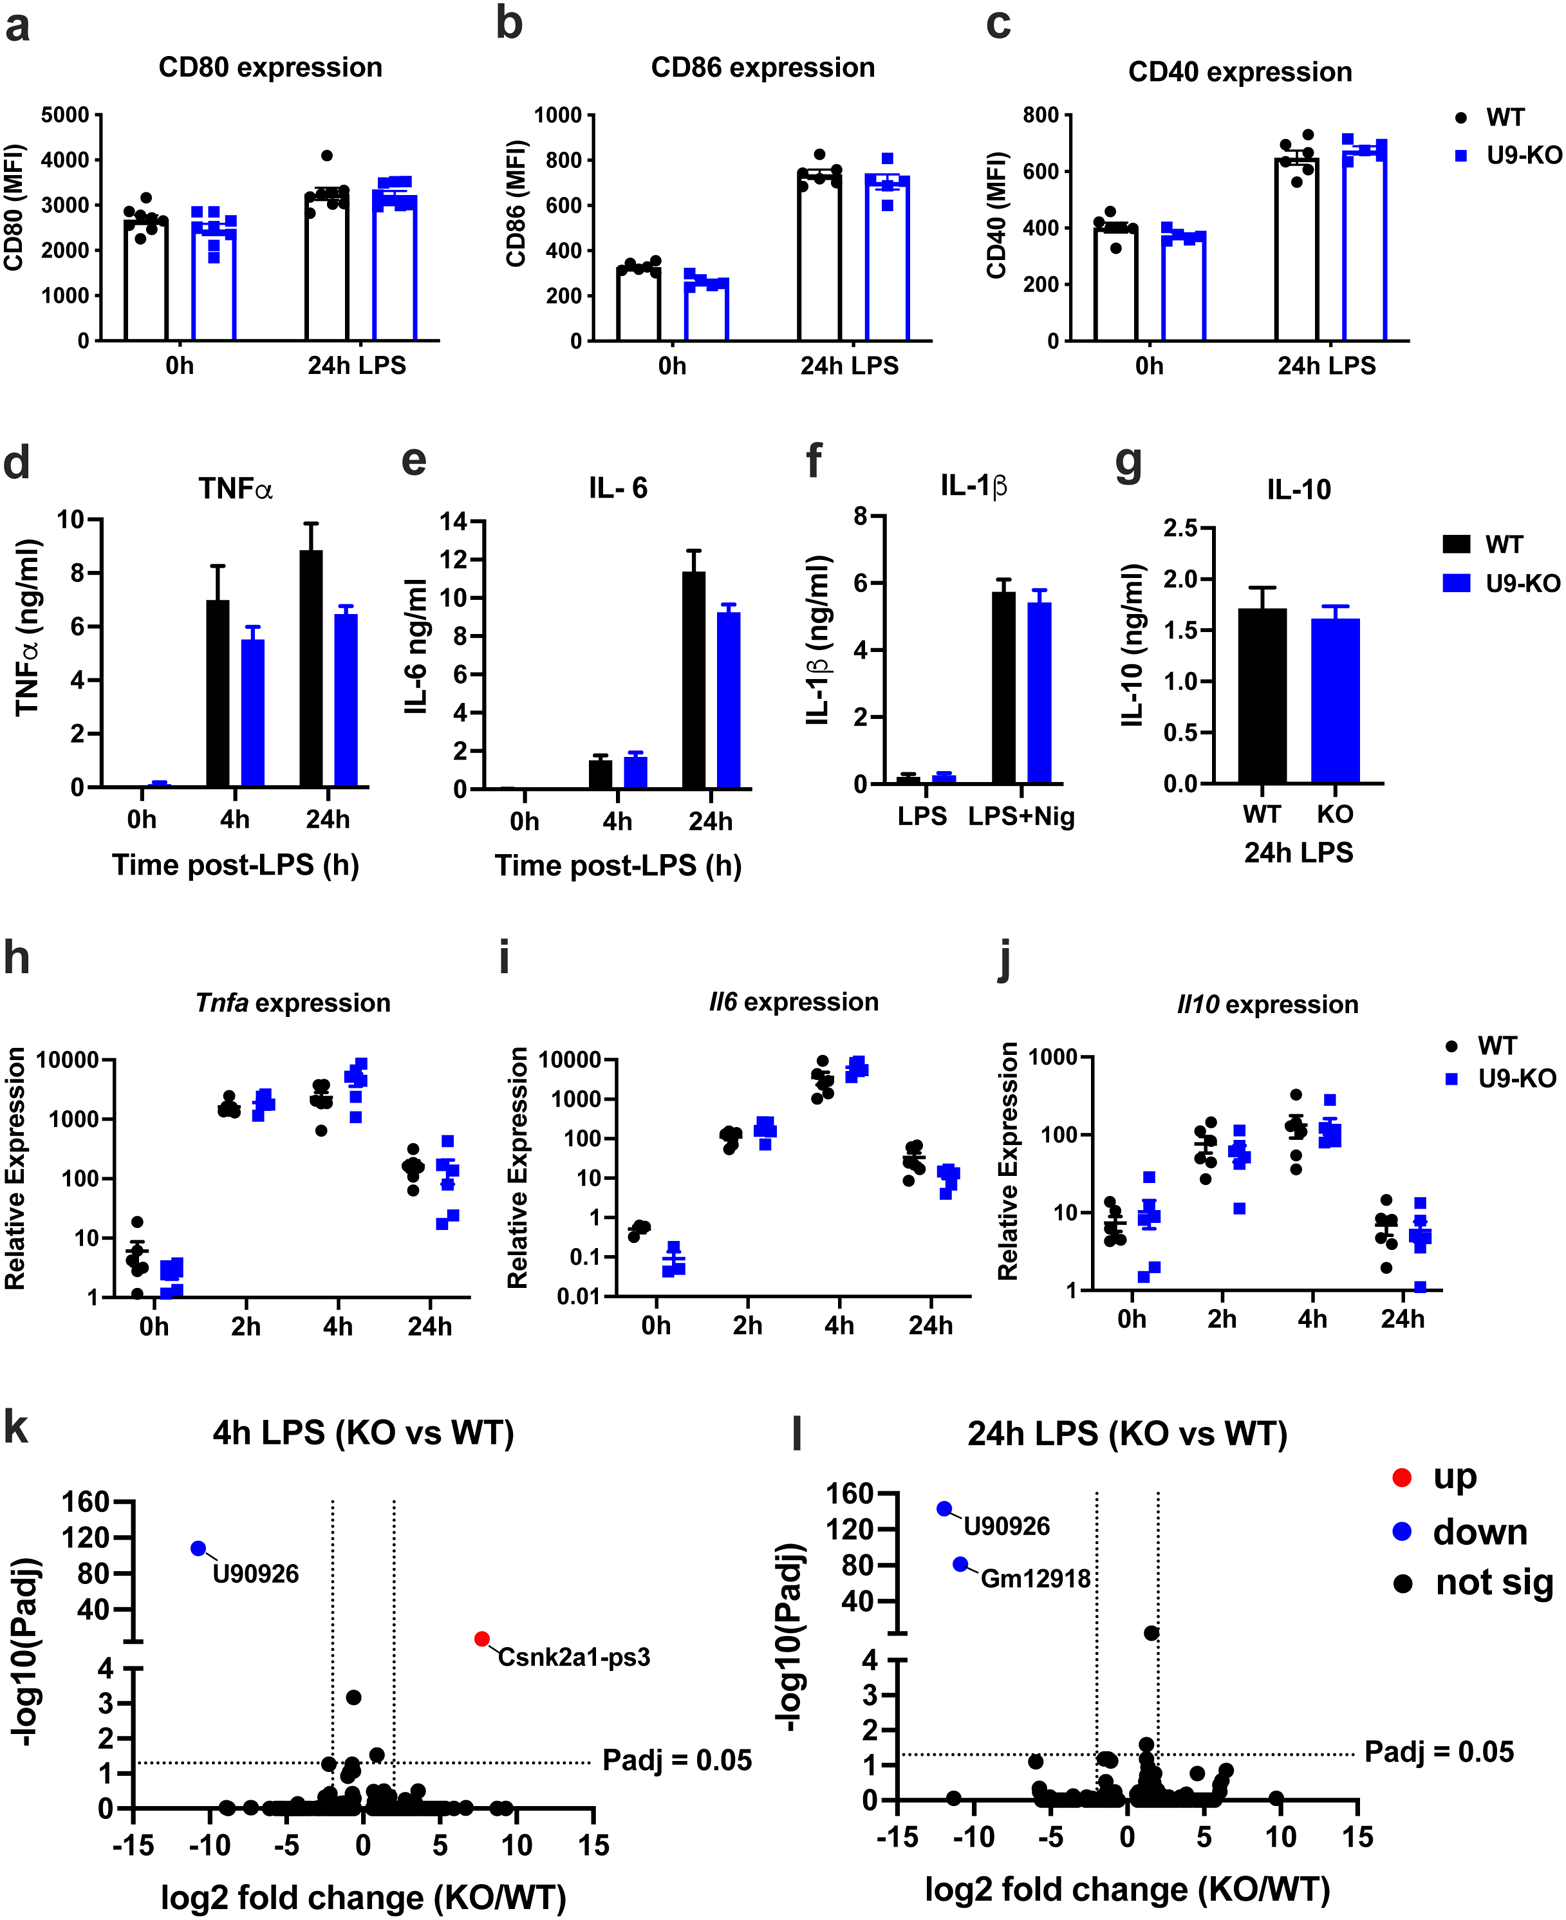
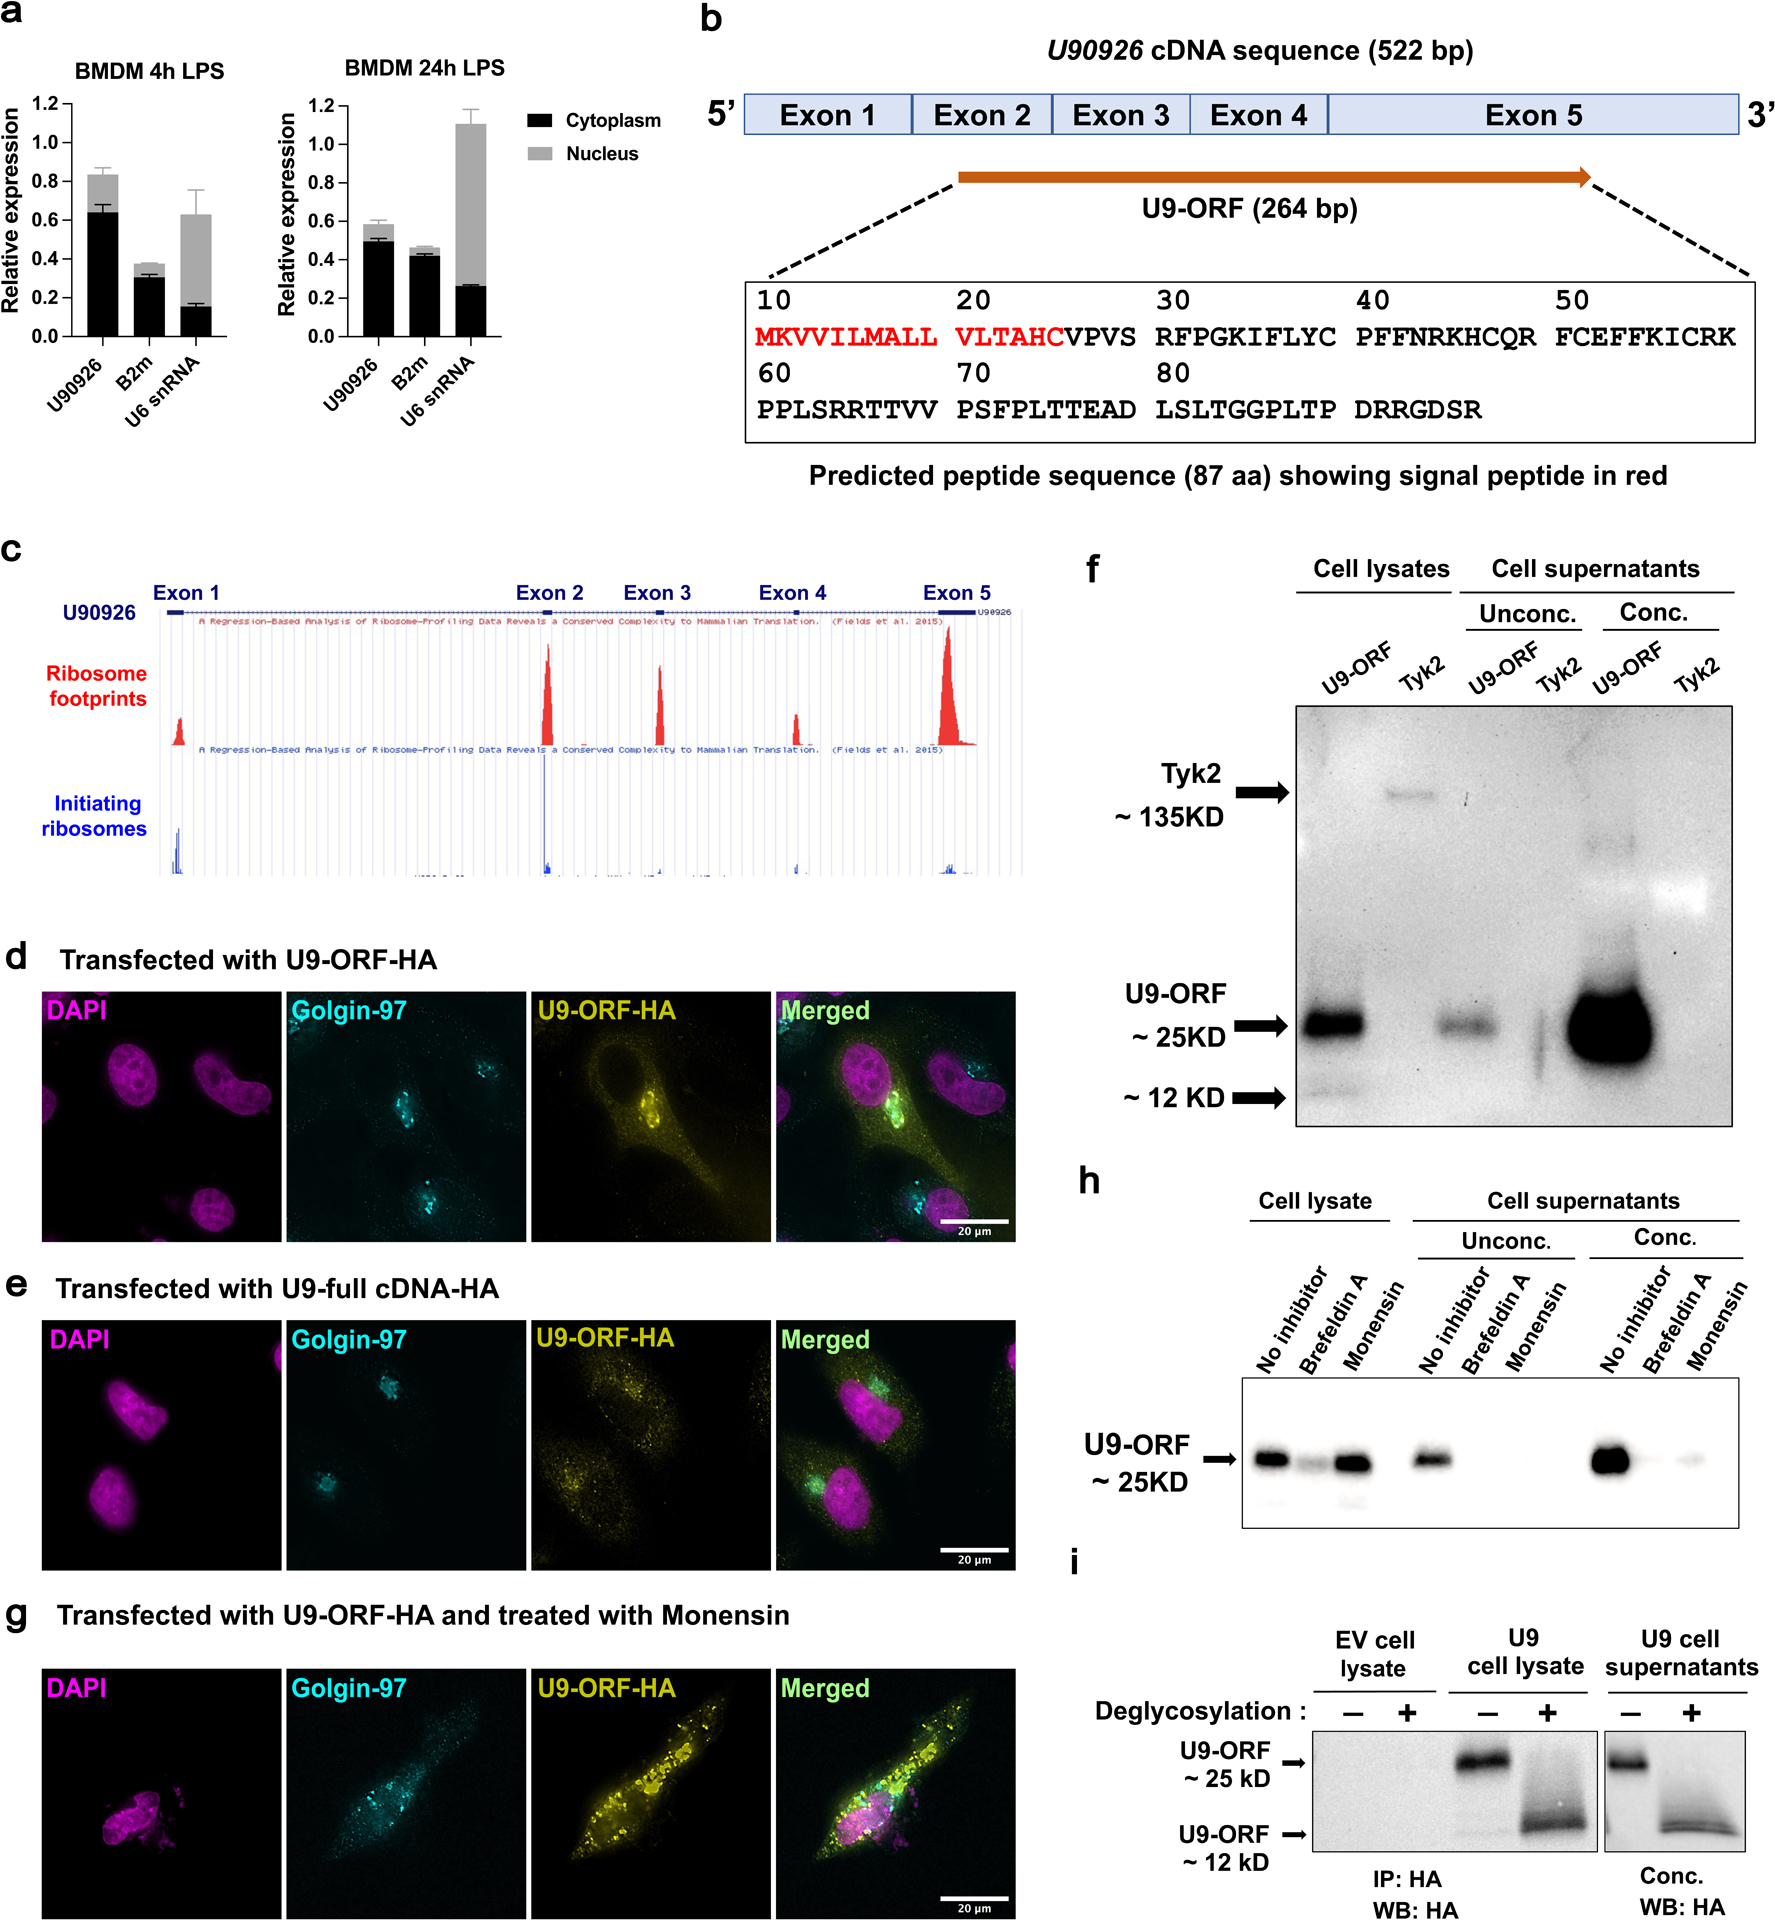
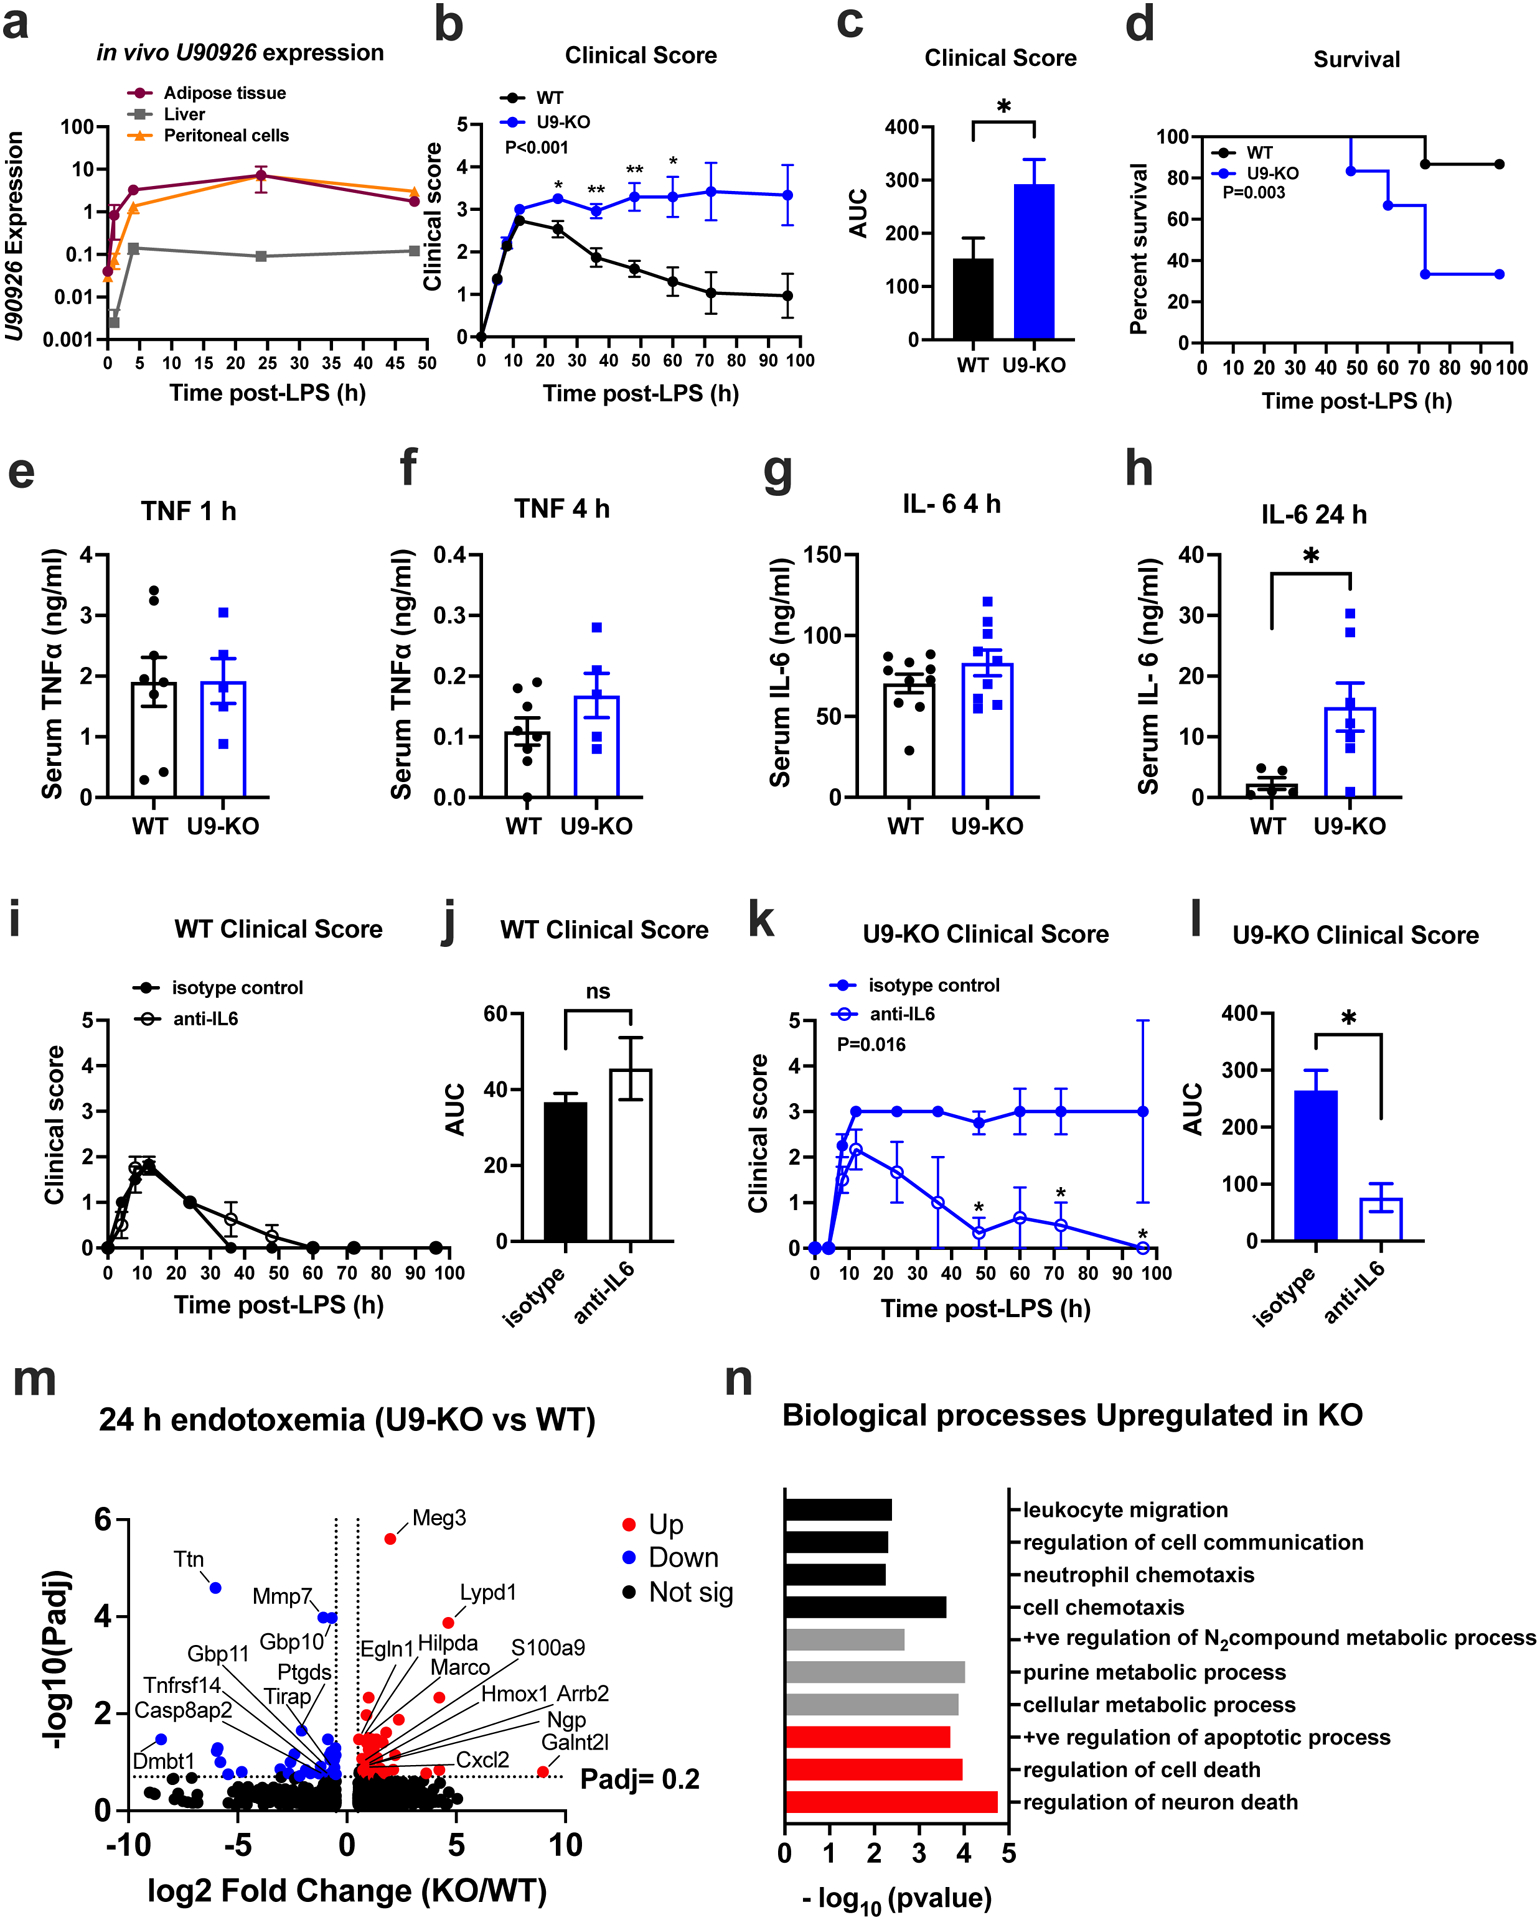
Thousands of long noncoding RNAs are encoded in mammalian genomes, yet most remain uncharacterized. In this study, we functionally characterized a mouse long noncoding RNA named U90926. Analysis of U90926 RNA levels revealed minimal expression across multiple tissues at steady state. However, the expression of this gene was highly induced in macrophages and dendritic cells by TLR activation, in a p38 MAPK- and MyD88-dependent manner. To study the function of U90926, we generated U90926-deficient (U9-KO) mice. Surprisingly, we found minimal effects of U90926 deficiency in cultured macrophages. Given the lack of macrophage-intrinsic effect, we investigated the subcellular localization of U90926 transcript and its protein-coding potential. We found that U90926 RNA localizes to the cytosol, associates with ribosomes, and contains an open reading frame that encodes a novel glycosylated protein (termed U9-ORF), which is secreted from the cell. An in vivo model of endotoxic shock revealed that, in comparison with wild type mice, U9-KO mice exhibited increased sickness responses and mortality. Mechanistically, serum levels of IL-6 were elevated in U9-KO mice, and IL-6 neutralization improved endotoxemia outcomes in U9-KO mice. Taken together, these results suggest that U90926 expression is protective during endotoxic shock, potentially mediated by the paracrine and/or endocrine actions of the novel U9-ORF protein secreted by activated myeloid cells.


Figures

Figure 1.
Figure 1.. Expression of U90926 is induced in mouse macrophage and dendritic cells by TLR signals in a MyD88- and p38α MAPK-dependent manner.
(a) Microarray gene expression data for U90926 were downloaded from BioGPS.org using the geneatlas_MOE430 dataset. A subset of representative tissues is shown in a heatmap. (b) U90926 expression in BMDC stimulated with the indicated TLR ligands was extracted from a published Nanostring gene expression dataset(33). (c) BMDMs and BMDCs were isolated from B6 mice and stimulated with LPS (100 ng/ml) for 4h and 24h, followed by RT-qPCR for U90926 expression measurement. (d) B6 WT BMDMs were stimulated with the TLR-ligands LPS (100 ng/ml), Pam3CSK4 (1 μg/ml), ODN1826 (1 μM), polyI:C (10 μg/ml), or ST-FLA (1 μg/ml) for the indicated times, followed by RT-qPCR to measure U90926 expression. (e) Immortalized BMDMs from WT and MyD88-KO B6 mice were stimulated with LPS (100 ng/ml) or polyI:C (10 μg/ml) for 4 hours, and U90926 expression was measured by RT-qPCR. (f) BMDMs were isolated from p38αCKOLysm (p38-CKO) and p38αflox/flox Cre-negative littermate control (WT) B6 mice and stimulated with LPS in vitro for 4hrs, followed by RT-qPCR to measure U90926 expression. (g) BMDMs were isolated from WT B6 mice and stimulated with LPS with or without pretreatment with the p38 MAPK inhibitor SB203580 (p38i, 10μM) for 4 hrs, followed by RT-qPCR. (h) BMDMs isolated from WT B6 mice were treated with LPS (100 ng/ml) or NaCl (40 mM) for 4 hours, and U90926 expression was measured by RT-qPCR. (i) BMDMs isolated from WT B6 mice were treated with TNFα (10 ng/ml), IL-10(10 ng/ml), and LPS (100 ng/ml) as positive control for 4 hours, followed by RT-qPCR. (j) BMDMs were isolated from B6 and PWD mice and stimulated with LPS (100 ng/ml) for 4 and 24 hours, followed by RT-qPCR. All RT-qPCR data are expressed relative to the housekeeping gene Beta-2-microglobulin (B2m) and calculated by a comparative Ct method formula 2^-(deltaCt), and multiplied by a factor of 10,000 for ease of visualization. Data are represented as the mean ± SEM. Significance was determined by two-way ANOVA for panel (e) and two-tailed Student’s t test for panel (f). One-way ANOVA was performed for more than two groups comparison in panel (g) and (h). P values are represented as follows: ns>0.05, *=≤0.05, **=≤0.01, ***=≤0.001, ****=≤0.0001.
Figure 2.
Figure 2.. Generation and validation of U9-KO mice.
(a) Schematic of CRISPR targeting of the U90926 locus and the repaired double-strand break site (designated as “X”) flanked by the indicated sequences, as identified by Sanger sequencing. (b) PCR-based genotyping of U9-KO mice. Three primers were used in a single reaction: Forward primer was upstream of the sgRNA site 1, KO reverse primer downstream of sgRNA site 2 (yields a product only if U90926 whole locus is deleted), and a WT reverse primer downstream of sgRNA site 1 and near the exon 1 (only yields a product when U90926 is not deleted). (c, d) BMDM and BMDC were isolated from WT and U9-KO mice (n=6 for each group) and stimulated with LPS (100 ng/ml) for 4h, followed by RT-qPCR to measure U90926 expression. (e, f) BMDM and BMDC isolated from WT and U9-KO mice (n=8 for each group) were stimulated with LPS (100ng/ml) for 24h and analyzed by flow cytometry using CD11b and CD11c differentiation markers. (g, h) Cells were isolated from spleen and lymph nodes of naïve WT and U9-KO mice (n=8 for each group). Flow cytometry and cell counting was used to enumerate the following cell subsets: CD19+ (B cells; CD19+ CD11b TCRβ), TCRβ+ ((T cells; CD19 CD11b TCRβ+), CD4+ (CD4 T cells; CD19 CD11b TCRβ+ CD4+) and CD8+ (CD8 T cells; CD19 CD11b TCRβ+ CD8+) and different myeloid cells markers, CD11b+ (CD19 CD11b+ TCRβ CD11c), CD11c+ (CD19 CD11b TCRβ CD11c+) and Ly6G+ (CD19 CD11b+ TCRβ CD11c Ly6G+). Data are represented as the mean ± SEM. Significance was determined by Student’s t test in panel (c) and (d). Two-way ANOVA was performed in panel (e) and (f) and Student’s t test was performed for panel (g) and (h). P values are represented as follows: ns= >0.05, *= ≤0.05, **= ≤0.01, ***= ≤0.001.
Figure 3.
Figure 3.. U90926-deficiency has minimal intrinsic effects on macrophage function in vitro.
(a-c) WT and U9-KO BMDMs were stimulated with LPS (100 ng/ml) for 24h. Cell surface expression of the co-stimulatory markers CD80, CD86, and CD40 was measured by flow cytometry, and expressed as mean fluorescence intensity (MFI). (d-g) WT and U9-KO BMDMs were stimulated with LPS (100 ng/ml) for the indicated times, and cytokine production in the supernatants was analyzed by ELISA. In (f), BMDMs were stimulated with LPS (100 ng/ml) for 4h and followed by addition of nigericin (5 μM) for 1h. In (g), IL-10 secretion was measured at 24h post-LPS only, since it was not detectable at 4h by ELISA. (h-j) RNA was isolated from WT and U9-KO BMDMs stimulated with LPS (100 ng/ml) at 0h, 2h, 4h and 24h, followed by RT-qPCR to measure mRNA expression of the indicated cytokine genes. RT-qPCR data are expressed relative to the housekeeping gene, Beta-2-microglobulin (B2m), and multiplied by a factor of 10,000 for ease of visualization. Data are represented as the mean ± SEM. Significance was determined by two-tailed Student’s t test. (k, l) WT and U9-KO BMDMs (n=4 for each group) were stimulated with LPS (100 ng/ml) for 4h and 24h, and RNAseq was performed as indicated in Methods. DEseq2 analysis was used to identify differentially expressed genes. Volcano plots show differentially expressed genes passing a cutoff of |Log2 Fold Change|=2, Padj <0.05 (dotted lines on the plots), with up (red) = upregulated in U9-KO, down (blue) = downregulated in U9-KO.
Figure 4.
Figure 4.. U90926 RNA localizes to the cytoplasm, associates with ribosomes, and contains an ORF that encodes a secreted protein.
(a) WT BMDM were stimulated for 4h and 24h with LPS (100ng/ml), followed by isolation of nuclear and cytoplasmic fractions and RTq-PCR analysis of U90926, B2m (cytoplasmic control), and U6 SnRNA (nuclear control) expression (each normalized to unfractionated input as equal to 1). (b) A schematic diagram of U90926 cDNA sequence (522 bp) containing the 264 bp ORF spanning the exons is shown. Predicted amino acid sequences of the U9-ORF peptide (87 aa) and the signal peptide identified by SignalP software shown in red. (c) GWiPS was used to analyze of Ribo-seq data from LPS stimulated BMDC(46) at the U90926 locus. Global ribosome footprints or initiating ribosomes footprint data (in the presence of harringtonine) are shown, as indicated. (d, e) HeLa cells were transfected with U9-ORF-HA (d) and U9-full-lengthcDNA-HA (e) plasmids, followed by immunostaining for HA (yellow) and Golgin-97 (cyan; Golgi marker), and DAPI nuclear staining (magenta). (f) HeLa cells were transfected with U9-ORF-HA and TYK2-HA plasmids for 48 hours, followed by immunoblot analysis. Supernatants were loaded directly or concentrated using StrataClean resin, as indicated (Unconc. or Conc., respectively). (g) HeLa cells were transfected with U9-ORF-HA for total 48 hours, where protein transport inhibitor, monensin was added at 24 hours, and then cells were subjected to immunostaining at 48 hours of transfection, as above. (h) HeLa cells were transfected with U9-ORF-HA for a total of 48 hours, in which protein transport inhibitors, brefeldin A and monensin were added at 24 hours, and sample collection was done at 48 hours of transfection, followed by immunoblot analysis. Supernatants were analyzed as described above. (i) HeLa cells were transfected with empty vector control and U9-ORF-HA plasmid for 48 hours. Cell lysates were immunoprecipitated using an anti-HA antibody and supernatants were concentrated using StrataClean resin, followed by deglycosylation under denaturing conditions overnight at 37°C and analyzed by immunoblot.
Figure 5.
Figure 5.. U90926 deficiency exacerbates LPS endotoxemia by elevation of IL-6 levels.
(a) WT B6 mice were challenged with 15mg/kg LPS i.p. and tissues were collected at the indicated time points, followed by RNA extraction and measurement of U90926 expression by RT-qPCR. B2m was used a normalizer for relative expression, as in Fig. 1. (b-d) WT (n=15) and U9-KO (n=12) mice were challenged with 15 mg/kg LPS i.p., followed by evaluation of sickness behavior (b, c) and survival (d). (c) Area under the curve (AUC) was calculated from kinetic data in (b), to calculate a cumulative measurement of the disease severity. Clinical score evaluation measurement is described in the Methods section. (e-h) Serum was collected from the LPS-challenged mice at indicated time points, and TNFα and IL-6 levels were analyzed by ELISA. (i-l) WT (n=7) and U9-KO (n=5) mice were challenged with LPS (15mg/kg) and simultaneously administerted isotype control (anti-trinitrophenol) or anti-IL-6 antibodies (100 μg/mouse) by i.p. injection, followed by evaluation of sickness behavior in (i) and (k). Area under the curve (AUC) calculated from data in (i) and (k) is shown in (j) and (l). Significance of differences was assessed using 2-way ANOVA (panels b, i, and k), Mantel-Cox test (panel d), and Welch’s T test (panel c, e-h, j, l). P values are represented as follows: ns= >0.05, *= ≤0.05, **=≤0.01, ***=≤0.001. (m) WT (n=4) and U9-KO (n=4) mice were challenged with 15mg/kg LPS i.p. for 24 h and RNAseq was performed on whole liver tissue RNA as indicated in Methods. DEseq2 analysis was used to identify differentially expressed genes. Volcano plots showing differentially expressed genes at a cutoff of |Log2 Fold Change|>0.6, Padj <0.2 (dotted lines on the plots) with up (red) = upregulated in U9-KO, down (blue) = downregulated in U9-KO. Selected genes of interest are labelled. (n) Differentially expressed genes upregulated in U9-KO were analyzed by GO enrichment analysis by PANTHER. A subset of select pathways are shown, falling into three major categories, indicated in black (cell migration/chemotaxis), grey (metabolic processes) and red (cell death/apoptosis).

Similar articles

Cited by

References

    1. Deutschman CS, Hellman J, Roca RF, De Backer D, and Coopersmith CM. 2020. The surviving sepsis campaign: basic/translational science research priorities. Intensive Care Med. Exp 8: 31. - PMC - PubMed
    1. Rhee C, Dantes R, Epstein L, Murphy DJ, Seymour CW, Iwashyna TJ, Kadri SS, Angus DC, Danner RL, Fiore AE, Jernigan JA, Martin GS, Septimus E, Warren DK, Karcz A, Chan C, Menchaca JT, Wang R, Gruber S, and Klompas M. 2017. Incidence and Trends of Sepsis in US Hospitals Using Clinical vs Claims Data, 2009–2014. JAMA 318: 1241–1249. - PMC - PubMed
    1. Ponting CP, Oliver PL, and Reik W. 2009. Evolution and functions of long noncoding RNAs. Cell 136: 629–641. - PubMed
    1. Ulitsky I, and Bartel DP. 2013. lincRNAs: genomics, evolution, and mechanisms. Cell 154: 26–46. - PMC - PubMed
    1. Taft RJ, Pheasant M, and Mattick JS. 2007. The relationship between non-protein-coding DNA and eukaryotic complexity. BioEssays News Rev. Mol. Cell. Dev. Biol 29: 288–299. - PubMed

Publication types