

Novel murine glioblastoma models that reflect the immunotherapy resistance profile of a human disease
- PMID: 36705543
- PMCID: PMC10398813
- DOI: 10.1093/neuonc/noad025
Novel murine glioblastoma models that reflect the immunotherapy resistance profile of a human disease
Abstract
Background: The lack of murine glioblastoma models that mimic the immunobiology of human disease has impeded basic and translational immunology research. We, therefore, developed murine glioblastoma stem cell lines derived from Nestin-CreERT2QkL/L; Trp53L/L; PtenL/L (QPP) mice driven by clinically relevant genetic mutations common in human glioblastoma. This study aims to determine the immune sensitivities of these QPP lines in immunocompetent hosts and their underlying mechanisms.
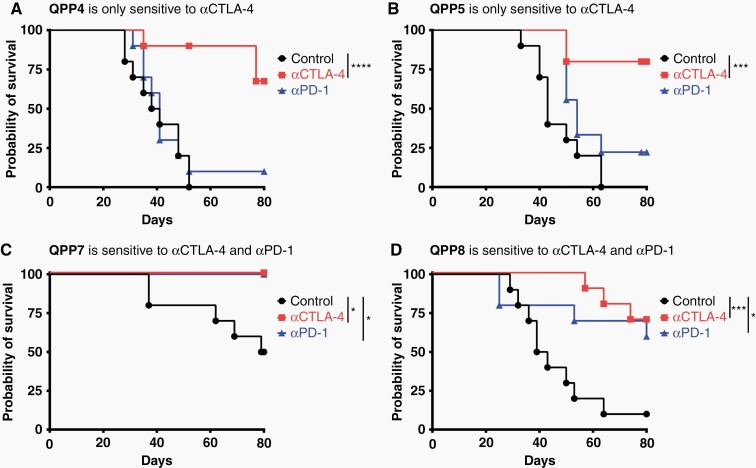
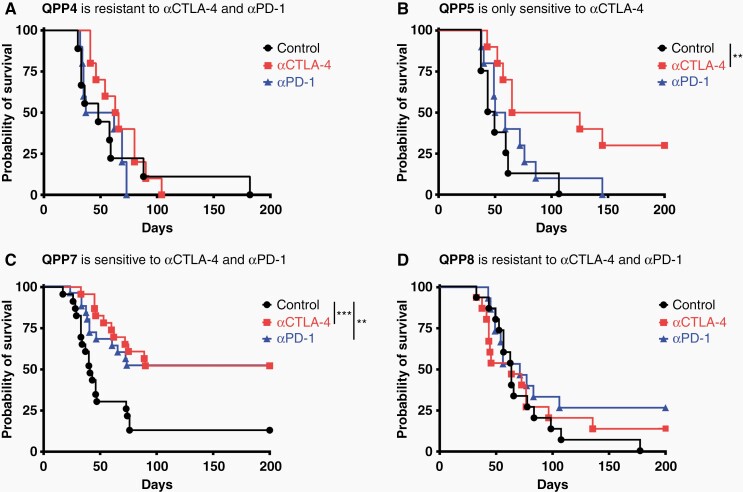
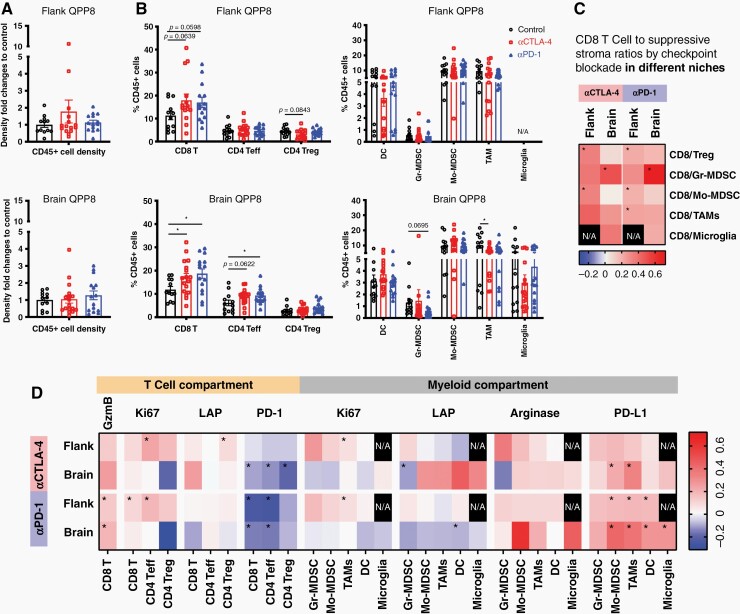
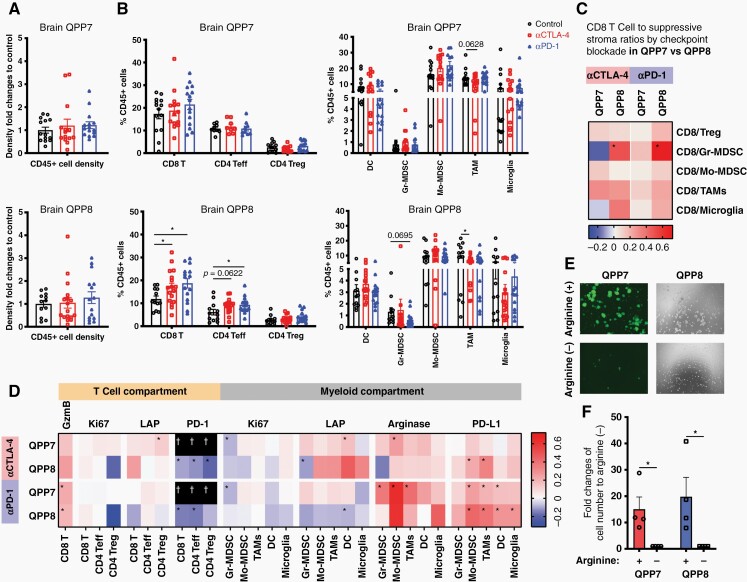
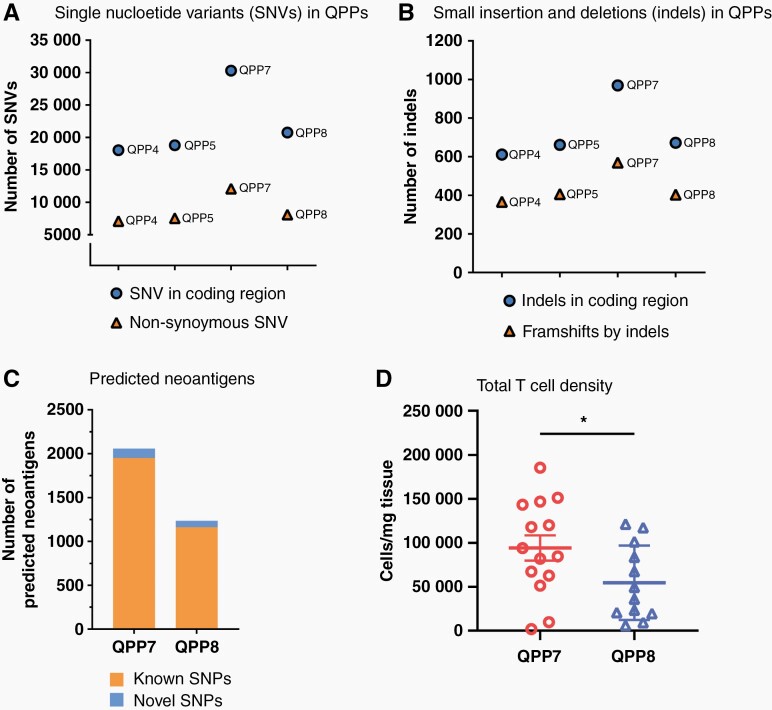
Methods: The differential responsiveness of QPP lines was assessed in the brain and flank in untreated, anti-PD-1, or anti-CTLA-4 treated mice. The impact of genomic landscape on the responsiveness of each tumor was measured through whole exome sequencing. The immune microenvironments of sensitive (QPP7) versus resistant (QPP8) lines were compared in the brain using flow cytometry. Drivers of flank sensitivity versus brain resistance were also measured for QPP8.
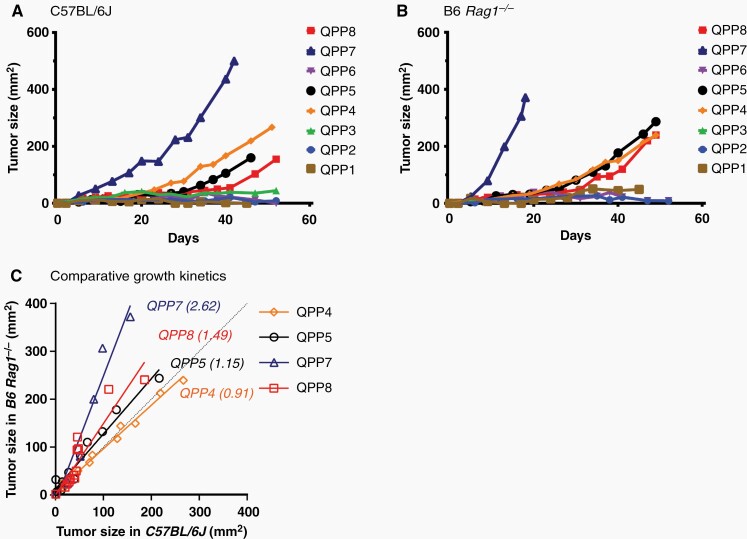
Results: QPP lines are syngeneic to C57BL/6J mice and demonstrate varied sensitivities to T cell immune checkpoint blockade ranging from curative responses to complete resistance. Infiltrating tumor immune analysis of QPP8 reveals improved T cell fitness and augmented effector-to-suppressor ratios when implanted subcutaneously (sensitive), which are absent on implantation in the brain (resistant). Upregulation of PD-L1 across the myeloid stroma acts to establish this state of immune privilege in the brain. In contrast, QPP7 responds to checkpoint immunotherapy even in the brain likely resulting from its elevated neoantigen burden.
Conclusions: These syngeneic QPP models of glioblastoma demonstrate clinically relevant profiles of immunotherapeutic sensitivity and potential utility for both mechanistic discovery and evaluation of immune therapies.
Keywords: 1; 4; Anti; CTLA; PD; anti; glioblastoma; immunotherapy.
© The Author(s) 2023. Published by Oxford University Press on behalf of the Society for Neuro-Oncology. All rights reserved. For permissions, please e-mail: journals.permissions@oup.com.
Conflict of interest statement
None related to the content of this manuscript.
Figures
Similar articles
-
Treatment of an aggressive orthotopic murine glioblastoma model with combination checkpoint blockade and a multivalent neoantigen vaccine.Neuro Oncol. 2020 Sep 29;22(9):1276-1288. doi: 10.1093/neuonc/noaa050. Neuro Oncol. 2020. PMID: 32133512 Free PMC article.
-
CCR2 inhibition reduces tumor myeloid cells and unmasks a checkpoint inhibitor effect to slow progression of resistant murine gliomas.Proc Natl Acad Sci U S A. 2020 Jan 14;117(2):1129-1138. doi: 10.1073/pnas.1910856117. Epub 2019 Dec 26. Proc Natl Acad Sci U S A. 2020. PMID: 31879345 Free PMC article.
-
Combination anti-CXCR4 and anti-PD-1 immunotherapy provides survival benefit in glioblastoma through immune cell modulation of tumor microenvironment.J Neurooncol. 2019 Jun;143(2):241-249. doi: 10.1007/s11060-019-03172-5. Epub 2019 Apr 25. J Neurooncol. 2019. PMID: 31025274
-
The Current Landscape of Immune Checkpoint Blockade in Glioblastoma.Neurosurg Clin N Am. 2021 Apr;32(2):235-248. doi: 10.1016/j.nec.2020.12.003. Neurosurg Clin N Am. 2021. PMID: 33781505 Review.
-
Combination immunotherapy strategies for glioblastoma.J Neurooncol. 2021 Feb;151(3):375-391. doi: 10.1007/s11060-020-03481-0. Epub 2021 Feb 21. J Neurooncol. 2021. PMID: 33611705 Review.
Cited by
-
STING agonist 8803 reprograms the immune microenvironment and increases survival in preclinical models of glioblastoma.J Clin Invest. 2024 Jun 17;134(12):e175033. doi: 10.1172/JCI175033. J Clin Invest. 2024. PMID: 38941297 Free PMC article.
-
In vivo mouse models for adult brain tumors: Exploring tumorigenesis and advancing immunotherapy development.Neuro Oncol. 2024 Nov 4;26(11):1964-1980. doi: 10.1093/neuonc/noae131. Neuro Oncol. 2024. PMID: 38990913 Free PMC article. Review.
-
MAPK/ERK signaling in gliomas modulates interferon responses, T cell recruitment, microglia phenotype, and immune checkpoint blockade efficacy.bioRxiv [Preprint]. 2024 Sep 18:2024.09.11.612571. doi: 10.1101/2024.09.11.612571. bioRxiv. 2024. PMID: 39345374 Free PMC article. Preprint.
-
Kunitz-type protease inhibitor TFPI2 remodels stemness and immunosuppressive tumor microenvironment in glioblastoma.Nat Immunol. 2023 Oct;24(10):1654-1670. doi: 10.1038/s41590-023-01605-y. Epub 2023 Sep 4. Nat Immunol. 2023. PMID: 37667051 Free PMC article.
-
Is modulation of immune checkpoints on glioblastoma-infiltrating myeloid cells a viable therapeutic strategy?Neuro Oncol. 2025 Jan 12;27(1):33-49. doi: 10.1093/neuonc/noae193. Neuro Oncol. 2025. PMID: 39427326 Review.
References
-
- Reardon DA, Omuro A, Brandes AA, et al. . OS10.3 randomized phase 3 study evaluating the efficacy and safety of nivolumab vs bevacizumab in patients with recurrent glioblastoma: checkmate 143. Neuro Oncol. 2017;19(Suppl_3):iii21–iii21.
-
- Qazi MA, Vora P, Venugopal C, et al. . Intratumoral heterogeneity: pathways to treatment resistance and relapse in human glioblastoma. Ann Oncol. 2017;28(7):1448–1456. - PubMed
Publication types
MeSH terms
Grants and funding
LinkOut - more resources
Full Text Sources
Other Literature Sources
Research Materials
Miscellaneous
