. 2022 Dec 28:12:giac128.
doi: 10.1093/gigascience/giac128. Epub 2023 Jan 27.

A molecular phenotypic map of malignant pleural mesothelioma

Affiliations

A molecular phenotypic map of malignant pleural mesothelioma

Alex Di Genova et al. Gigascience. .

Abstract

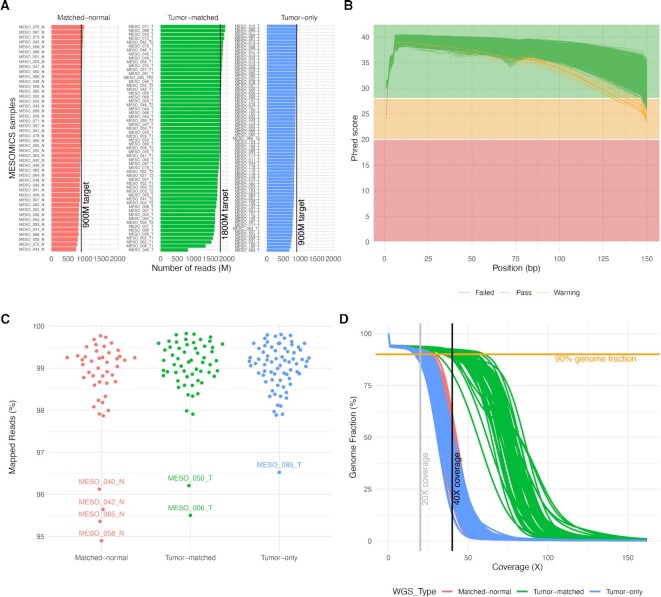
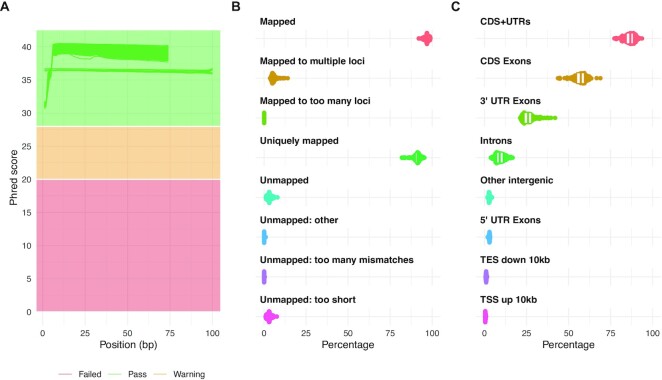
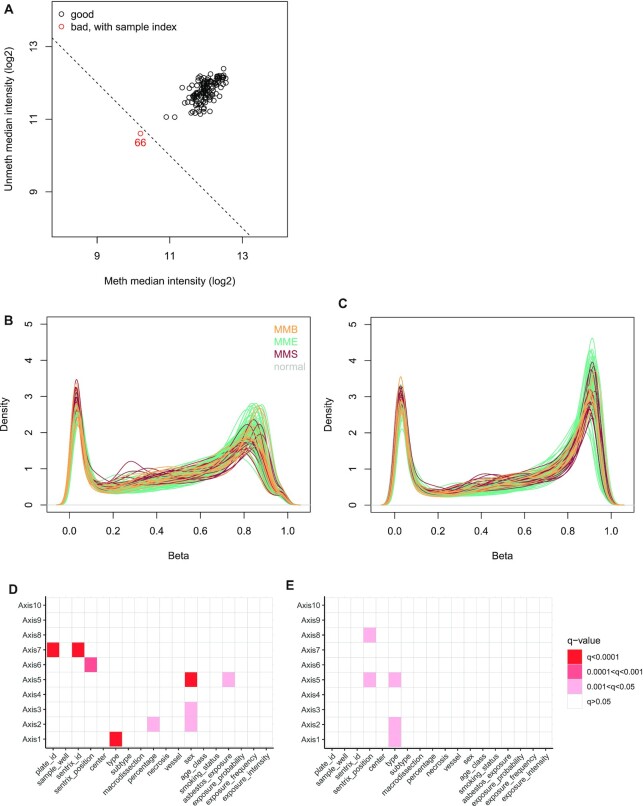
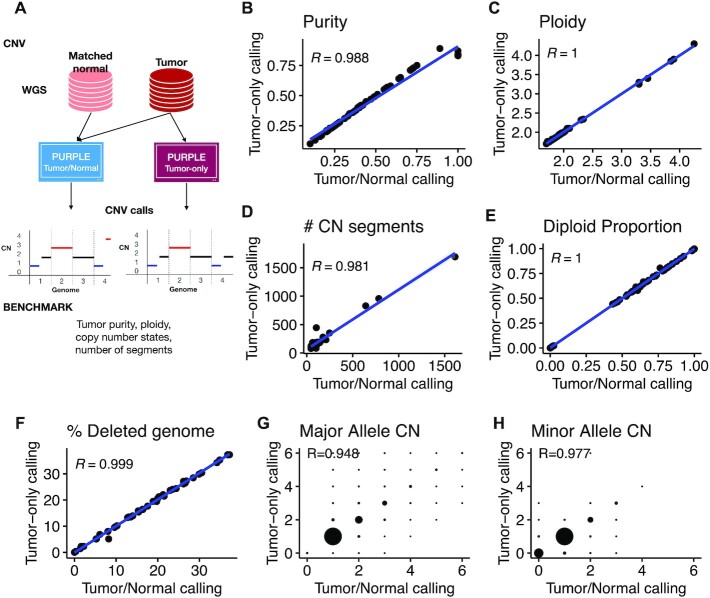
Background: Malignant pleural mesothelioma (MPM) is a rare understudied cancer associated with exposure to asbestos. So far, MPM patients have benefited marginally from the genomics medicine revolution due to the limited size or breadth of existing molecular studies. In the context of the MESOMICS project, we have performed the most comprehensive molecular characterization of MPM to date, with the underlying dataset made of the largest whole-genome sequencing series yet reported, together with transcriptome sequencing and methylation arrays for 120 MPM patients.

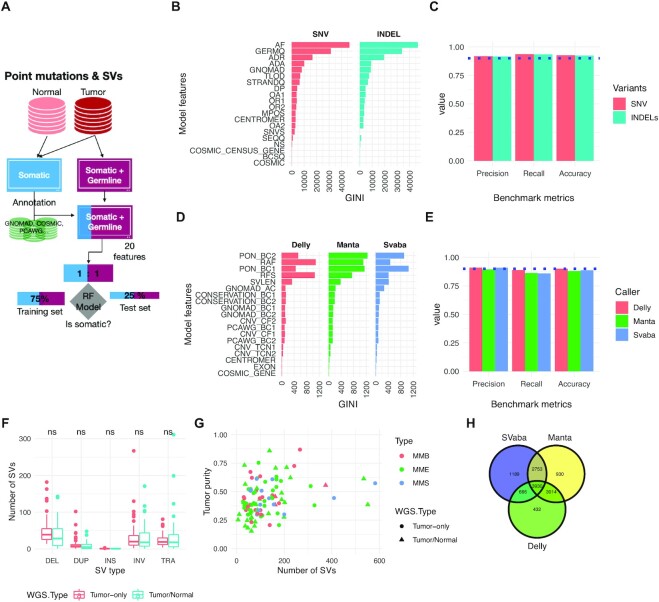
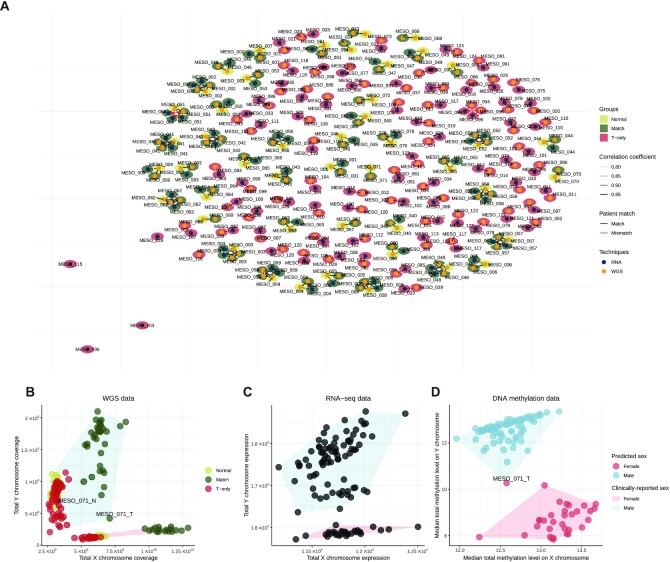
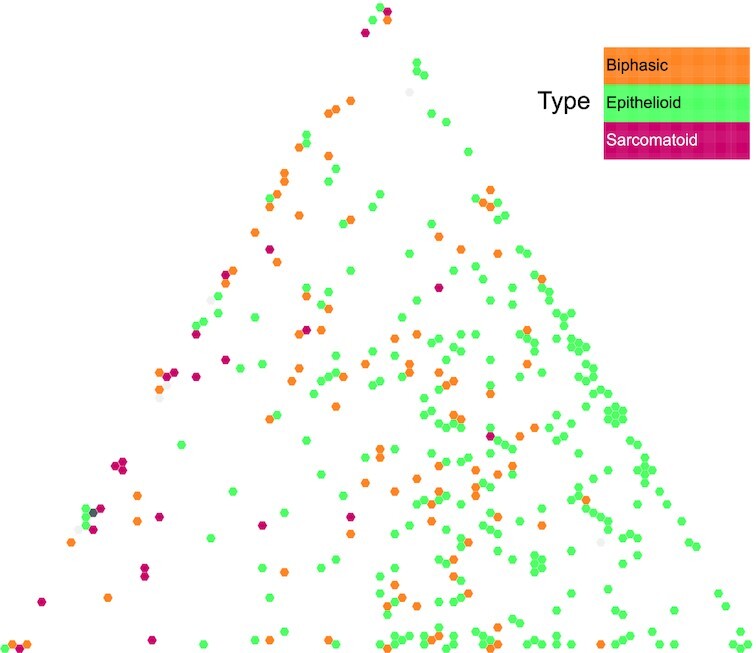
Results: We first provide comprehensive quality controls for all samples, of both raw and processed data. Due to the difficulty in collecting specimens from such rare tumors, a part of the cohort does not include matched normal material. We provide a detailed analysis of data processing of these tumor-only samples, showing that all somatic alteration calls match very stringent criteria of precision and recall. Finally, integrating our data with previously published multiomic MPM datasets (n = 374 in total), we provide an extensive molecular phenotype map of MPM based on the multitask theory. The generated map can be interactively explored and interrogated on the UCSC TumorMap portal (https://tumormap.ucsc.edu/?p=RCG_MESOMICS/MPM_Archetypes ).

Conclusions: This new high-quality MPM multiomics dataset, together with the state-of-art bioinformatics and interactive visualization tools we provide, will support the development of precision medicine in MPM that is particularly challenging to implement in rare cancers due to limited molecular studies.

Keywords: DNA methylation; cancer tasks; genomics; malignant pleural mesothelioma; quality control; transcriptomics; tumor map.


Conflict of interest statement

Where authors are identified as personnel of the International Agency for Research on Cancer/World Health Organization, the authors alone are responsible for the views expressed in this article and they do not necessarily represent the decisions, policy, or views of the International Agency for Research on Cancer/World Health Organization.

Figures

Figure 1:
Figure 1:
Quality control of whole-genome sequencing (WGS) data. (A) Number of reads per WGS type. (B) Mean sequence quality score as a function of the position in the read in base pairs. Green lines correspond to files that passed the most stringent quality control filters of software FastQC; orange lines correspond to files that passed a less stringent filter and red to files that did not pass the filters. (C) Percentage of aligned reads to the reference human genome. (D) Cumulative genome fraction computed directly from the BAM files.
Figure 2:
Figure 2:
Quality control of RNA-seq data. (A) Distribution of sequence quality scores in Phred scale for 2 × 75-bp and 2 × 100-bp read pairs. (B) STAR alignment scores. (C) Distribution of reads mapped to different genomic regions.
Figure 3:
Figure 3:
Quality control of EPIC array sequencing data. (A) Signal intensity plot. Log2 methylated and unmethylated median signal intensity plot of 140 samples. One sample (colored red) fell below the cutoff of 10.5 and was subsequently removed from analysis. (B) Prenormalization β density plot. The β density plot of 140 samples across 865,859 probes, colored by tumor/normal type, prior to functional normalization. (C) Postnormalization and filtering β density plot. The β density plot of 139 samples across 781,245 probes, colored by tumor/normal type, following functional normalization and removal of cross-reactive probes, sex chromosome probes, single-nucleotide polymorphism probes, and failed (P-detection > 0.01) probes. (D) Association of technical and clinical variables with prenormalization principal components. Association of technical and clinical variables with principal components 1 to 10, for 122 samples. Principal components calculated from M-values of 863,381 prenormalized probes. (E) Association of technical and clinical variables with postnormalization principal components. Principal components calculated from M-values of 781,245 probes following functional normalization and probe removal.
Figure 4:
Figure 4:
Performance of somatic copy number variant calling from tumor-only samples. (A) Schematic of the benchmarking procedure. Comparison of tumor/normal and tumor-only calling for (B) purity, (C) ploidy, (D) number of copy number segments, (E) diploid proportion, (F) percentage of deleted genome, (G) major allele copy number, and (H) minor allele copy number.
Figure 5:
Figure 5:
Performance of somatic point mutation and structural variant calling from tumor-only samples. (A) Schematic of the benchmarking procedure. (B) Random forest (RF) model features and their ranking for predicting somatic single-nucleotide variant (SNV) and indels. (C) Performance metrics (precision, recall, accuracy) for classifying somatic point mutations with the best-performing RF models. (D) Structural variant (SV) random forest model features and their ranking for predicting somatic SVs. (E) Performance metrics for classifying somatic SVs. (F) Number of SVs as function of WGS type. Mean comparison between WGS types was performed using a t-test with no significant (ns) result found. (G) Number of SVs as a function of tumor purity. A linear model (number_sv ∼Purity*WGS_type*SubType) was built to predict the number of SVs, and no significant coefficients (P < 0.05) were found. (H) Venn diagram of the final consensus MESOMIC SV set.
Figure 6:
Figure 6:
Applications of data validation using multiomics data. (A) Network of matching WGS and RNA-seq samples, as computed by software NGSCheckmate. Edge transparency corresponds to the Pearson correlation r between single-nucleotide polymorphism panel allelic fractions; node color and surrounding color correspond respectively to the techniques (WGS or RNA-seq) and to the tissue type (normal, matched samples, or T-only samples). (B–D) Sex reclassification and multiomic validation of reported clinical sex. (B) Total exome reads coverage on the X and Y chromosomes for each sample. (C) Total expression level of each sample on the X and Y chromosomes (in variance-stabilized read counts). (D) Median methylation array total intensity on the X and Y chromosomes. In panel (B), point colors correspond to the WGS groups: normal samples in light green, tumor samples with matched normals (Match) in dark green, and tumor samples without matched normal (T-only) in red. In each panel, filled polygons correspond to the sexes given by the clinical annotations (blue for male, red for female). In panel (D), point colors correspond to the sexes predicted by the DNA methylation QC. Samples with discordant reported clinical sex and molecular patterns on sex chromosomes are indicated.
Figure 7:
Figure 7:
MPM molecular phenotypic map. Screen capture from the TumorMap portal, using the hexagonal grid view, each point representing a MPM sample in the triangular phenotypic space: cell division (left vertice), tumor–immune interaction (top vertice), and acinar phenotype (right vertice). Point colors correspond to the histologic types and can be interactively changed by the users on the web portal.

References

    1. WHO Classification of Tumours Editorial Board . Thoracic Tumours: WHO Classification of Tumours. 5th ed. Geneva, Switzerland: WHO; 2021.
    1. Bueno R, Stawiski EW, Goldstein LD, et al. Comprehensive genomic analysis of malignant pleural mesothelioma identifies recurrent mutations, gene fusions and splicing alterations. Nat Genet. 2016;48:407–16. - PubMed
    1. Hmeljak J, Sanchez-Vega F, Hoadley KA et al. Integrative molecular characterization of malignant pleural mesothelioma. Cancer Discov. 2018;8:1548–65. - PMC - PubMed
    1. Alcala N, Mangiante L, Le-Stang N, et al. Redefining malignant pleural mesothelioma types as a continuum uncovers immune-vascular interactions. EBioMedicine. 2019;48:191–202. - PMC - PubMed
    1. Blum Y, Meiller C, Quetel L, et al. Dissecting heterogeneity in malignant pleural mesothelioma through histo-molecular gradients for clinical applications. Nat Commun. 2019;10:1333. - PMC - PubMed

Publication types