Clinical Trial
. 2023 Jan 27:12:e79946.
doi: 10.7554/eLife.79946.

Efficacy and safety of metabolic interventions for the treatment of severe COVID-19: in vitro, observational, and non-randomized open-label interventional study

Affiliations
Clinical Trial

Efficacy and safety of metabolic interventions for the treatment of severe COVID-19: in vitro, observational, and non-randomized open-label interventional study

Avner Ehrlich et al. Elife. .

Abstract

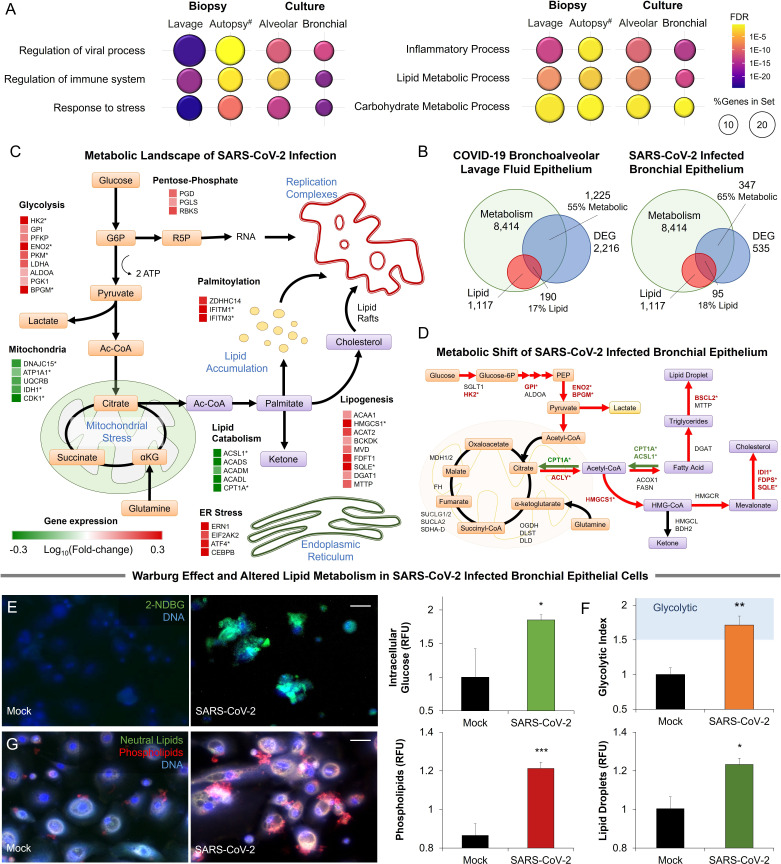
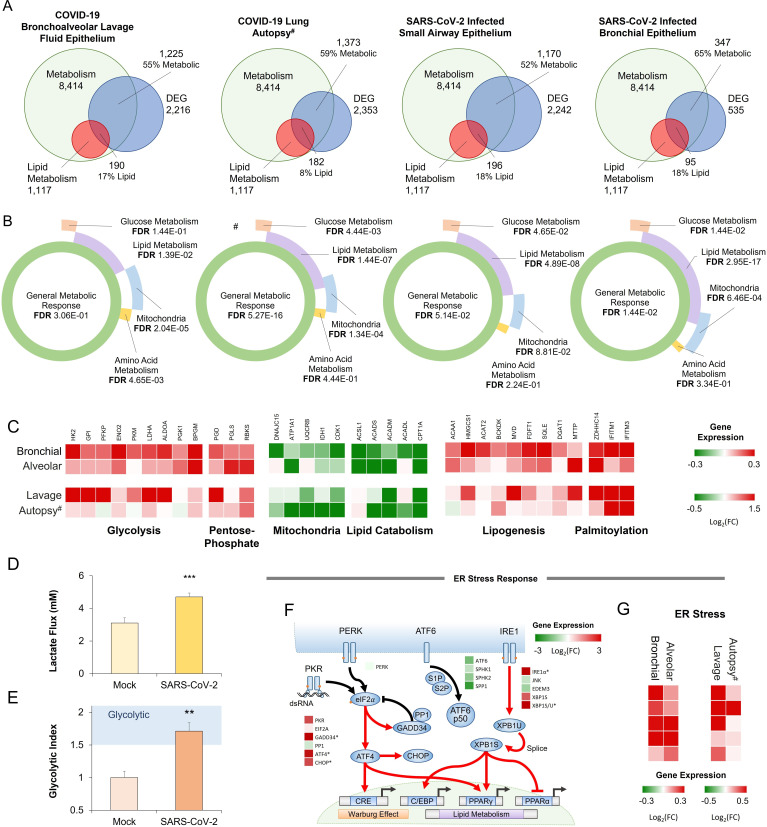
Background: Viral infection is associated with a significant rewire of the host metabolic pathways, presenting attractive metabolic targets for intervention.

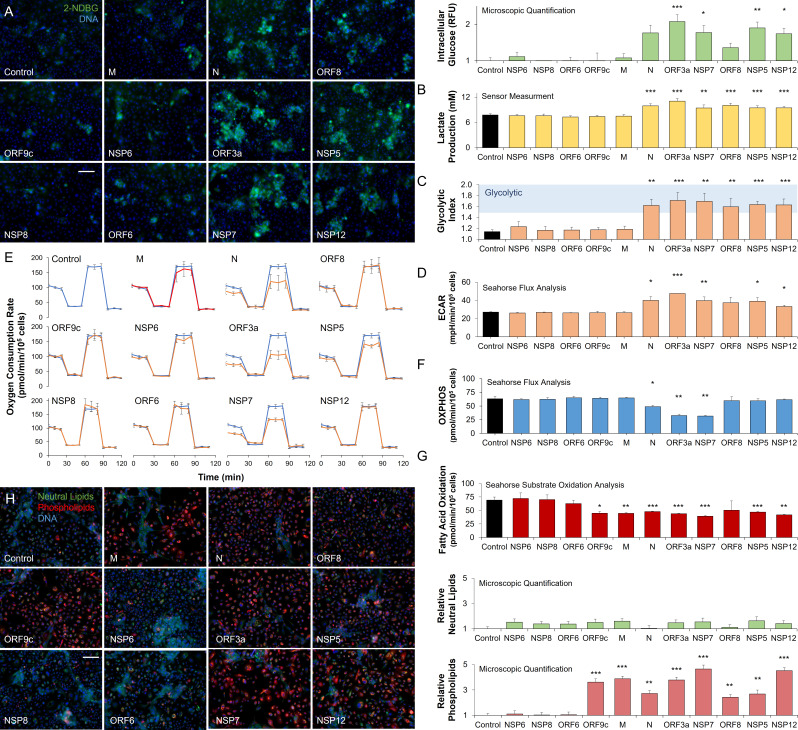
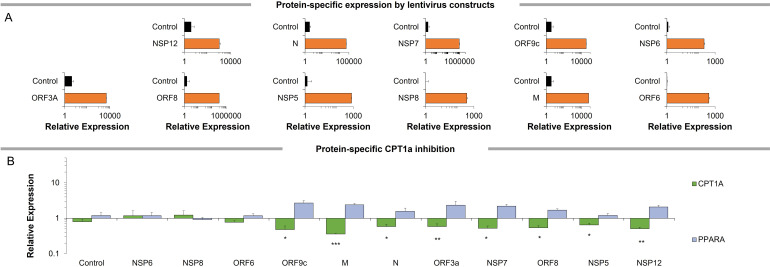
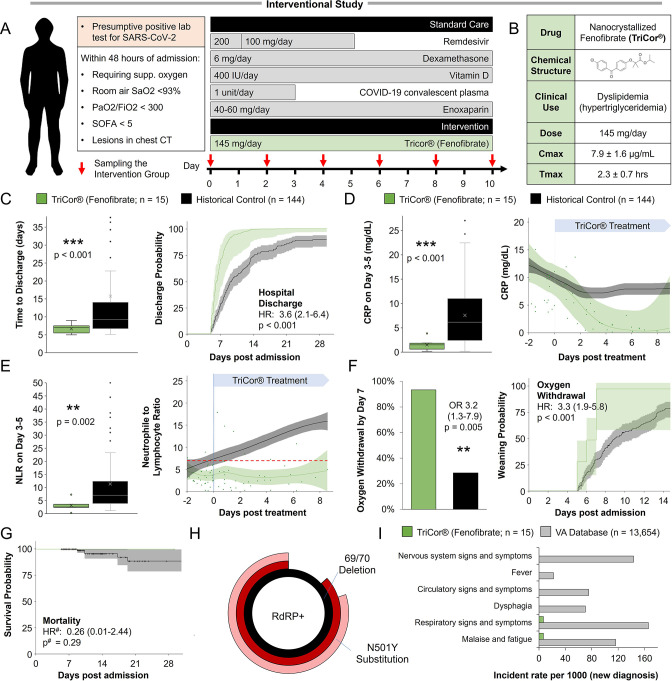
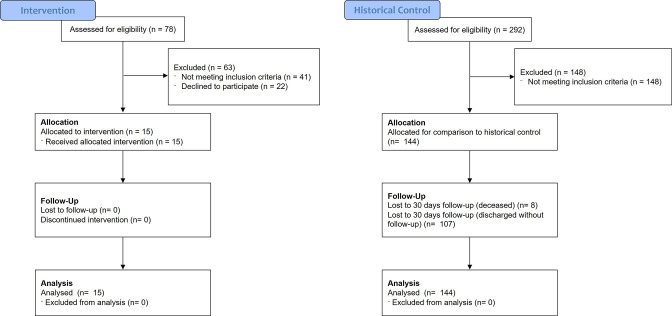
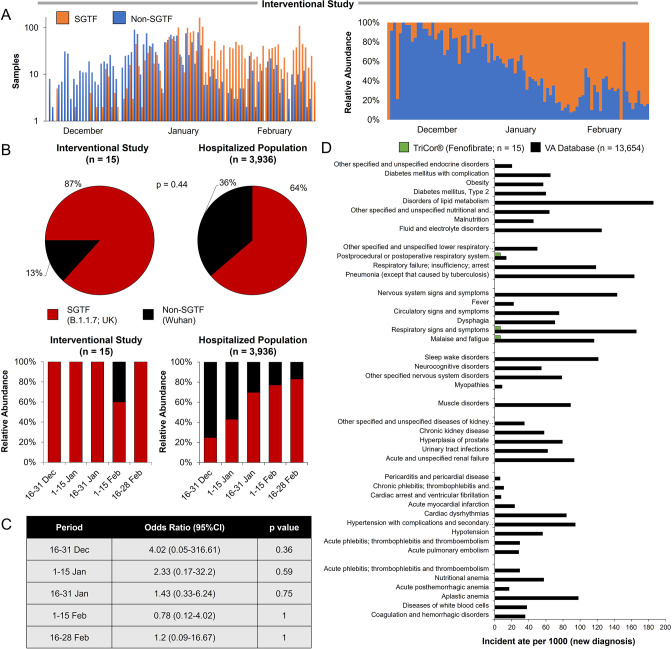
Methods: We chart the metabolic response of lung epithelial cells to SARS-CoV-2 infection in primary cultures and COVID-19 patient samples and perform in vitro metabolism-focused drug screen on primary lung epithelial cells infected with different strains of the virus. We perform observational analysis of Israeli patients hospitalized due to COVID-19 and comparative epidemiological analysis from cohorts in Italy and the Veteran's Health Administration in the United States. In addition, we perform a prospective non-randomized interventional open-label study in which 15 patients hospitalized with severe COVID-19 were given 145 mg/day of nanocrystallized fenofibrate added to the standard of care.

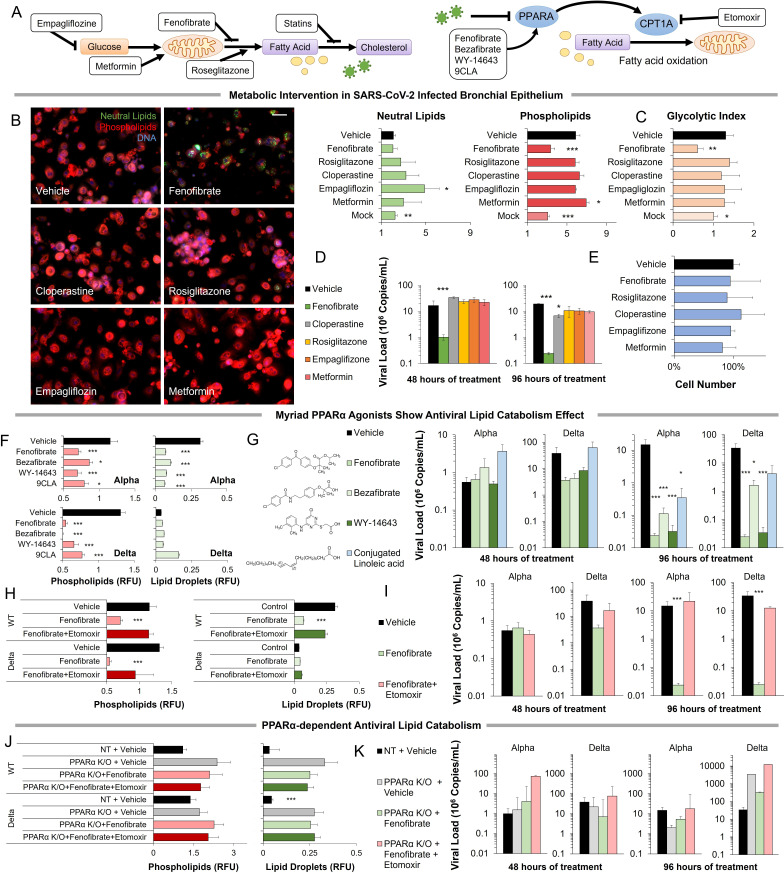
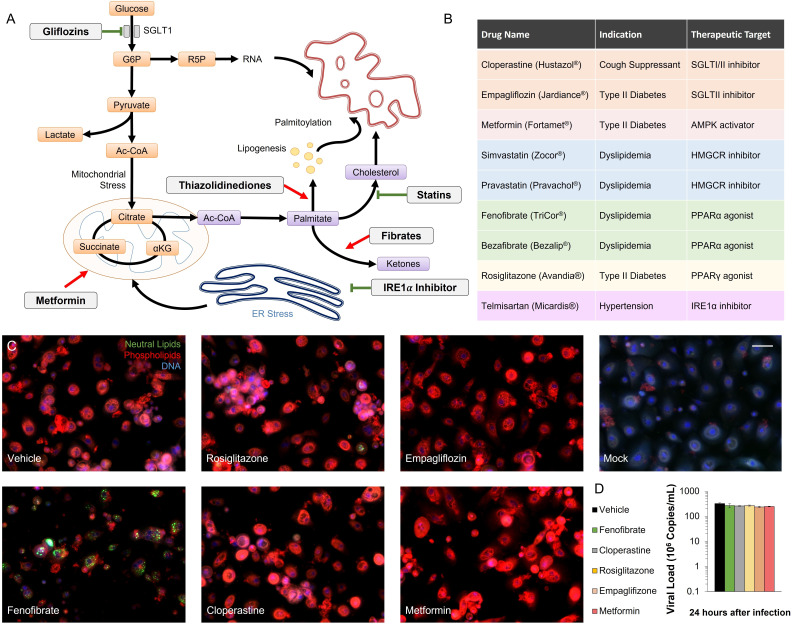
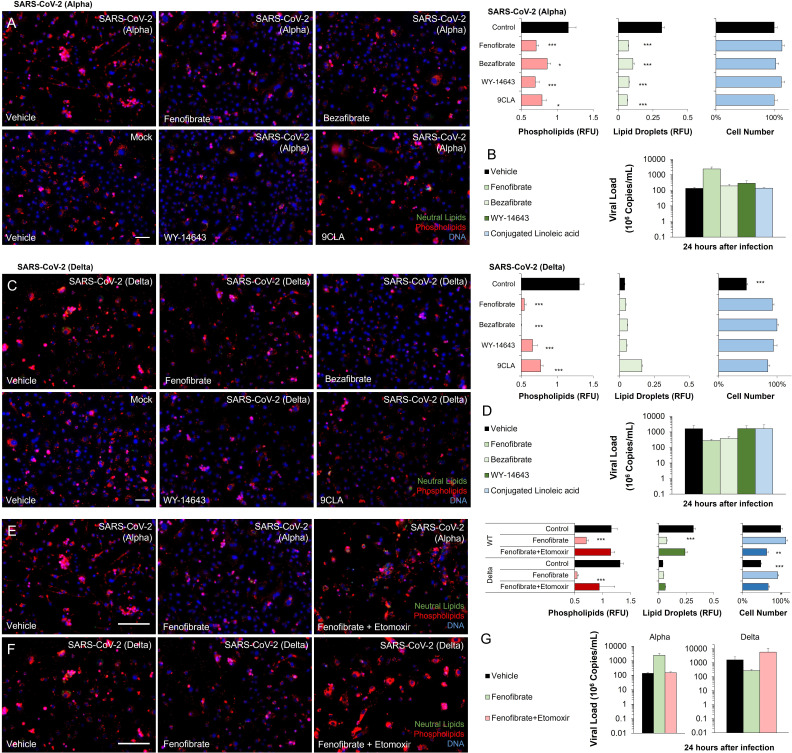
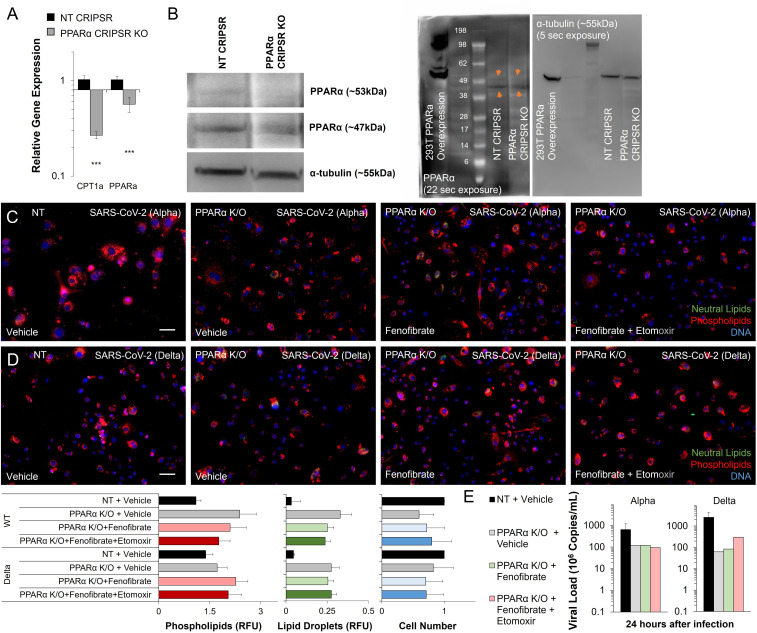
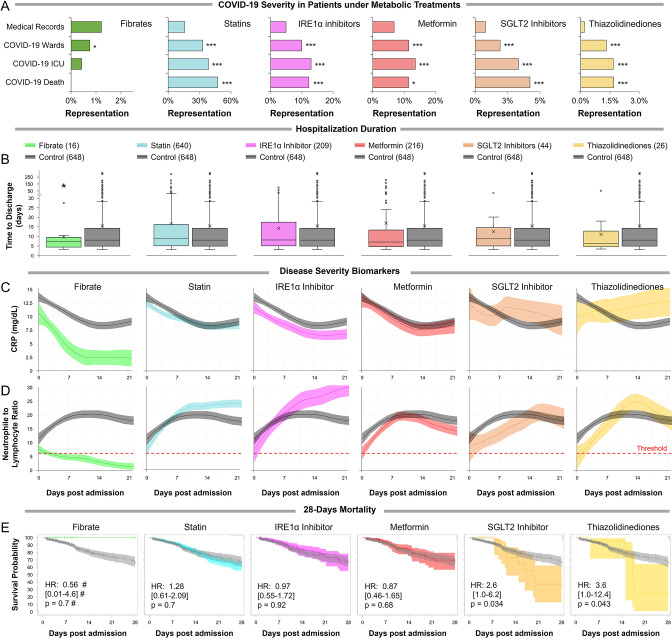
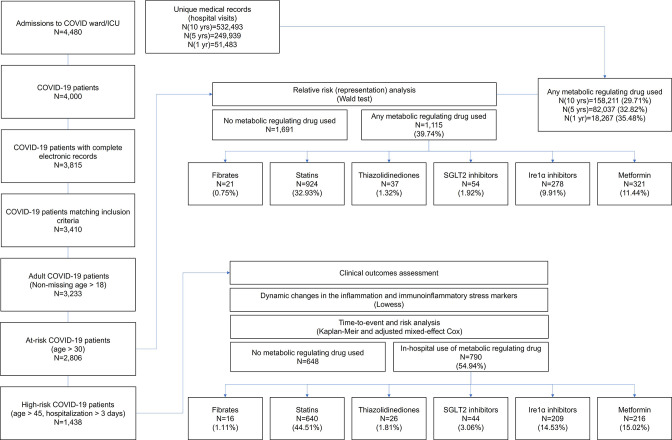
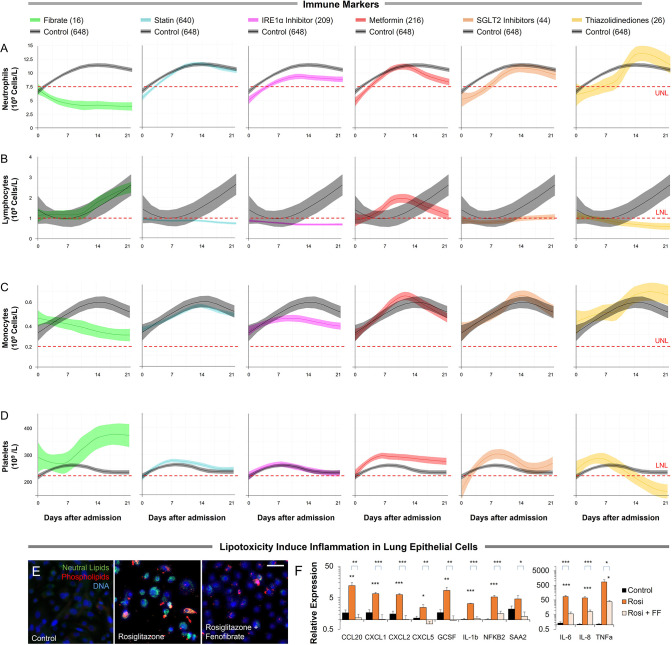
Results: SARS-CoV-2 infection produced transcriptional changes associated with increased glycolysis and lipid accumulation. Metabolism-focused drug screen showed that fenofibrate reversed lipid accumulation and blocked SARS-CoV-2 replication through a PPARα-dependent mechanism in both alpha and delta variants. Analysis of 3233 Israeli patients hospitalized due to COVID-19 supported in vitro findings. Patients taking fibrates showed significantly lower markers of immunoinflammation and faster recovery. Additional corroboration was received by comparative epidemiological analysis from cohorts in Europe and the United States. A subsequent prospective non-randomized interventional open-label study was carried out on 15 patients hospitalized with severe COVID-19. The patients were treated with 145 mg/day of nanocrystallized fenofibrate in addition to standard-of-care. Patients receiving fenofibrate demonstrated a rapid reduction in inflammation and a significantly faster recovery compared to patients admitted during the same period.

Conclusions: Taken together, our data suggest that pharmacological modulation of PPARα should be strongly considered as a potential therapeutic approach for SARS-CoV-2 infection and emphasizes the need to complete the study of fenofibrate in large randomized controlled clinical trials.

Funding: Funding was provided by European Research Council Consolidator Grants OCLD (project no. 681870) and generous gifts from the Nikoh Foundation and the Sam and Rina Frankel Foundation (YN). The interventional study was supported by Abbott (project FENOC0003).

Clinical trial number: NCT04661930.

Keywords: COVID-19; cell biology; drug repurposing; medicine; metabolic regulation; translational research; viruses.


Conflict of interest statement

AE is registered as an investor in a PCT regarding the use of metabolic regulators for COVID. The author has a patent on the use of PPAR agonists to treat COVID. The author has no other competing interests to declare, KI, MN, IA, YD, NA, LK, NR, MH, SS, IH, CP, MC, AG, AB, MM, SM No competing interests declared, AC has received personal honoraria for statistical consultation from Recipharm, and personal honoraria for manuscript writing from both Sharper Srl and Fidia Pharmaceuticals. The author has no other competing interests to declare, CS is President of Fondazione (totally supported by family). The author has no other competing interests to declare, JC received funding from National Institutes of Health (1R01HL157108-01A1,1R01AG074989-01) . The author has no other competing interests to declare, JC has received consulting honoraria from Sanifit, Bristol Myers Squibb, Merck, Edwards Lifesciences, Bayer, JNJ, Fukuda-Denshi, NGM Bio, Mayo institute of technology and the University of Delaware, and research grants from the National Institutes of Health, Abbott, Microsoft, Fukuda-Denshi and Bristol Myers Squibb. He has received compensation from the American Heart Association and the American College of Cardiology for editorial roles, and visiting speaker honoraria from Washington University, Emory University, University of Utah, the Japanese Association for Cardiovascular Nursing and the Korean Society of Cardiology. The author is named as inventor in a University of Pennsylvania patent for the use of inorganic nitrates/nitrites for the treatment of Heart Failure and Preserved Ejection Fraction and for the use of biomarkers in heart failure with preserved ejection fraction. The author has participated on the Advisory board for Bristol-Myers Squibb Data safety monitoring board for studies by the University of Delaware and UT Southwestern, and is Vice President of North American Artery Society. The author has received research device loans from Atcor Medical, Fukuda-Denshi, Unex, Uscom, NDD Medical Technologies, Microsoft, and MicroVision Medical. The author has no other competing interests to declare, LD is affiliated with BioStats Statistical Consulting Ltd where they work as a Biostatistician. The authors has received payment for statistical work for the manuscript and consulting fees from Tissue Dynamics Ltd. The author has no other competing interests to declare, OS has received consulting honoraria from Sanofi, Roche and Neopharm, and lectures honoraria from Roche . He is the chairmen of the Israel Association for the study of the liver. The author has no other competing interests to declare, YN is registered as an investor in a PCT regarding the use of metabolic regulators for COVID and has a patent on the use of PPAR agonists to treat COVID. The author has no other competing interests to declare

Figures

Figure 1.
Figure 1.. Metabolic fingerprint of SARS-CoV-2 infection.
(A) Bubble plot visualization of GO terms enriched by SARS-CoV-2 infection. Epithelial cells were isolated by bronchoalveolar lavage from 6 severe COVID-19 patients compared to 4 healthy patients (lavage). Post-mortem lung biopsies from 2 severe COVID-19 patients compared to surgical biopsies from 2 non-COVID patients (autopsy). Culture sample groups include primary small airway epithelial cells (n=3; alveoli) and primary bronchial epithelial cells (n=3; bronchial) infected with SARS-CoV-2. Enrichment analysis shows immunoinflammatory response, cellular stress (FDR <10–22), and lipid metabolism (FDR <10–5). (B) Venn diagram describing the relationship between differentially expressed genes (DEG), metabolic genes (GO:0008152), and lipid metabolism genes (GO:0006629) in SARS-CoV-2 infection of primary bronchial epithelial cells and COVID-19 patient samples. Across all four sample groups 58 ± 3% of the differentially expressed genes were metabolism-related, with 15 ± 2% of the genes associated with lipid metabolism. (C) Schematic depicting the metabolic landscape of SARS-CoV-2 infection superimposed with a heat map of pathway-associated genes. Red and green boxes indicate gene expression changes following infection in primary bronchial epithelial cells. * marks differentially regulated genes (n=3, FDR <0.05). (D) Schematic of central carbon metabolism and lipid metabolism fluxes superimposed with flux-associated genes. Differentially expressed genes (n=3, FDR <0.01) are marked with *. Genes and associated fluxes are highlighted in red or green for up- or down-regulation, respectively. (E) Microscopic evaluation of primary bronchial epithelial cells infected with SARS-CoV-2 virus or mock control shows an 85% increase in the intracellular accumulation of fluorescent glucose analog (n=3). (F) The ratio of lactate production to glucose uptake (glycolytic index) in SARS-CoV-2 and mock-infected primary cells. Index increases from 1.0 to 1.7 out of 2.0 indicating a transition to glycolysis (i.e. Warburg effect). (G) Microscopic evaluation of primary bronchial epithelial cells infected with SARS-CoV-2 virus or mock control. Neutral lipids (triglycerides) are dyed green while phospholipids are dyed red. Image analysis shows a 23% increase in triglycerides (n=3, p<0.05) and a 41% increase in phospholipids (n=3, p<0.001) following SARS-CoV-2 infection indicating abnormal lipid accumulation in lung epithelium. * p<0.05, ** p<0.01, *** p<0.001.# indicates a small sample size. Bar = 20 µm. Error bars indicate S.E.M.
Figure 1—figure supplement 1.
Figure 1—figure supplement 1.. Metabolic signature of infection in COVID-19 patients’ samples and SARS-CoV-2 infected primary cells.
(A) Venn diagrams describing the relationship between differentially expressed genes (DEG), metabolic genes (GO:0008152), and lipid metabolism genes (GO:0006629) in COVID-19 patient sample groups including epithelial cells isolated by bronchoalveolar lavage (lavage) and post-mortem lung biopsies (autopsy), as well as primary small airway epithelial cells (alveoli) and primary bronchial epithelial cells (bronchial) infected with SARS-CoV-2. (B) Sunburst graphs showing the coverage of composite metabolic terms (Levy et al., 2016) on general metabolic response induced by SARS-CoV-2 infection. Lipid and mitochondrial metabolism dominate the transcriptional metabolic signature of infection across all four sample groups. (C) Heat map of metabolic genes (Figure 1D) across four sample groups. Red and green boxes are up and downregulated by infection, respectively. # Indicates small sample size. (D) Metabolic analysis of SARS-CoV-2 and mock-infected primary bronchial epithelial cells confirms a 50% increase (n=6, p<0.001) in lactate production 48 hr post-infection. (E) The ratio of lactate production to glucose uptake (glycolytic index) in SARS-CoV-2 and mock-infected primary cells. Index increases from 1.0 to 1.7 out of 2.0 indicating a transition to glycolysis (i.e. Warburg effect: n=6, p<0.01). (F) Schematic depicting ER stress pathways superimposed with pathway-associated genes. Red and green boxes are up and downregulated by infection, respectively. * marks differentially regulated genes (n=3, FDR <0.05). Red and green arrows schematically note interactions based on the transcriptional response. XBP1S is the IRE1 spliced form of XBP1. (G) Heat map of ER stress pathway-associated genes (Figure 1G) across four sample groups. Red and green boxes are up and downregulated by infection, respectively. * p<0.05, ** p<0.01, *** p<0.001 in a two-sided heteroscedastic student’s t-test against control.# indicates a small sample size. Bar = 20 µm. Error bars indicate S.E.M.
Figure 2.
Figure 2.. SARS-CoV-2 proteins modulate host metabolic pathways.
Analysis of primary bronchial epithelial cells expressing different SARS-CoV-2 proteins for 72 hr using multiple independent assays. (A) Microscopic analysis shows an increased abundance of fluorescent glucose analog (2-NDBG) by a small set of viral proteins. Quantification shows a significant increase in intracellular glucose in bronchial cells expressing N, ORF3a, NSP7, ORF8, NSP5, and NSP12 (n=6, p<0.05). (B) Direct sensor measurement of lactate production of bronchial epithelial cells shows significantly higher lactate production (n=6, p<0.01) in cells expressing the abovementioned protein subset. (C) The ratio of lactate production to glucose uptake (glycolytic index) in bronchial cells expressing viral proteins. Index significantly increases from 1.1 to 1.7 marking a shift to glycolysis (n=6, p<0.01) induced by the viral proteins. (D) Seahorse analysis of extracellular acidification rate (ECAR) surrogate measurement for lactate production, shows independent confirmation of increased glycolysis (n=6). (E) Seahorse mitochondrial stress analysis of bronchial cells expressing the viral proteins. Oxygen consumption rate (OCR) is shown as a function of time. Oligomycin, FCCP, and antimycin/rotenone were injected at 25, 55, and 85 min, respectively. Orange lines indicate viral protein-expressing cells (n=6). (F) Quantification of oxidative phosphorylation (OXPHOS) shows a decrease of mitochondrial function following expression of N, ORF3a, and NSP7 (n=6, p<0.05). (G) Seahorse XF long-chain fatty acid oxidation stress analysis, a surrogate measurement for lipid catabolism, shows virus protein-induced significant decrease in lipid catabolism by ORF9c, M, N, ORF3a, NSP7, ORF8, NSP5, and NSP12 (n=4, p<0.05). (H) Microscopic analysis of triglycerides (neutral lipids) and phospholipids shows a virus protein-induced perinuclear lipid accumulation. Quantification shows a significant accumulation of phospholipids in cells expressing the same panel of viral proteins that induced lipid catabolism inhibition (n=6, p<0.01). * p<0.05, ** p<0.01, *** p<0.001 in a two-sided heteroscedastic student’s t-test against control. Bar = 50 µm. Error bars indicate S.E.M.
Figure 2—figure supplement 1.
Figure 2—figure supplement 1.. Gene expression patterns of SARS-CoV-2 proteins.
(A) Gene expression analysis of SARS-CoV-2 genes in primary bronchial epithelial cells expressing different SARS-CoV-2 proteins for 72 hr (n=6). (B) Gene expression analysis of PPARα and CPT1α genes in primary bronchial epithelial cells expressing different SARS-CoV-2 proteins for 72 hr (n=6). * p<0.05, ** p<0.01, *** p<0.001 in a two-sided heteroscedastic student’s t-test against control. Error bars indicate S.E.M.
Figure 3.
Figure 3.. Metabolic intervention of SARS-CoV-2 shows the antiviral effect of PPARα activation.
(A) Left: Schematic depicting potential drug interactions with the metabolic landscape of SARS-CoV-2 infection. Right: Schematic of the relationship between PPARα and fatty acid oxidation in our model. (B) Microscopic analysis of lipid accumulation in lung cells infected by SARS-CoV-2 (USA-WA1/2020) at MOI 2 exposed to different drugs for 96 hr compared to DMSO-treated (vehicle) and mock-infected controls. Cells treated with PPARα agonist fenofibrate showed a significant decrease in phospholipid content (n=3, p<0.001). (C) Lactate over glucose ratio of SARS-CoV-2 infected primary lung cells treated with various drugs. Fenofibrate significantly reduced the lactate-to-glucose ratio by 60% (n=3; p<0.01) normalizing the metabolic shift induced by infection. (D) Quantification of SARS-CoV-2 viral RNA over treatment with a physiological concentration of various drugs or DMSO (vehicle). Treatment with 20 µM fenofibrate (Cmax) reduced SARS-CoV-2 viral load by 2-logs (n=3; p<0.001). Treatment with 10 µM cloperastine reduced viral load by 2.5–3-fold (n=3; p<0.05). (E) Cell number post-treatment was unaffected by all drugs tested. (n=3). (F) Microscopic analysis of lipid accumulation in lung cells infected by SARS-CoV-2 (hCoV-19/Israel/CVL-45526-NGS/2020) and B.1.617.2 variant of concern (hCoV-19/Israel/CVL-12806/2021) exposed to structurally different PPARα agonists for 5 days compared to DMSO-treated cells (vehicle). Cells treated with any PPARα agonists showed a significant decrease in phospholipid content in both viruses (n=6, p<0.001). (G) Quantification of SARS-CoV-2 viral RNA over treatment with a physiological concentration of various PPARα agonists or DMSO (vehicle). Treatment with 20 µM fenofibrate, 50 µM bezafibrate, or 1 µM WY-14643 reduced SARS-CoV-2 viral load by 3–5-logs (n=6; p<0.001). Treatment with 50 µM conjugated (9Z,11E)-linoleic acid and 50 µM oleic acid reduced viral load by 2.5-logs (n=6; p<0.01 in alpha variant). (H) Microscopic analysis of lipid accumulation in lung cells infected by SARS-CoV-2 and B.1.617.2 variant of concern (delta) exposed to PPARα agonist fenofibrate with 4 µM of lipid catabolism inhibitor, etomoxir (ETO) for 5 days compared to DMSO-treated (vehicle). Cells treated with fenofibrate showed a significant decrease in phospholipid content in both viruses (n=6, p<0.001). Phospholipid decrease was reversed by the addition of etomoxir. (I) Quantification of SARS-CoV-2 viral RNA exposed to the PPARα agonist fenofibrate with or without 4 µM of lipid catabolism inhibitor, etomoxir, or DMSO (vehicle). Treatment with 20 µM fenofibrate reduced SARS-CoV-2 viral load by 4–5-logs (n=6; p<0.001). Fenofibrate antiviral effect was reversed by the addition of etomoxir. (J) Microscopic analysis of lipid accumulation in PPARα or NT CRISPR-knockout lung cells (methods) infected by SARS-CoV-2 and B.1.617.2 variant of concern (delta) exposed to PPARα agonist fenofibrate with 4 µM of lipid catabolism inhibitor, etomoxir compared to DMSO-treated (vehicle). PPARα or NT CRISPR-knockout cells treated with fenofibrate did not show a decrease in phospholipid content in either virus and was unaffected by etomoxir (n=6). (K) Quantification of SARS-CoV-2 viral RNA after treatment with the PPARα agonist fenofibrate with or without 4 µM of lipid catabolism inhibitor, etomoxir, or DMSO (vehicle). Genetic inhibition of PPARα causes cells to be refractory to fenofibrate treatment and the addition of etomoxir (n=6). * p<0.05, ** p<0.01, *** p<0.001 in a two-sided heteroscedastic student’s t-test against control. Bar = 30 µm. Error bars indicate S.E.M.
Figure 3—figure supplement 1.
Figure 3—figure supplement 1.. Metabolic regulators in SARS-CoV-2 infection in vitro.
(A) Schematic depicting the metabolic landscape of SARS-CoV-2 infection. Potential drugs (white boxes) and their therapeutic targets are marked on the chart. (B) Table summarizing FDA-approved drugs that interfere with SARS-CoV-2-induced metabolic alterations. (C) Microscopic analysis of lipid accumulation and cell number in alpha variant (USA-WA1/2020) infected bronchial epithelial cells at MOI 2 after treatment with different metabolic regulators, compared to mock-infected bronchial epithelial cells. Bar = 30 µm. (D) Quantification of SARS-CoV-2 viral RNA 24 hours post-infection, prior to treatment. Analysis shows no difference in viral quantities (n = 3).
Figure 3—figure supplement 2.
Figure 3—figure supplement 2.. PPARα agonism anti-viral mechanism is ligand-wide and fatty oxidation dependent in SARS-CoV-2 infection in vitro.
(A) Microscopic analysis of lipid accumulation and cell number in alpha variant (hCoV-19/Israel/CVL-45526-NGS/2020) infected bronchial epithelial cells at TCID100 after treatment with different PPARα agonists (n=6, p<0.05). (B) Quantification of alpha variant SARS-CoV-2 viral RNA before treatment with a physiological concentration of various PPARα agonists or DMSO (vehicle; n=6). (C) Microscopic analysis of lipid accumulation and cell number in delta variant (hCoV-19/Israel/CVL-12806/2021) infected bronchial epithelial cells at TCID50 after treatment with different PPARα agonists (n=6, p<0.001). (D) Quantification of delta variant SARS-CoV-2 viral RNA before treatment with a physiological concentration of various PPARα agonists or DMSO (vehicle; n=6). (E–F) Microscopic analysis of lipid accumulation and cell number in (E) alpha variant (hCoV-19/Israel/CVL-45526-NGS/2020) infected bronchial epithelial cells at TCID50 after 5 days of treatment with 20 µM fenofibrate or 20 µM fenofibrate and 4 µM CPT1α inhibitor etomoxir (n=6, p<0.01). (F) delta variant (hCoV-19/Israel/CVL-12806/2021) infected bronchial epithelial cells at TCID50 after treatment with 20 µM fenofibrate or 20 µM fenofibrate and 4 µM CPT1α inhibitor etomoxir. (G) Quantification of alpha and delta variant SARS-CoV-2 viral RNA before treatment with 20 µM fenofibrate or 20 µM fenofibrate and 4 µM CPT1α inhibitor etomoxir (n=6). * p<0.05, ** p<0.01, *** p<0.001. Bar = 50 µm. Error bars indicate S.E.M.
Figure 3—figure supplement 3.
Figure 3—figure supplement 3.. PPARα is required for fenofibrate rescue and etomoxir reversal in SARS-CoV-2 infection in vitro.
(A) Gene expression of PPARα and CPT1α by qRT-PCR in bronchial epithelial cells or PPARα CRISPR-KO bronchial epithelial cells. Analysis shows a significant decrease in PPARα expression and its target gene CPT1α (n=6, p<0.001). (B) Western blot analysis of PPARα protein in bronchial epithelial cells or PPARα CRISPR-KO bronchial epithelial cells. Microscopic analysis of lipid accumulation and viability in (C) alpha variant (hCoV-19/Israel/CVL-45526-NGS/2020) infected PPARα K/O bronchial epithelial cells at TCID50 after 5 days of treatment with 20 µM fenofibrate or 20 µM fenofibrate and 4 µM CPT1α inhibitor etomoxir. (D) Delta (hCoV-19/Israel/CVL-12806/2021) infected PPARα K/O bronchial epithelial cells at TCID50 after 5 days of treatment with 20 µM fenofibrate or 20 µM fenofibrate and 4 µM CPT1α inhibitor etomoxir (n=6). (E) Quantification of alpha and delta variant SARS-CoV-2 viral RNA in infected PPARα K/O bronchial before treatment with 20 µM fenofibrate or 20 µM fenofibrate and 4 µM CPT1α inhibitor etomoxir (n=6). * p<0.05, ** p<0.01, *** p<0.001. Bar = 50 µm. Error bars indicate S.E.M.
Figure 4.
Figure 4.. Observational study shows differential immunoinflammatory response to metabolic intervention.
(A) Comparative representation of Israeli patients above the age of 30 taking different metabolic regulators. 532,493 unique general hospital medical records were compared with 2806 confirmed COVID-19 patients. COVID-19 patients treated with metabolic regulators were older and had a higher prevalence of chronic medical conditions and risk factors than other COVID-19 patients (Supplementary file 2). Patients taking thiazolidinediones (n=37; p<0.001), metformin (n=321; p<0.01), SGLT2 inhibitors (n=54; p<0.001), statins (n=924; p<0.001), or telmisartan (IRE1α inhibitor; n=278; p<0.001) were over-represented across all severity indicators (Supplementary file 2). Patients taking fibrates (n=21) were significantly underrepresented in hospital admissions (p=0.02) and were not over-represented in other severity indicators. * p<0.05, ** p<0.01, *** p<0.001 in a Wald test compared to the proportion of these drug users in medical records. Error bars indicate S.E.M. (B) Box and whisker plot of length of hospitalization in treatment and non-treatment groups (Control). Israeli patients taking bezafibrate or ciprofibrate (fibrates) were associated with significantly lower hospitalization duration (p=0.03). The numbers in parentheses indicate the number of patients. (C–D) Dynamic changes in the inflammation marker CRP and neutrophil-to-lymphocyte ratio (NLR) marking immunoinflammatory stress in treatment and non-treatment groups (Control) during 21-day hospitalization. The centerline shows the mean value while the 95% confidence interval is represented by the shaded region. (C) CRP levels gradually declined in the control group reaching a plateau by day 14 post-hospitalization. The fibrates group showed a significantly faster decline in inflammation, while the thiazolidinedione group showed marked elevation in CRP level above control. (D) NLR rose in the control group above normal values (dotted red line) stabilizing after 7–14 days and then declining as recovery begins. The fibrates group showed only mild stress, and maintain normal levels of NLR throughout hospitalization. Patients taking statins or IRE inhibitors showed elevated NLR post-day 10 of hospitalization. (E) Kaplan–Meier survival curves of 28 day in-hospital mortality for treatment and non-treatment groups (Control). The small group of patients taking fibrates did not report any deaths, while thiazolidinedione and SGLT2 inhibitor users had a significantly higher risk of mortality (HR: 3.6, 2.5; p=0.04, 0.03 respectively, Supplementary file 2). * p<0.05, ** p<0.01, *** p<0.001. In boxplots, x is the mean; center line is the median; box limits are 25th and 75th percentiles; whiskers extend to 1.5×the interquartile range (IQR) from the 25th and 75th percentiles; dots are outliers. # indicates that the hazard ratios were calculated using Firth’s correction for monotone likelihood with profile likelihood confidence limits.
Figure 4—figure supplement 1.
Figure 4—figure supplement 1.. Observational study flow diagram.
Figure 4—figure supplement 2.
Figure 4—figure supplement 2.. The host-immune response in hospitalized COVID-19 patients in different metabolic interventions.
(A–D) Dynamic changes in (A) neutrophils, (B) lymphocytes, (C) monocytes, and (D) platelet levels during 21 day hospitalization in treatment and non-treatment groups (Control). The centerline shows the mean value while the 95% confidence interval is represented by the shaded region. (E) Microscopic analysis of lipid accumulation in lung cells induced by 10 µM of PPARγ agonist rosiglitazone and 100 µM oleic acid with or without 20 µM fenofibrate for 5 days. Lipogenic induction resulted in a 65% increase in triglycerides (n=6, p<0.05) and a 75% increase in phospholipids (n=6, p<0.001). Lipid increase in lung cells is reversed upon treatment with fenofibrate. (F) Analysis of CCL20, CXCL1, CXCL2, CXCL5, GCSF, IL-1b, IL-6, IL-8, NFKB, SAA2, and TNFα by qRT-PCR as markers of immunoinflammatory stress. Lipogenic induction results in significant upregulation of chemokines, cytokines, and inflammation markers, which is reversed by fenofibrate (n=6, p<0.05). * p<0.05, ** p<0.01, *** p<0.001 in a two-sided heteroscedastic student’s t-test against control. Bar = 30 µm. Error bars indicate S.E.M.
Figure 5.
Figure 5.. Inflammation and speed recovery in severe COVID-19 patients treated with standard-of-care plus nanocrystallized fenofibrate.
(A) Schematic depicting interventional study design in 15 severe hospitalized COVID-19 patients receiving remdesivir, dexamethasone, and enoxaparin. Patients received 145 mg/day of nanocrystallized fenofibrate for 10 days with blood samples taken every 48–72 hr until discharge (methods). (B) Chemical, clinical, and pharmacokinetic characteristics of nanocrystallized fenofibrate. Lower Tmax compared to other fibrates enables rapid intervention in deteriorating COVID-19 patients. (C) Box and whisker plot of hospitalization duration (left) and Cox accumulative estimated hospital time to discharge by day 28 analysis, plotted as 1 minus the Cox estimator (right). Patients treated with nanocrystallized fenofibrate had a significantly lower hospitalization duration (n=15, p<0.001), and a higher likelihood of discharge (HR: 3.6, 95% CI 2.1–6.4, n=15, p<0.001). (D–E) Dynamic changes (right) and box and whisker plots (left) of immunoinflammatory indicators C-reactive protein (CRP) and neutrophil-to-lymphocyte ratio (NLR) in treatment and non-treatment groups (Control) over hospitalization duration (methods). The centerline shows the mean value while the 95% confidence interval is shaded. (D) High CRP levels gradually declined in the control group reaching a plateau by day 7. Nanocrystallized fenofibrate-treated patients showed a faster decline in inflammation, resulting in significantly lower CRP levels 3–5 days post-treatment (n=15, p<0.001). (E) NLR in the control group increased during hospitalization indicating severe immunoinflammatory stress. Patients treated with nanocrystallized fenofibrate showed no increase in NLR, suggesting minimal immune response, resulting in a significantly lower NLR 3–5 days post-treatment (n=15; p=0.002). (F) Withdrawal from oxygen support plotted as cumulative incidence at day 7 (left; OR: 3.2, 95% CI 1.3–7.9, n=15, p=0.005) Kaplan-Meier estimated time to discharge by day 28, plotted as 1 minus the survival estimator (right; HR: 2.9, 95% CI 1.7–5.0, n=15, p<0.001). (G) Kaplan–Meier survival curves of 28 days mortality in treatment and non-treatment groups (Control) and Cox regression modeling presenting hazard ratio estimate, 95% CI, and p-value. (H) Novaplex SARS-CoV-2 qPCR variant analysis (methods), showing a dominant presence of 69/70 deletion and N501Y substitution mutation correlating to the B.1.1.7 (UK) variant of the virus in the patient population. (I) Assessment of significant post-acute incident diagnoses in people who had been hospitalized with COVID-19 (long COVID) in patients taken from Al-Aly and colleagues (Al-Aly et al., 2021) compared to those treated with 145 mg fenofibrate in this study at 6 months after hospital discharge. Incident rate (IR) per 1000 at 6 months in hospitalized COVID-19 was ascertained from day 30 after hospital admission until 6 months or end of follow-up. For each outcome, cohort participants without a history of the outcome in the past year were included in the analysis. Hazard ratios (HR) and the related p-values were calculated by a Cox regression model. Odds ratios (ORs) and the related p-values were calculated using Fisher’s exact test (methods). * p<0.05, ** p<.0.01, *** p<0.001. In boxplots, x is the mean; center line is the median; box limits are the 25th and 75th percentiles; whiskers extend to 1.5×the interquartile range (IQR) from the 25th and 75th percentiles; dots are outliers. # indicates that the hazard ratios were calculated using Firth’s correction for monotone likelihood with profile likelihood confidence limits.
Figure 5—figure supplement 1.
Figure 5—figure supplement 1.. Interventional study CONSORT flow diagram.
Figure 5—figure supplement 2.
Figure 5—figure supplement 2.. Analysis of variant emergence dynamics and distribution during the study period in participants and other hospitalized patients.
(A) Sample distribution (left) and relative abundance (left), with and without SGTF by day from 30 November 2020 to 28 February 2021. (B) Stratified relative abundance of samples with and without SGTF of patients in the interventional study (left) and other hospitalized patients (right) from 16 December 2020 to 28 February 2021. (C) Pie chart representation of variant distribution between the patient in the interventional study and other patients in other clinical centers in Israel during the same period (OR: 1.36, 0.59–3.1; p=0.44). SGTF, S-gene target failure, serves as a proxy for identifying B.1.1.7 cases (Brown et al., 2021; Davies et al., 2021a). (D) Distribution comparison of sample distribution with and without SGTF in stratified periods. Odds ratios (ORs) and the related p-values were calculated using Fisher’s exact test (methods). SGTF, S-gene target failure, serves as a proxy for identifying B.1.1.7 cases (Brown et al., 2021; Davies et al., 2021a). (E) Assessment of significant post-acute incident diagnoses in people who had been hospitalized with COVID-19 (long COVID) in patients registered in the VA database (Al-Aly et al., 2021) vs. those treated with 145 mg fenofibrate in this study at 6 months after hospital discharge. Incident rates per 1000 at 6 months in hospitalized COVID-19 were ascertained from day 30 after hospital admission until 6 months or end of follow-up. A p-value less than 0.001 was considered statistically significant and included in the analysis. For each outcome, cohort participants without a history of the outcome in the past year were included in the analysis.

Similar articles

Cited by

References

    1. Ahmadian M, Suh JM, Hah N, Liddle C, Atkins AR, Downes M, Evans RM. Pparγ signaling and metabolism: the good, the bad and the future. Nature Medicine. 2013;19:557–566. doi: 10.1038/nm.3159. - DOI - PMC - PubMed
    1. Ajaz S, McPhail MJ, Singh KK, Mujib S, Trovato FM, Napoli S, Agarwal K. Mitochondrial metabolic manipulation by SARS-cov-2 in peripheral blood mononuclear cells of patients with COVID-19. American Journal of Physiology. Cell Physiology. 2021;320:C57–C65. doi: 10.1152/ajpcell.00426.2020. - DOI - PMC - PubMed
    1. Akter F, Mannan A, Mehedi HMH, Rob MA, Ahmed S, Salauddin A, Hossain MS, Hasan MM. Clinical characteristics and short term outcomes after recovery from COVID-19 in patients with and without diabetes in bangladesh. Diabetes & Metabolic Syndrome. 2020;14:2031–2038. doi: 10.1016/j.dsx.2020.10.016. - DOI - PMC - PubMed
    1. Al-Aly Z, Xie Y, Bowe B. High-dimensional characterization of post-acute sequelae of COVID-19. Nature. 2021;594:259–264. doi: 10.1038/s41586-021-03553-9. - DOI - PubMed
    1. Ali MS, Prieto-Alhambra D, Lopes LC, Ramos D, Bispo N, Ichihara MY, Pescarini JM, Williamson E, Fiaccone RL, Barreto ML, Smeeth L. Propensity score methods in health technology assessment: principles, extended applications, and recent advances. Frontiers in Pharmacology. 2019;10:973. doi: 10.3389/fphar.2019.00973. - DOI - PMC - PubMed

Publication types

Supplementary concepts

Associated data