. 2023 Apr 3;222(4):e202209096.
doi: 10.1083/jcb.202209096. Epub 2023 Jan 27.

Unraveling the kinetochore nanostructure in Schizosaccharomyces pombe using multi-color SMLM imaging

Affiliations

Unraveling the kinetochore nanostructure in Schizosaccharomyces pombe using multi-color SMLM imaging

David Virant et al. J Cell Biol. .

Abstract

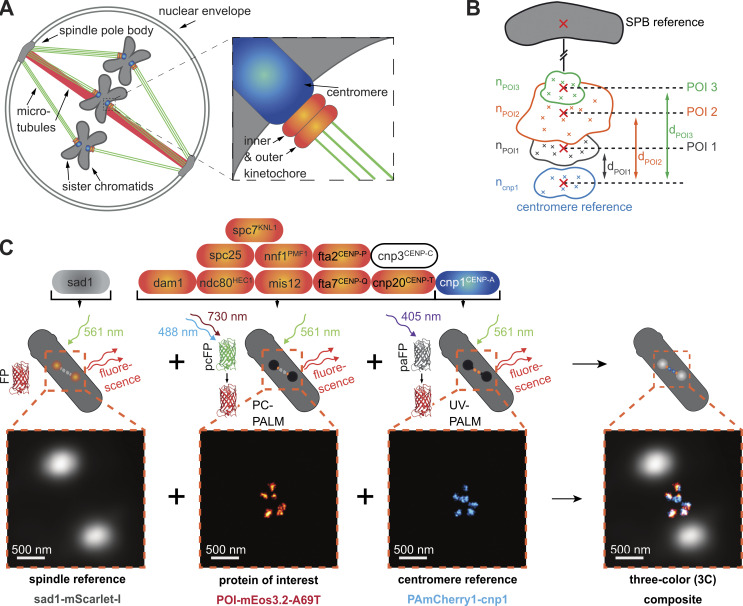
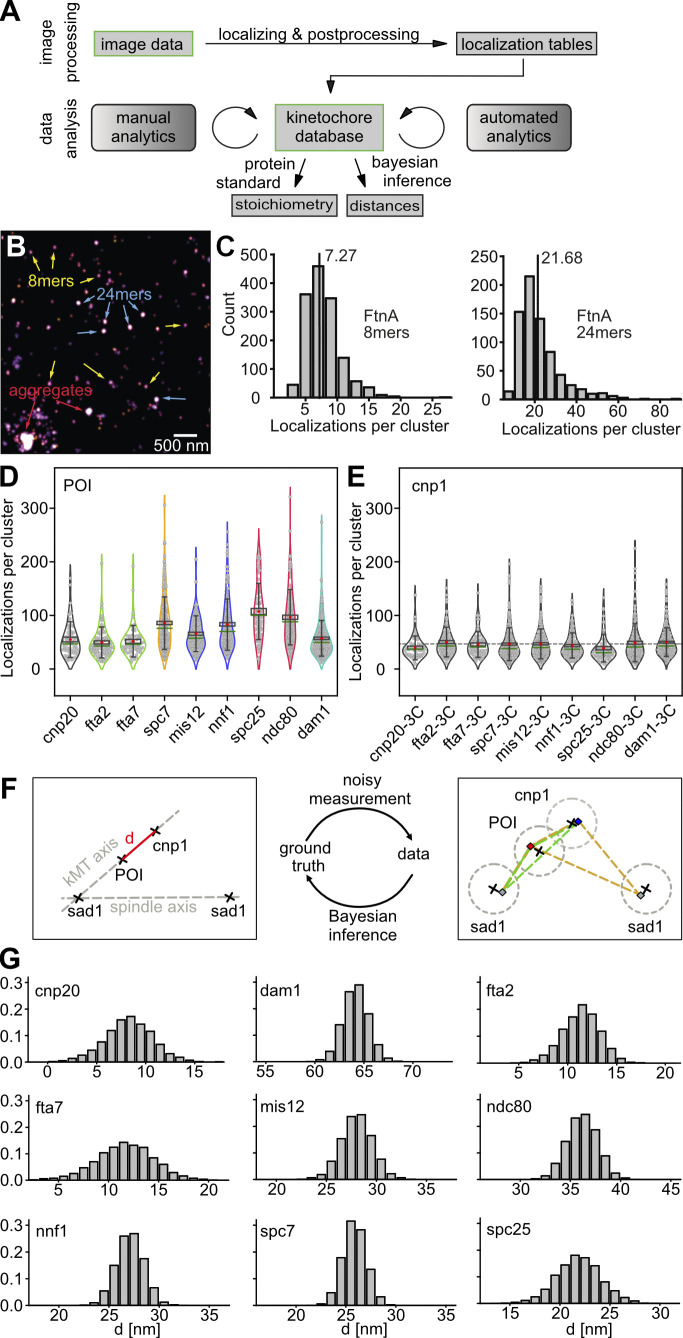
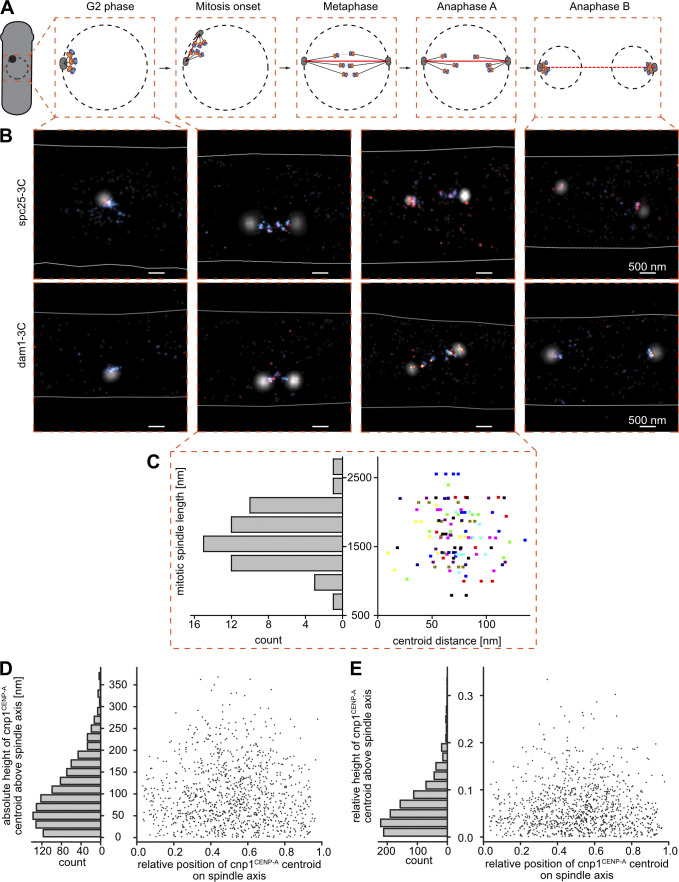
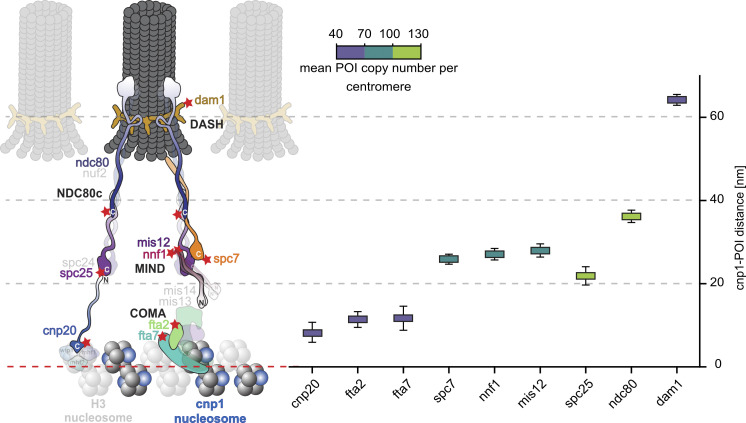
The key to ensuring proper chromosome segregation during mitosis is the kinetochore (KT), a tightly regulated multiprotein complex that links the centromeric chromatin to the spindle microtubules and as such leads the segregation process. Understanding its architecture, function, and regulation is therefore essential. However, due to its complexity and dynamics, only its individual subcomplexes could be studied in structural detail so far. In this study, we construct a nanometer-precise in situ map of the human-like regional KT of Schizosaccharomyces pombe using multi-color single-molecule localization microscopy. We measure each protein of interest (POI) in conjunction with two references, cnp1CENP-A at the centromere and sad1 at the spindle pole. This allows us to determine cell cycle and mitotic plane, and to visualize individual centromere regions separately. We determine protein distances within the complex using Bayesian inference, establish the stoichiometry of each POI and, consequently, build an in situ KT model with unprecedented precision, providing new insights into the architecture.


Conflict of interest statement

Disclosures: The authors declare no competing interests exist.

Figures

Figure 1.
Figure 1.
Imaging strategy for measuring the KT nanostructure. (A) During mitosis, the three sister chromatid pairs in S. pombe are attached to the two SPBs by tethering microtubules (green), and the SPBs are pushed apart by a bundle of spindle microtubules (red). The attachment between the centromeric region of each chromatid (blue) and the microtubules is facilitated by the KT-protein complex (orange), which consists of an inner and outer part. (B) Each POI in the KT complex can be mapped into the KT nanostructure by localizing it in relation to two references, a centromere and an SPB reference. Information about its copy number nPOI and its orientation and distance dPOI to the reference proteins is obtained. (C) Imaging strategy: First, the SPB protein sad1-mScarlet-I fusion is imaged by conventional epifluorescence microscopy to map the mitotic spindle. Then, both the POI and the centromere reference cnp1CENP-A are measured by super-resolution microscopy: Here, each POI-mEos3.2-A69T fusion (here spc7) is imaged by primed PC-PALM, followed by a readout of PAmCherry1-cnp1CENP-A fusion using UV-activation PALM (UV-PALM). Scale bar, 500 nm.
Figure S1.
Figure S1.
Developing the labeling strategy. (A) Autofluorescence of metabolites overlaps with fluorescent protein signal intensity. Exemplary images from recorded movies of S. pombe cells containing either accumulated metabolites (due to a mutation in the ade6 gene, left) or expressing fluorescent proteins (cytosolic mEos2, right) at similar imaging conditions. Cell borders are shown as dashed lines. Scale bar, 10 μm. Histograms of the intensities of individual localizations for both conditions. Localizations were filtered using a sigma of 70–200 nm. The metabolite signal strength overlaps with the fluorophore signal. Therefore, the autofluorescence noise cannot be reliably filtered from the fluorophore signal. Metabolite N = 35,509, mEos2 N = 467,680, bin size = 200 nm. (B) Dye staining in S. pombe is heterogeneous and unreliable for low copy number targets. Staining of Halo-cnp1CENP-A cells with the cyanine Alexa Fluor 647 200 nM (left), 50 nM (middle) shows a high degree of nonspecific labeling, even when using the blocking agents BSA and Image-IT (which reduce nonspecific interactions of the charged dye with the sample). Staining with 200 nM (right) of cyanine CF680 shows low labeling efficiency even after cell wall and membrane were partially digested with zymolyase and Triton-X100. We attribute the low efficiency to its large molecular weight (CF680 is about 2.3 times larger than Alexa Fluor 680 as it has masking groups to avoid nonspecific staining due to charges). (C) Exemplary cell showing high unspecific staining of CF647-Halo-cnp1CENP-A in brightlight (left), conventional fluorescence (middle), and SMLM imaging (right). Detailed views illustrating inset with the cnp1CENP-A signal (green border) compared to some nonspecific signal (inset with blue border). (D) Exemplary cell with low, nonspecific staining of CF647-Halo-cnp1CENP-A at a high labeling efficiency.
Figure 2.
Figure 2.
Data analysis. (A) Schematic representation of the data analysis pipeline. In the image processing part, image data from SMLM experiments are localized and post-processed (for quality, drift, etc.). The resulting localization tables are added to a KT database, which is then used as a backend for several manual analysis (visual selection and classification steps) and automated analysis steps (channel alignment and filtering). From the database, all measures can be extracted. Here, we used localization counts per cluster and protein cluster distances to determine protein stoichiometry using a protein standard calibration and POI-cnp1CENP-A distances using Bayesian inference. (B) Using E. coli ferritin FtnA as a counting standard to calibrate POI copy numbers. Reconstructed SMLM image of isolated mEos3.2-A69T-FtnA oligomers. In our exemplary sample image, all assembly intermediates (monomers, dimers, 8mers) as well as final 24mers and some aggregates can be seen (exemplary 8mers, 24mers, and aggregates are highlighted with colored arrows). Scale bar, 500 nm. (C) Histograms of localization counts per selected 8mer (left) and 24mer (right) cluster. Using the mean (dashed lines) of 7.27 ± 2.72 for 8mers and 21.68 ± 10.28 for 24mers, we determined a calibration factor of 0.9. N = 1,458 (8mers) and N = 725 (24mers). (D) POI numbers and robustness of the method. Localizations per POI cluster. POIs from the same subcomplex are shown in the same colors (COMAc [green]: fta2CENP-P, fta7CENP-Q; MINDc [blue]: mis12, nnf1PMF1; NDC80c [red]: spc25, ndc80HEC1). The red dot indicates the mean, the green line indicates the median, the black box indicates the SEM, and the whiskers indicate the STD. N = 57 for cnp20CENP-T, 87 for fta2CENP-P, 61 for fta7CENP-Q, 86 for spc7KNL1, 136 for mis12, 217 for nnf1PMF1, 86 for spc25, 172 for ndc80HEC1, 232 for dam1. (E) Distributions of localizations per cnp1CENP-A cluster are robust across different POI-3C measurements. The gray dotted line indicates the mean of all cnp1CENP-A clusters for reference. N = 55 for cnp20CENP-T-3C, 96 for fta2CENP-P-3C, 68 for fta7CENP-Q-3C, 239 for spc7KNL1-3C, 197 for nnf1PMF1-3C, 122 for mis12-3C, 68 for spc25-3C, 161 for ndc80HEC1-3C, 239 for dam1-3C. (F) Bayesian model to estimate inner-KT distances. Schematic of our Bayesian model. To determine the real distance (marked in red) between cnp1CENP-A and each POI from the measured centers of their respective clusters, we assumed Gaussian measurement errors of uncertain size (dotted gray circles, right). To be able to disentangle the contribution of errors and real distance in the measured data, we took the position of the associated spindle pole into account, as the centroids of sad1, POI, and cnp1CENP-A clusters can be assumed to lie on a straight line (kMT axis, left). The sad1 cluster closest to a KT is not necessarily the pole to which the KT is attached to. Thus, we built a mixture model to take both possibilities into account. For each KT pair, we thus obtained two options to check, marked by the green and orange triangle, right. (G) The posterior density of cnp1CENP-A-POI distances for each POI measured in this study was approximated using Hamiltonian Monte Carlo (see Materials and methods). Number of centromeres used for distance measurement: N = 49 for cnp20CENP-T, 82 for fta2CENP-P, 58 for fta7CENP-Q, 215 for spc7KNL1, 161 for nnf1PMF1, 102 for mis12, 51 for spc25, 135 for ndc80HEC1, 155 for dam1. The code can be found in Data S1.
Figure S2.
Figure S2.
Cloning strategy, sample preparation, and health assessment of 3C strains. (A) Cloning strategy. DNA fragments containing the POI 3′-end (pink), the FP-resistance cassette (yellow-red-grey-green), and the POI 3′- UTR (purple) were amplified with the corresponding primers with ∼20 bp overlap to the future neighboring DNA fragments from either genomic WT DNA or a plasmid DNA. Pieces were then fused by overlap extension PCR and transformed into the dual-color reference strain (h+, leu1-32, ura4-D18, sad1:mScarlet-I:hphMX6, PAmCherry1:cnp1CENP-A) using homologous recombination to create a 3C strain library (Table S1). (B) Sample preparation. Cell cultures were synchronized using lactose gradient centrifugation, which accumulates cells in early G2 phase in an upper band. The cells were then extracted from the gradient column, grown for another 1–1.5 h until mitosis, and chemically fixed, washed, and embedded in agarose gel with fiducial markers. (C and D) Assessment of strain health & mitotic defects. Temperature (C) or TBZ (D), which induces mitotic defects by microtubule depolymerization, sensitivities between the parental WT, the dual-color reference, and the individual 3C strains were assessed by spot tests. Here, a 10-fold dilution series of OD600 from 1.0 to 0.001 of overnight cultures was grown on either YES media plates at 25, 32, and 37°C for 3 d or YES media plates containing 2.5, 5.0, 7.5, and 10.0 μg/ml TBZ and incubation at 25°C for 3 d. (E) Flow cytometry measurements to assess S. pombe strain health. FSC-W and SSC-W contour plots (each level within the contour plot consists of 10% measured cells) and their corresponding histograms of 3C (POI-3C) strains and the dual-color template strain compared to a fission yeast WT strain. A defect in cell division usually results in increased cell length and higher FSC-W and SSC-W values, which we observed for cnp3CENP-C-3C (top row, left column) but none of the other strains tested. N = 10,000 for each POI (see Materials and methods).
Figure S3.
Figure S3.
Centroid distance is independent of mitotic spindle length. (A) Scheme of the S. pombe cell cycle (from left to right): A fission yeast cell in G2 phase is drawn with a nuclear envelope (black dashed circle) and one SPB (black). Insets show the nucleus changing over the cell-cycle phases (G2, onset of mitosis, metaphase, Anaphase A, and Anaphase B) with the KT (orange) linking the centromere (blue) to the SPB through a bundle of KT microtubules (black lines), while the spindle microtubules (red line) push the two SPBs further apart. (B) Exemplary three-color SMLM images of spc25-3C (top row) and dam1-3C (bottom row) strains representing the cell-cycle stages shown in A. SPB (sad1-mScarlet-I) localizations are shown in white, KTs (POI-mEos3.2-A69T) in red, centromeres (PAmCherry1-cnp1CENP-A) in blue, and the cell border (determined by the bright light image) is drawn as a white line. Scale bar, 500 nm. (C) Left: Histogram of an exemplary dataset of mitotic spindle lengths (distance between the two SPBs during mitosis) for the POI dam1. Right: The distance between the centroids of individual KT cluster pairs (POI and cnp1CENP-A) plotted against the mitotic spindle length from the same cell. Data points of the same height and color are from the same mitotic spindle. All spindle lengths are shorter than the average nuclear diameter of 2–3 μm, thus excluding Anaphase B cells. Mitotic spindles N = 55, KT cluster pairs N = 122, bin size = 280 nm. (D and E) Angular offset of kMT and spindle axes. Plotted are relative position and height over the spindle axis (defined as sad1-sad1 centroid distance) for all measured cnp1CENP-A centroids. Height of cnp1CENP-A centroids is either plotted in absolute nanometer distances (D) to visualize that most KTs are in direct vicinity to the central bundle or normalized to the respective spindle length of the cells (E) to represent the angular distribution between the spindle and kMT axes. N = 1,099, bin size = 20 nm.
Figure 3.
Figure 3.
POI-cnp1CENP-A distances and protein stoichiometry within the KT complex. Left: Schematic of the regional S. pombe centromere with parts of the inner and outer KT. Whenever information was available, the shapes of POIs and subcomplexes are shown according to cryo-EM or x-ray crystallography data. Red stars mark the position of the C-terminal fluorescent protein marker mEos3.2-A69T. Structures drawn at 25% opacity were not investigated. Right: POI distances to the reference cnp1CENP-A and POI copy numbers per centromeric region as measured in this study. The colored boxes mark the mean and the whiskers the STD of the posterior probability density distribution for each cnp1CENP-A-POI distance (Fig. 2 G, statistics in Table 1). The color of the box represents the mean POI copy number per cluster, as indicated by the scale bar (distributions of localization counts in Fig. 2 E, statistics in Table 2).

Similar articles

Cited by

References

    1. Akamatsu, M., Lin Y., Bewersdorf J., and Pollard T.D.. 2017. Analysis of interphase node proteins in fission yeast by quantitative and superresolution fluorescence microscopy. Mol. Biol. Cell. 28:3203–3214. 10.1091/mbc.e16-07-0522 - DOI - PMC - PubMed
    1. Allshire, R.C. 1995. Elements of chromosome structure and function in fission yeast. Semin. Cell Biol. 6:55–64. 10.1016/1043-4682(95)90001-2 - DOI - PubMed
    1. Aravamudhan, P., Felzer-Kim I., Gurunathan K., and Joglekar A.P.. 2014. Assembling the protein architecture of the budding yeast kinetochore-microtubule attachment using FRET. Curr. Biol. 24:1437–1446. 10.1016/j.cub.2014.05.014 - DOI - PMC - PubMed
    1. Balinovic, A., Albrecht D., and Endesfelder U.. 2019. Spectrally red-shifted fluorescent fiducial markers for optimal drift correction in localization microscopy. J. Phys. D Appl. Phys. 52:204002. 10.1088/1361-6463/ab0862 - DOI
    1. Bell, L., Seshia A., Lando D., Laue E., Palayret M., Lee S.F., and Klenerman D.. 2014. A microfluidic device for the hydrodynamic immobilisation of living fission yeast cells for super-resolution imaging. Sens. Actuators B Chem. 192:36–41. 10.1016/j.snb.2013.10.002 - DOI - PMC - PubMed

Publication types

MeSH terms

Substances