. 2023 Jun;45(3):1687-1711.
doi: 10.1007/s11357-022-00723-z. Epub 2023 Jan 27.

Efficient representations of binarized health deficit data: the frailty index and beyond

Affiliations

Efficient representations of binarized health deficit data: the frailty index and beyond

Glen Pridham et al. Geroscience. 2023 Jun.

Abstract

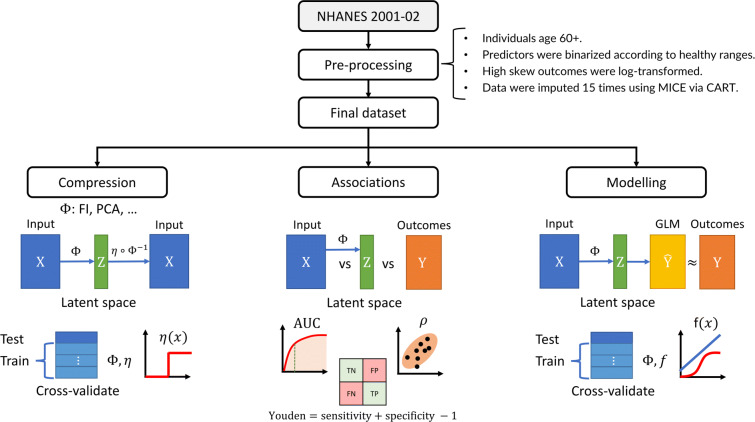
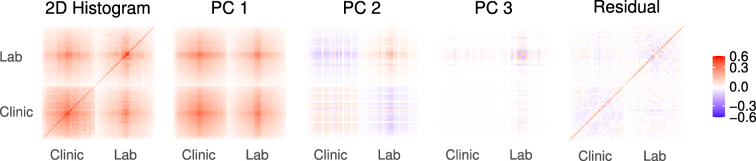
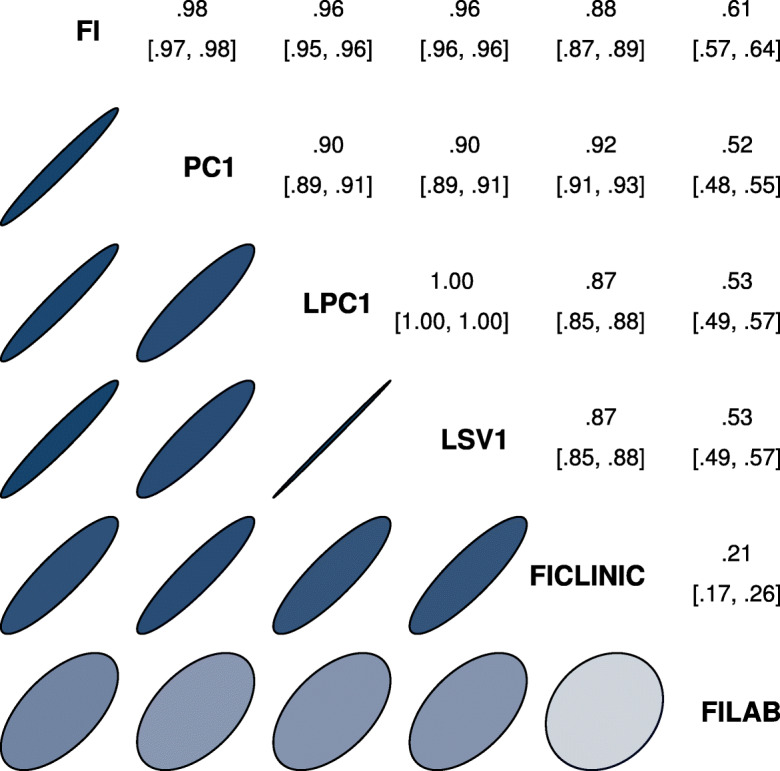
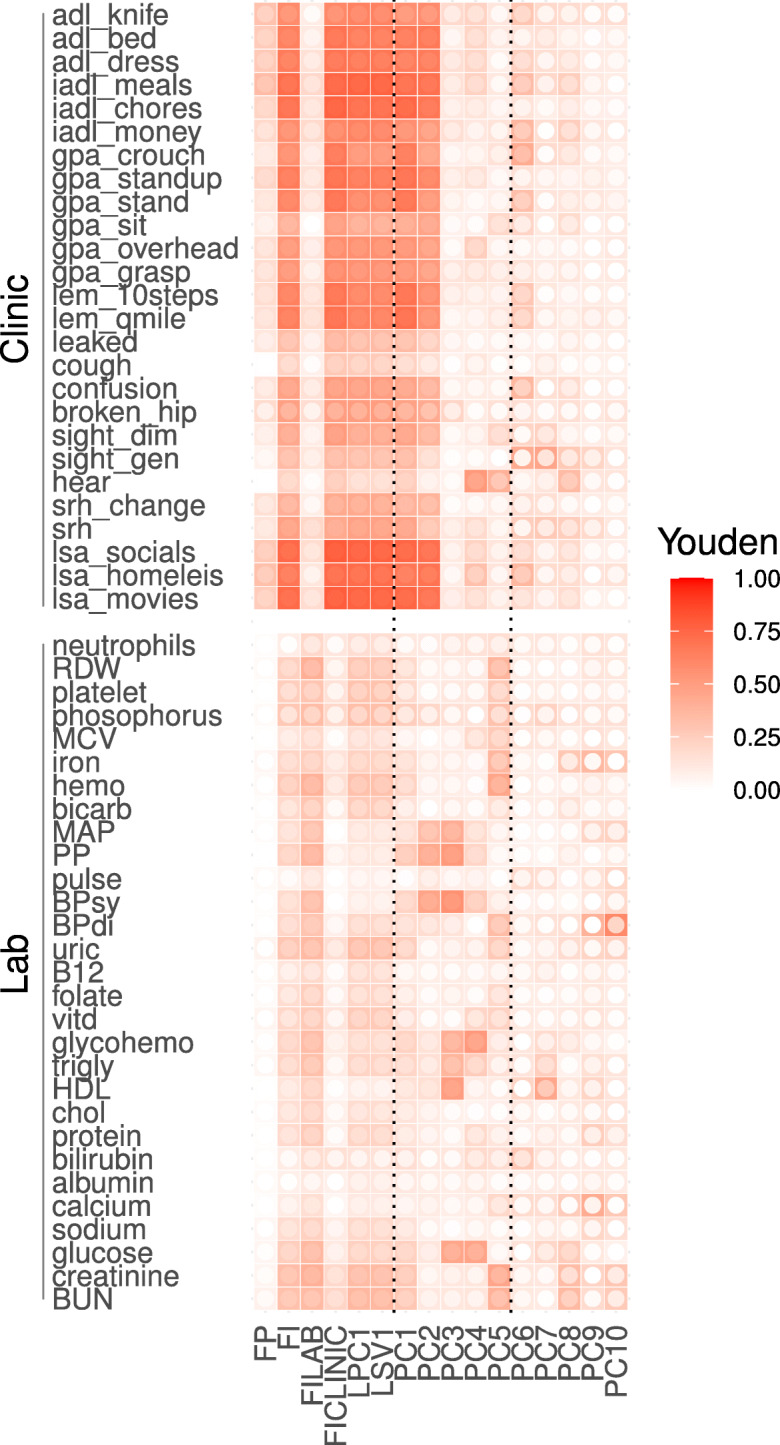
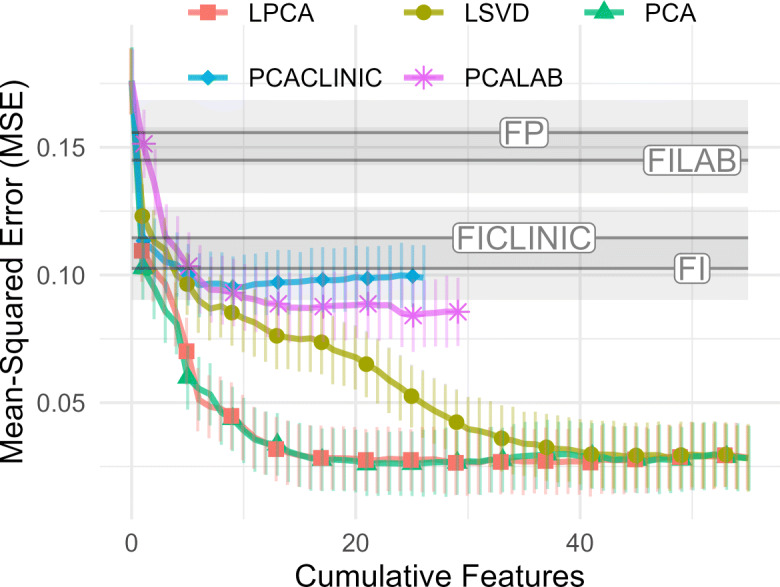
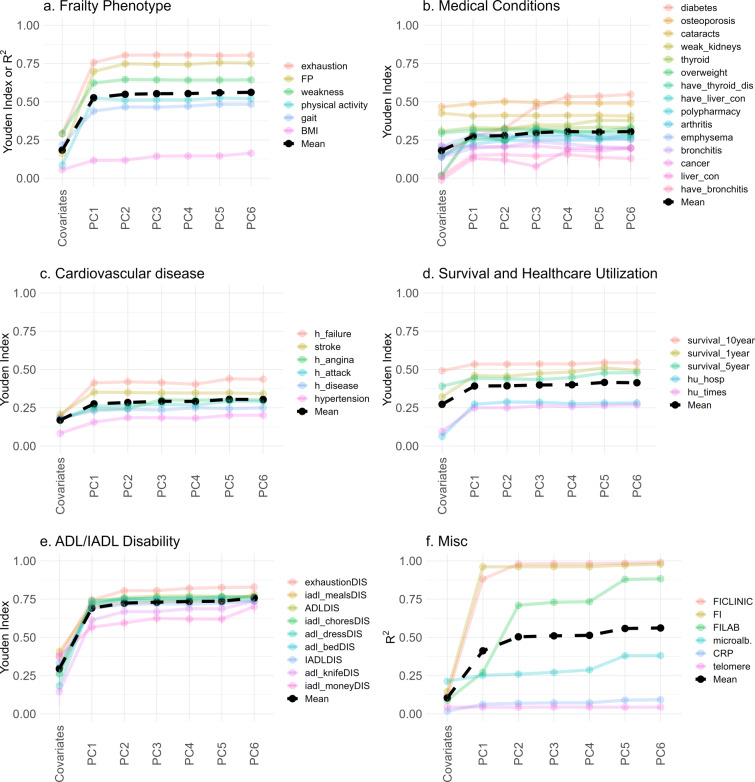
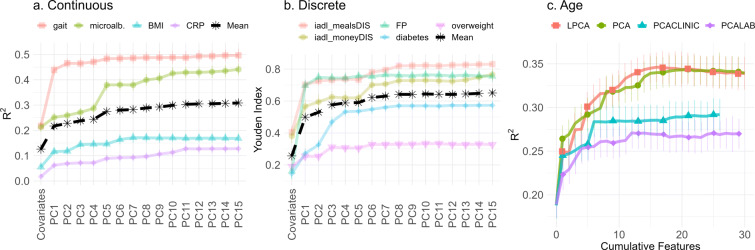
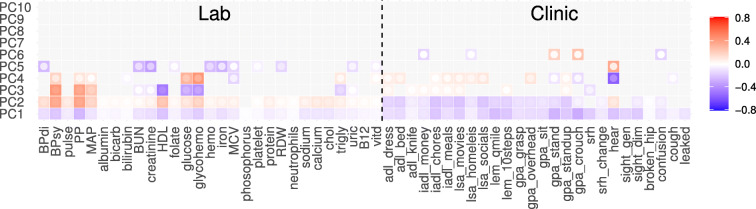
We investigated efficient representations of binarized health deficit data using the 2001-2002 National Health and Nutrition Examination Survey (NHANES). We compared the abilities of features to compress health deficit data and to predict adverse outcomes. We used principal component analysis (PCA) and several other dimensionality reduction techniques, together with several varieties of the frailty index (FI). We observed that the FI approximates the first - primary - component obtained by PCA and other compression techniques. Most adverse outcomes were well predicted using only the FI. While the FI is therefore a useful technique for compressing binary deficits into a single variable, additional dimensions were needed for high-fidelity compression of health deficit data. Moreover, some outcomes - including inflammation and metabolic dysfunction - showed high-dimensional behaviour. We generally found that clinical data were easier to compress than lab data. Our results help to explain the success of the FI as a simple dimensionality reduction technique for binary health data. We demonstrate how PCA extends the FI, providing additional health information, and allows us to explore system dimensionality and complexity. PCA is a promising tool for determining and exploring collective health features from collections of binarized biomarkers.

Keywords: Aging; Biological age; Dimensionality reduction; Frailty index; Logistic principal component analysis; Principal component analysis.


Figures

Fig. 1
Fig. 1
Study pipeline. We performed three parallel analyses: compression, feature associations, and outcome modelling. Data were preprocessed, resulting in an input matrix of health deficit data, X, and an outcome matrix of adverse outcomes, Y (rows: individuals, columns: variables). The input was transformed by a dimensionality reduction algorithm, represented by Φ, which was either the FI (frailty index), PCA (principal component analysis), LPCA (logistic PCA), or LSVD (logistic singular value decomposition). Each algorithm, Φ, generated a matrix of latent features with tunable dimension, Z (dimension: number of columns/features; the FI was not tunable). We tuned the size of this latent feature space, Z, to infer compression efficiency and the maximum dimensions of Z before features became redundant (binarizing with optimal threshold, η). The latent features were then associated with input and outcomes to infer their information content and the flow of information from input to output. The dimension of Z was then again tuned to predict the adverse outcomes. Ŷ represents the outcome estimates by the generalized linear model (GLM), which were compared to ground truth, Y, to determine the minimum dimension of Z needed to achieve optimal prediction performance for each outcome. This procedure allowed us to characterize the flow of information through each dimensionality reduction algorithm
Fig. 2
Fig. 2
Principal component analysis (PCA) of binary data is equivalent to eigen-decomposing the 2D joint deficit histogram. The first column is the complete histogram, and the remaining columns sum to the first column (Eq. A6). The first PC is clearly dominant and is dense, meaning it is nearly equal weights for each variable (akin to the FI). The eigen-decomposition naturally finds blocks of correlated variables. When it runs out of blocks, it looks for strong diagonal terms. This causes PCA to naturally block out like-variables, e.g. lab vs clinical in PC2, similar to an expert choosing to create an FI out of variables from the same domain. Values have been transformed for visualization using sign(x)|x|γ, γ = 2/3, see Fig. S16 for the figure without scaling
Fig. 3
Fig. 3
Cumulative compression. Tuning the size of the latent dimension bottleneck, we inferred the maximum number of dimensions required to efficiently represent the input data. The reader should look for two things: (1) the number of components (dimensions) needed to achieve a relatively high score, and (2) the slope of the curve — when it flattens we can expect the features are noise, variable-specific, or otherwise less important. Logistic SVD compresses the input most efficiently, saturating at around 30 features. Note the dramatic difference between lab and clinical compression both for PCA and the FI; the first PC of clinical data scores as well as 9 lab PCs. PCACLINIC and FICLINIC use only clinical variables; PCALAB and FILAB use only lab variables
Fig. 4
Fig. 4
Spearman correlation of primary features across algorithms. The first latent dimension for either PCA, LPCA, or LSVD correlated strongly with the FI and each other, and correlated more strongly with the FI CLINIC than FI LAB. This implies a strong mutual signal very close to the FI, especially the FI CLINIC. Upper triangle is correlation coefficient with 95% confidence interval. Ellipses indicate equivalent Gaussian contours [51]
Fig. 5
Fig. 5
Feature associations with individual input variables, i.e. what goes into each feature. Youden index (fill colour) quantifies strength of associations between features (x-axis) and health deficits (y-axis); 0, no association; 1, perfect. Note the similarity of the FI, FI CLINIC, LPC1, LSV1, and PC1. Inner circle fill colour is the lower limit of 95% CI (white is non-significant). Higher PCs show no/low significance
Fig. 6
Fig. 6
Feature associations with individual outcomes, i.e. what we get out of each feature. Association strength (fill colour) between features (x-axis) and adverse outcomes (y-axis); 0, no association; 1, perfect. Note the similarity of the FI, FI CLINIC, LPC1, LSV1, and PC1. Inner circle fill colour is lower limit of 95% CI (white is non-significant). Higher PCs show no/low significance. Text on right denotes accuracy metric used
Fig. 7
Fig. 7
Cumulative prediction plot for discrete outcomes (GLM). 0th dimension is demographic information. Increasing the number of features initially improves prediction but eventually it gets worse due to overfitting. LSVD performs notably worse than PCA and LPCA. Youden index: higher is better
Fig. 8
Fig. 8
Cumulative prediction plot for continuous outcomes (GLM). 0th dimension is demographic information. Increasing the number of features improves prediction monotonically. LSVD performs notably worse than PCA and LPCA. MSE is on standarized scale; therefore, R2 = 1 − MSE. MSE: lower is better
Fig. 9
Fig. 9
Improvement in predictive power as more PCs are included, grouped by outcome type (GLM). Coloured lines indicate specific outcomes, and black line indicates the mean for each group. For most outcomes, the performance stops improving after a few PCs, hence why we have truncated at PC6. The exceptions are explored in Fig. 10. Note: legend is sorted from best (top) to worse (bottom) performance of the PC6 model. See Fig. S21 for the complete plots without truncation. Subplots represent outcomes grouped by type, as indicated (“a–f”)
Fig. 10
Fig. 10
Improvement in predictive power as more PCs are included, high-dimensional outcomes (GLM). Outcomes were hand-picked variables based on requiring many PCs to achieve maximum performance. The FP was included for comparison. We tend to see continual improvement for the discrete and continuous outcomes, excluding the FP (up to 10). Age appeared to be the highest dimensional. Subplots represent high-dimensional outcomes grouped as continuous, (a), or discrete, (b) along with age as the lone outcome, (c)
Fig. 11
Fig. 11
PCA robustness. Robustness of the PCA rotation was assessed by randomly sampling which individuals to include (i.e. bootstrapping, N = 2000). Left side are lab variables; right are clinical. Inner circle fill colour is 95% CI limit closest to 0. Grayed out tiles were non-significant. The first three PCs were quantitatively robust. We see the robustness drops with increasing PC number. The global sign for each PC was mutually aligned across replicates using the Pearson correlation between individual feature scores. In Fig. S27, we assessed robustness by randomly sub-sampling input variables and again observed that PCs 1–3 were robust
Fig. 12
Fig. 12
PCA second moments (eigenvalues) with bootstrapped standard errors (N = 2000). Log-log scales. Note the bilinear structure. Banded region is optimal performance region (± 1 error bar from best using Figs. 7 and 8). In all three variable sets, eigenvalues curved away from second line just before overfitting started
Fig. 13
Fig. 13
Special joint histogram approximation (Eq. A19). Fill is the R2 fit quality for PC1 approximating the full histogram, given the histogram has the special structure given in Eq. A9. p is the number of features. a is the deficit frequency. b is the joint deficit frequency

Similar articles

Cited by

References

    1. López-Otín C, Blasco MA, Partridge L, Serrano M, Kroemer G. The hallmarks of aging. Cell. 2013;153:1194–217. doi: 10.1016/j.cell.2013.05.039. - DOI - PMC - PubMed
    1. Kennedy BK, et al. Geroscience: linking aging to chronic disease. Cell. 2014;159:709–13. doi: 10.1016/j.cell.2014.10.039. - DOI - PMC - PubMed
    1. Schmauck-Medina T, et al. New hallmarks of ageing: a 2022 Copenhagen ageing meeting summary. Aging. 2022;14:6829–39. doi: 10.18632/aging.204248. - DOI - PMC - PubMed
    1. Kojima G, Iliffe S, Walters K. Frailty index as a predictor of mortality. Syst Rev Meta-Anal Age Ageing. 2018;47:193–200. doi: 10.1093/ageing/afx162. - DOI - PubMed
    1. Dent E, Kowal P, Hoogendijk EO. Frailty measurement in research and clinical practice: a review. Eur J Intern Med. 2016;31:3–10. doi: 10.1016/j.ejim.2016.03.007. - DOI - PubMed

Publication types

LinkOut - more resources