

Ultrasonographic monitoring of feline epaxial muscle height as part of an annual wellness examination to assess for the development of sarcopenia
- PMID: 36705955
- PMCID: PMC10812043
- DOI: 10.1177/1098612X221140081
Ultrasonographic monitoring of feline epaxial muscle height as part of an annual wellness examination to assess for the development of sarcopenia
Abstract
Objectives: The aim of this study was to determine if epaxial muscle height (EMH) could be reliably incorporated into annual routine wellness screenings, and also determine its relationship to age, body condition score (BCS), subjective muscle assessment (SMA), breed and sex in mature cats.
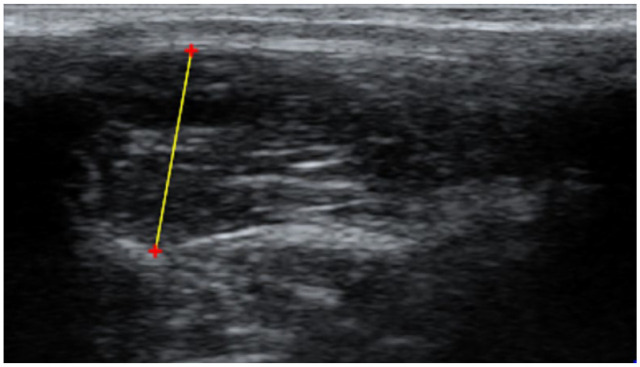
Methods: EMH was determined independently by three observers from ultrasonographic examinations - collected by an additional trained individual - of cats enrolled at the Feline Healthy Ageing Clinic, University of Liverpool, UK. Age, body weight, BCS and SMA data were also collected.
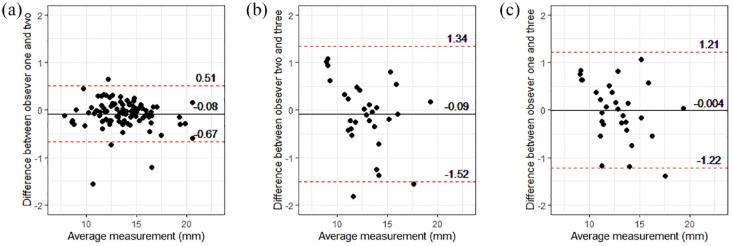
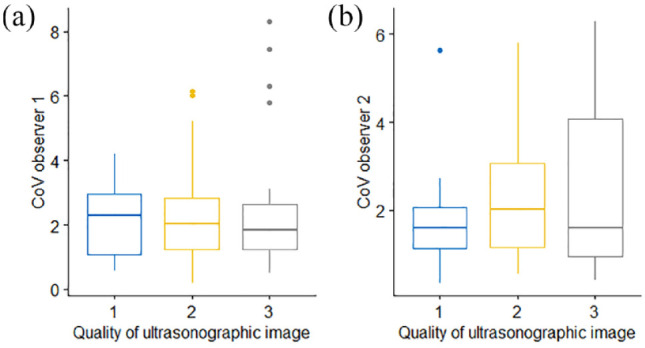
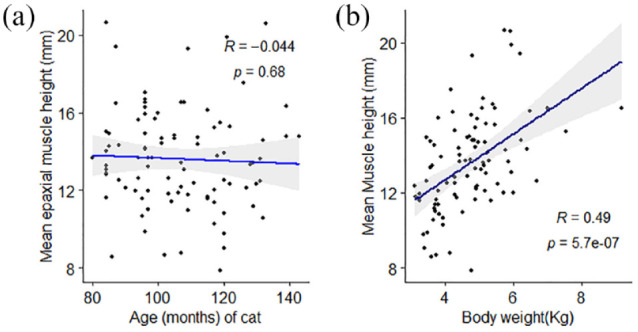
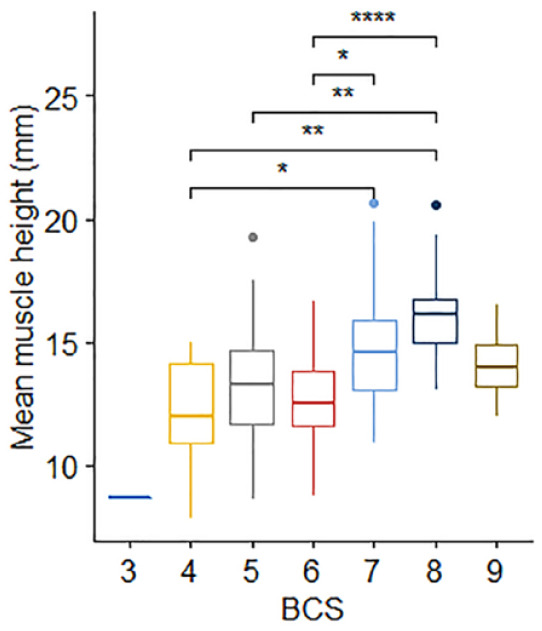
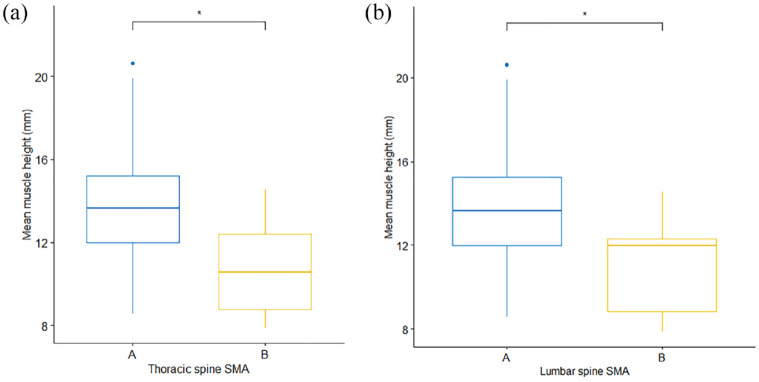
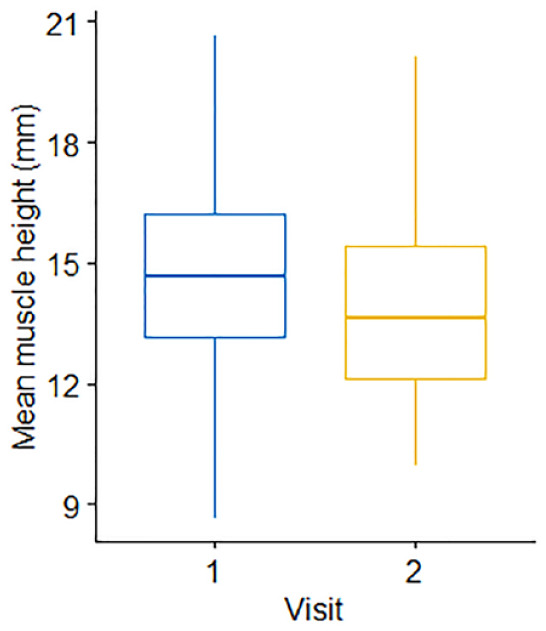
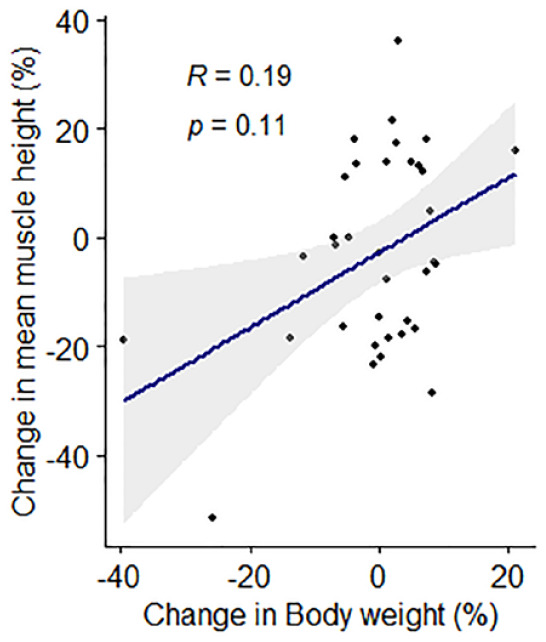
Results: A total of 92 cats were included, 35 of which had repeat ultrasonographic examinations 12 months apart. Enrolled cats were a median age of 8 years and 9 months at the time of the first measurement. Variation in the quality of ultrasonographic images collected did not affect muscle depth measurements (P = 0.974). Further, there was good intra- and inter-observer repeatability for all observations (intraclass correlation range 0.97-0.99). There was a moderate positive association between EMH and body weight (r = 0.49, P <0.001) but no association with age (r = -0.05, P = 0.680). There were also positive associations in EMH among cats with different BCSs (P = 0.001) and SMAs (thoracic spine, P = 0.021; lumbar spine, P = 0.014), but breed (P = 0.429) and sex (P = 0.187) had no effect. Finally, there was no change in EMH measurements in the paired samples (P = 0.145) or correlation between percentage weight and EMH change over 12 months.
Conclusions and relevance: The accuracy of EMH measurement using ultrasonographic imaging is good, irrespective of observer experience and provided that the ultrasonographer has some training. This suggests that ultrasonographic measurement of EMH could have a major practical impact as a non-invasive determination of muscle mass in pet cat populations. Further research is required to assess longitudinal changes in muscle mass over time in senior pet cats.
Keywords: Mature; muscle condition; muscle measurement; sarcopenia.
Conflict of interest statement
At the time the study was performed, ND was undertaking a postgraduate studentship funded by Royal Canin, a division of Mars Petcare. Since October 2020, ND has not only been employed by International Cat Care (Tisbury, Wiltshire, UK), she also holds a part-time postdoctoral research position at the Institute of Life Course and Medical Sciences, University of Liverpool, Liverpool, UK, funded by Royal Canin. AJG is an employee of the University of Liverpool whose position is currently funded by Royal Canin. AJG has also received financial remuneration and gifts for providing educational material, speaking at conferences and consultancy work. NS was undertaking an Inspire studentship funded by the Academy of Medical Sciences at the time of her involvement in the study.
Figures
Similar articles
-
Usefulness of muscle condition score and ultrasonographic measurements for assessment of muscle mass in cats with cachexia and sarcopenia.Am J Vet Res. 2020 Mar;81(3):254-259. doi: 10.2460/ajvr.81.3.254. Am J Vet Res. 2020. PMID: 32101040
-
Effect of radioiodine treatment on muscle mass in hyperthyroid cats.J Vet Intern Med. 2022 Nov;36(6):1931-1941. doi: 10.1111/jvim.16560. Epub 2022 Oct 6. J Vet Intern Med. 2022. PMID: 36200596 Free PMC article.
-
Intra- and inter-rater reliability in the cross-sectional area of feline lumbar epaxial musculature evaluated via abdominal CT scan.J Feline Med Surg. 2020 Aug;22(8):721-728. doi: 10.1177/1098612X19880997. Epub 2019 Oct 29. J Feline Med Surg. 2020. PMID: 31660772 Free PMC article.
-
Feline abdominal ultrasonography: what's normal? what's abnormal? The adrenal glands.J Feline Med Surg. 2021 Jan;23(1):33-49. doi: 10.1177/1098612X20979509. J Feline Med Surg. 2021. PMID: 33403910 Free PMC article. Review.
-
Focused Cardiac Ultrasonography in Cats.Vet Clin North Am Small Anim Pract. 2021 Nov;51(6):1183-1202. doi: 10.1016/j.cvsm.2021.07.002. Epub 2021 Aug 25. Vet Clin North Am Small Anim Pract. 2021. PMID: 34454727 Review.
Cited by
-
The potential for senotherapy as a novel approach to extend life quality in veterinary medicine.Front Vet Sci. 2024 May 15;11:1369153. doi: 10.3389/fvets.2024.1369153. eCollection 2024. Front Vet Sci. 2024. PMID: 38812556 Free PMC article. Review.
References
Publication types
MeSH terms
LinkOut - more resources
Full Text Sources
Miscellaneous
