. 2023 Jan 27;19(1):e1011101.
doi: 10.1371/journal.ppat.1011101. eCollection 2023 Jan.

A modular CRISPR screen identifies individual and combination pathways contributing to HIV-1 latency

Affiliations

A modular CRISPR screen identifies individual and combination pathways contributing to HIV-1 latency

Emily Hsieh et al. PLoS Pathog. .

Abstract

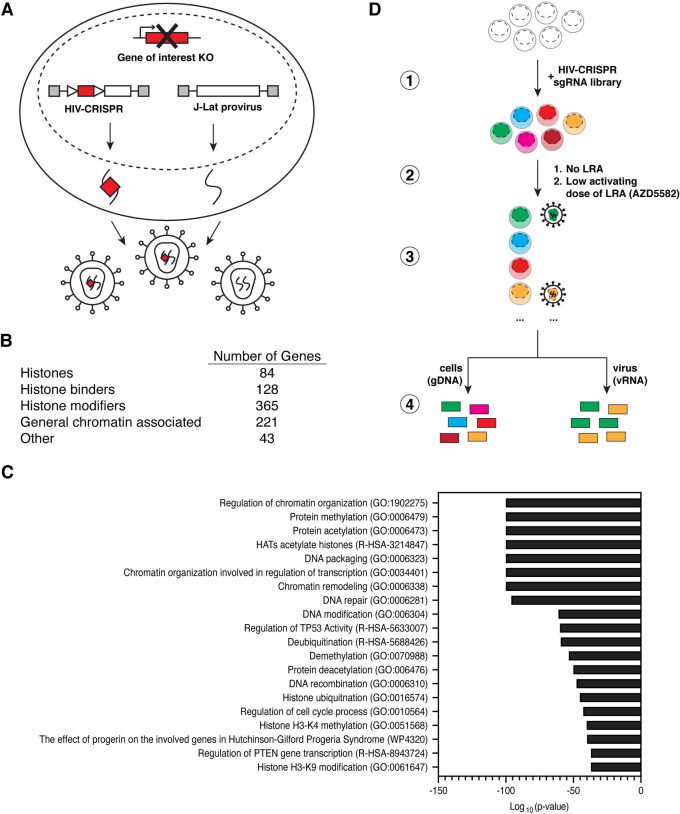
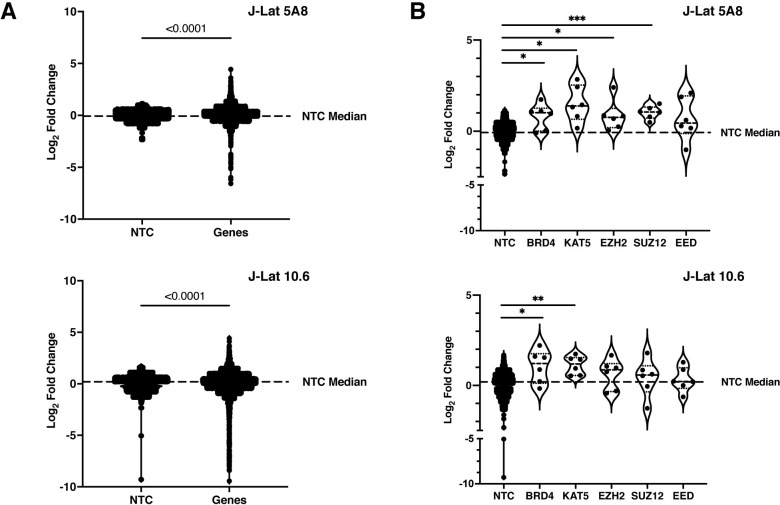
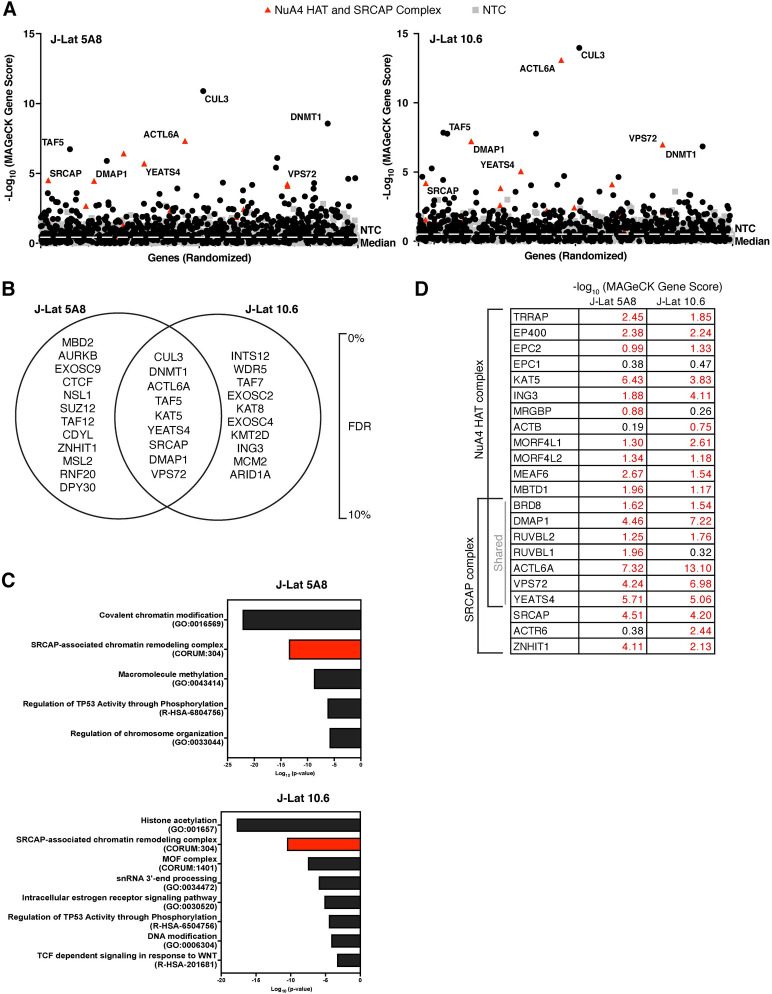
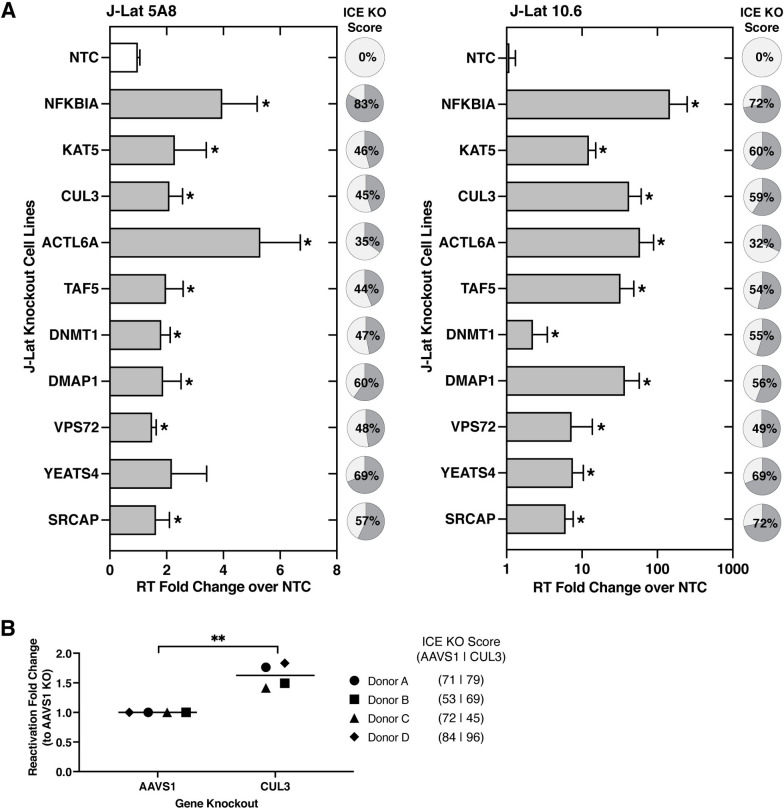
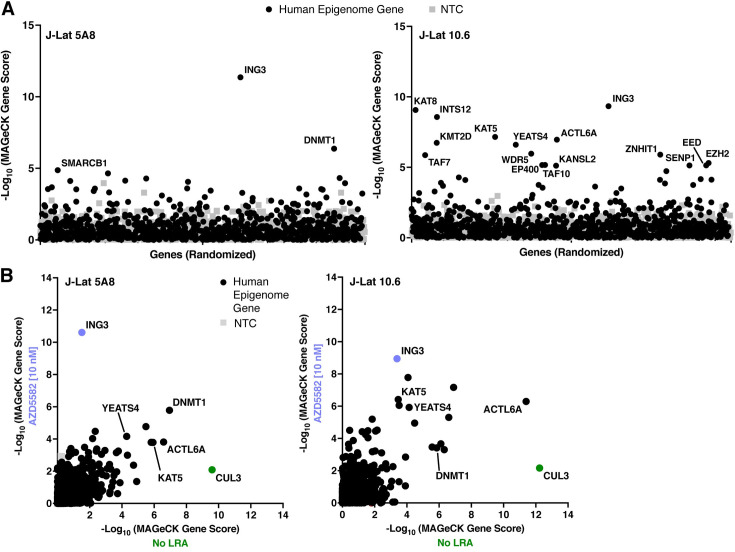
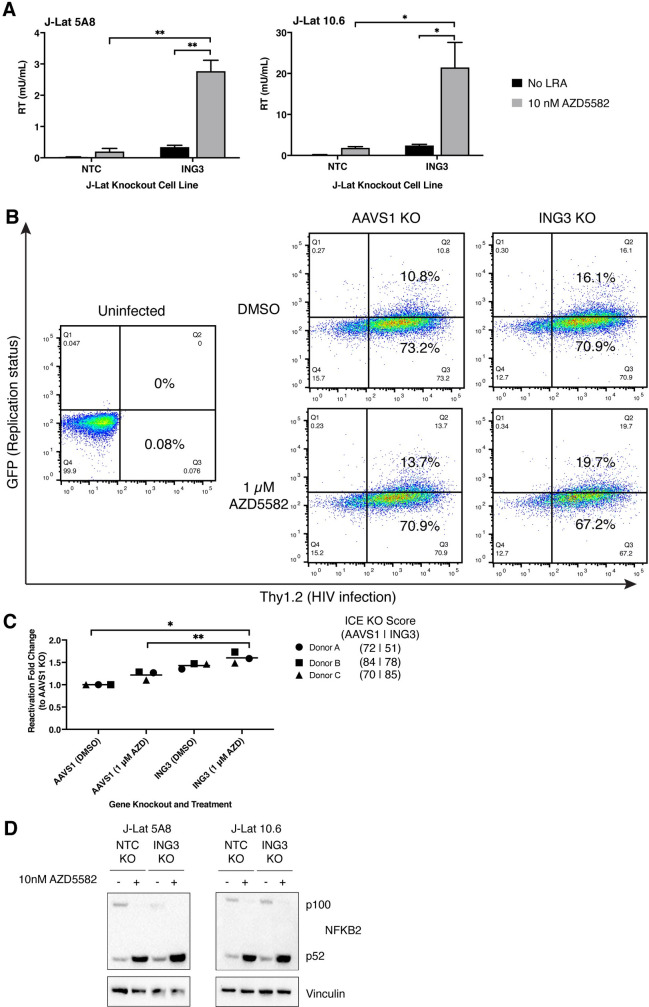
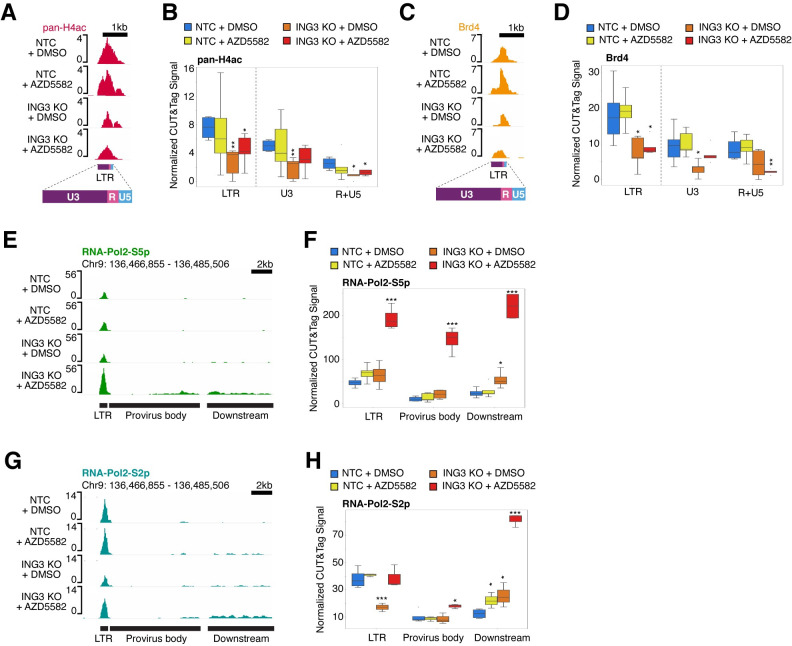
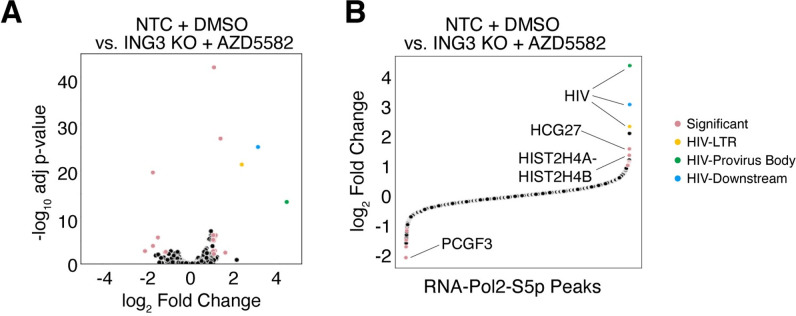
Transcriptional silencing of latent HIV-1 proviruses entails complex and overlapping mechanisms that pose a major barrier to in vivo elimination of HIV-1. We developed a new latency CRISPR screening strategy, called Latency HIV-CRISPR which uses the packaging of guideRNA-encoding lentiviral vector genomes into the supernatant of budding virions as a direct readout of factors involved in the maintenance of HIV-1 latency. We developed a custom guideRNA library targeting epigenetic regulatory genes and paired the screen with and without a latency reversal agent-AZD5582, an activator of the non-canonical NFκB pathway-to examine a combination of mechanisms controlling HIV-1 latency. A component of the Nucleosome Acetyltransferase of H4 histone acetylation (NuA4 HAT) complex, ING3, acts in concert with AZD5582 to activate proviruses in J-Lat cell lines and in a primary CD4+ T cell model of HIV-1 latency. We found that the knockout of ING3 reduces acetylation of the H4 histone tail and BRD4 occupancy on the HIV-1 LTR. However, the combination of ING3 knockout accompanied with the activation of the non-canonical NFκB pathway via AZD5582 resulted in a dramatic increase in initiation and elongation of RNA Polymerase II on the HIV-1 provirus in a manner that is nearly unique among all cellular promoters.


Conflict of interest statement

The authors have declared that no competing interests exist.

Figures

Fig 1
Fig 1. The Latency HIV-CRISPR screen.
(A) Schematic summarizing the Latency HIV-CRISPR screen in J-Lat cell lines showing the latent, integrated provirus and the HIV-CRISPR vector which delivers Cas9 and a sgRNA and produces a packageable genomic RNA. Red boxes represent the gene or sgRNA targeting the gene of interest; gray boxes represent functional HIV-1 LTRs at both sides of the vector and provirus; triangles represent internal promoters for sgRNA and Cas9 transcription. (B) Categorical distribution of the genes targeted by the Human Epigenome (HuEpi) sgRNA library. (C) Metascape Gene Ontology (GO) analysis [44] of the genes targeted by the HuEpi sgRNA library. (D) Summary of workflow from the generation of the pool of J-Lat HuEpi knockout cells to the sequencing and comparison of the abundance of guideRNAs found in the viral RNA (vRNA) pool versus the genomic DNA (gDNA) pool. GuideRNAs enriched in the viral supernatant RNA relative to the genomic DNA represent the gene(s) that upon knockout result in latency reversal.
Fig 2
Fig 2. GuideRNA level enrichment for known and novel genes of interest in the Latency HIV-CRISPR screen.
(A) GuideRNA enrichment (log2 of fold change) in both J-Lat cell lines for the genes targeted by the HuEpi sgRNA library compared to the Non-Targeting Control (NTC) guides. For statistical analysis, the HuEpi gene sgRNAs are compared to the NTC control. Welch’s t-test, p-value < 0.0001. (B) GuideRNA level enrichment of known HIV-1 latency maintenance factors BRD4, KAT5, and PRC2 complex members (EZH2, SUZ12, and EED) in the Latency HIV-CRISPR screen. For statistical analysis, all conditions are compared to the NTC control. Each dot represents an individual guideRNA targeting the indicated gene. Welch’s t-test, p-value = <0.05 = *, = <0.01 = **, = <0.001 = ***.
Fig 3
Fig 3. The Latency HIV-CRISPR screen in J-Lat 10.6 and J-Lat 5A8 cells identifies a set of mutual, novel hits.
(A) The -log10 of the MAGeCK scores for each gene targeted by the HuEpi sgRNA library (black circles and red triangles) and NTCs (gray squares) are calculated and displayed. Gene names are labelled for hits that have a <10% false discovery rate (FDR) in both J-Lat cell lines (center of Venn diagram in (B)); red triangles represent members of the NuA4 HAT complex and SRCAP complex. NTCs are artificial NTC genes designed by iterative binning of NTC sgRNA sequences (see Methods). Genes are randomized on the x-axis, but the same order is used for both right and left panels. The y-axis is the inverse log10 of the MAGeCK score. (B) Top hit genes (<10% FDR) in common and unique to each J-Lat cell line are ordered by significance and FDR with the top of the list having the highest significance and lowest FDR. (C) Metascape GO analysis [44] of the gene hits with a <10% FDR in each J-Lat cell line. (D) Analysis of the -log10 of the MAGeCK scores of the genes overlapping and unique to the NuA4 HAT and SRCAP complex compared to the NTCs. The higher the number, the more statistically significant it is of a hit. Red font is for genes that score higher than the average NTC score.
Fig 4
Fig 4. Validation of top hits from Latency HIV-CRISPR screen.
(A) Validation of the top 9 gene hits of the Latency HIV-CRISPR screen was performed by individually knocking out each J-Lat cell line with two different guide RNAs and measuring viral reactivation by quantifying HIV-1 reverse transcriptase activity of the viral supernatant. NFκBIA knockout is a positive control. The reverse transcriptase activity from released virions was normalized to basal activity from the transduction of NTC sgRNA. For each for the knockout cell lines, ICE analysis was performed and the average knockout is shown in pie charts. Multiple unpaired t-tests, p-value = <0.05 = *. (B) CUL3 knockout resulted in significant viral reactivation in a primary CD4+ T cell model of HIV-1 latency using cells from four healthy donors. Viral reactivation was measured by flow cytometry and normalized to the AAVS1 knockout cells. Paired t-test, p-value = <0.05 = *, = <0.01 = **.
Fig 5
Fig 5. LRA Latency HIV-CRISPR screen identifies ING3 in combination with AZD5582 as a HIV-1 latency maintenance factor.
(A) ING3 is the top hit of the LRA Latency HIV-CRISPR screen. The Latency HIV-CRISPR screen HuEpi knockout cells were treated with a low activating dose (10 nM) of AZD5582. The -log10 of the MAGeCK score (on the y-axis) for each gene targeted by the HuEpi sgRNA library (black circles) and NTCs (gray squares) are calculated and displayed. Gene names are labelled for hits that have a <10% false discovery rate (FDR) in each J-Lat cell lines. NTCs are artificial NTC genes designed by iterative binning of NTC sgRNA sequences (see Methods). Genes are randomized on the x-axis, but the same order is used for both right and left panels. (B) Comparison of the Latency HIV-CRISPR screen by MAGeCK score in the presence (y-axis) and absence of AZD5582 (x-axis) with HuEpi genes (circles) and NTCs (gray squares). The data for the screen without an LRA (x-axis) is from Fig 3 as these two screens were performed in parallel. The genes unique to each screen are closest to the respective axis and the genes that are in common to both screens are at the center. ING3 is highlighted in periwinkle and CUL3 in green.
Fig 6
Fig 6. Validation of ING3 in combination with AZD5582 as a HIV-1 latency maintenance factor.
(A) HIV-1 reverse transcriptase activity (y-axis) of the viral supernatant of NTC sgRNA transduction or ING3 knockout in J-Lat 10.6 and 5A8 treated with 10 nM AZD5582 or an equivalent volume of DMSO. The ICE knockout score for the J-Lat 5A8 ING3 knockout cell line is 72 and the ICE knockout score for the J-Lat 10.6 ING3 knockout cell is 66. ING3 knockout and AZD5582 treatment combine to result in a significant increase in viral reactivation. Paired t-test, p-value = <0.05 = *, = <0.01 = **. (B) Representative flow cytometry plots of primary CD4+ T cell HIV-1 latency model cells that are AAVS1 or ING3 knockouts treated with DMSO or 1 μM AZD5582 treatment. Thy1.2-, GFP- cells (quadrant 4) are uninfected; Thy1.2+, GFP- (quadrant 3) cells are infected with the dual reporter HIV-1 virus and latent; Thy1.2+, GFP+ cells (quadrant 2) are infected and reactivated. (C) Independent knockouts of AAVS1 and ING3 in primary CD4+ T cell HIV-1 latency model cells were performed in three healthy donors and each pool of knockout cells were treated with DMSO or 1 μM AZD5582. Reactivation fold change is calculated based on percent Thy1.2+, GFP+ cells. The quantified percent Thy1.2+, GFP+ cells for each condition (knockout of AAVS1 or ING3 and treatment of DMSO or 1 μM AZD5582) was then normalized to the AAVS1 knockout with DMSO treatment (negative control) condition. Knockout of ING3 and AZD5582 treatment combined resulted in significant reactivation compared to knockout of AAVS1. Paired t-test, p-value = <0.05 = *. (D) Western blot showing similar p52 levels are detected in the control and ING3 knockout J-Lat 10.6 and 5A8 cell lines upon treatment of 10 nM AZD5582. Activation of the non-canonical NFκB (NFκB2) pathway is marked by a decrease in p100 and an increase in the cleaved product of p52.
Fig 7
Fig 7. ING3 knockout decreases pan-H4Ac and BRD4 levels and stimulates HIV-1 transcriptional initiation and elongation upon addition of AZD5582.
(A) Genome browser tracks centered over the HIV-1 LTR showing the pan-H4Ac signal decreases in the ING3 knockout alone and in combination with AZD5582 conditions. The y-axis represents read count. Because the HIV-1 LTR sequence is identical between 5’ LTR vs. the 3’ LTR, the CUT&Tag reads are combined onto one LTR. The LTR is subdivided into three regions: U3, R (containing the transcription start site), and U5. As quality control, we determined the signal levels of pan-H4Ac from the CUT&Tag data and confirmed the replicates of the antibody was most highly correlated amongst the pan-H4Ac replicates (S3A Fig). (B) Box plot showing the pan-H4Ac levels quantified over the full LTR including the U3 region and the R+U5 regions that include the transcriptional start site. The y-axis is the pan-H4Ac base pair coverage normalized to the total base pair coverage across the genome. Blue represents the transduction of NTC sgRNA with treatment of DMSO; yellow represents the transduction of NTC sgRNA with a treatment of 10 nM AZD5582; orange represents ING3 knockout with treatment of DMSO; red represents ING3 knockout with treatment of 10 nM AZD5582. Replicates for IgG n = 18 and pan-H4Ac n = 24. For statistical analysis, all conditions are compared to the NTC knockout and DMSO treatment control. P-value <0.05 = *, <0.005 = **. (C) Genome browser tracks showing BRD4 levels decrease in the ING3 knockout alone and in combination with AZD5582 conditions. As quality control, we determined the signal levels of BRD4 from the CUT&Tag data and confirmed the replicates of the antibody was most highly correlated amongst the BRD4 replicates (S3A Fig). (D) Same as (B) but quantifying BRD4 levels. Replicates for BRD4 n = 16. (E) Genome browser tracks showing RNA-Pol2-S5p levels increase at the HIV-1 LTR, as well as the body of the provirus downstream of the 5’ LTR (“provirus body”), and the region of the host genome downstream of the 3’ LTR of the integrated provirus (“downstream”) upon ING3 knockout and AZD5582 treatment combined. As quality control, we determined the signal levels of RNA-Pol2-S5p from the CUT&Tag data and confirmed the replicates of the antibody was most highly correlated amongst the RNA-Pol2-S5p replicates (S3B Fig). (F) Box plot showing the quantification of the RNA-Pol2-S5p CUT&Tag signal over the HIV-1 LTR, the body of the provirus, and the region of the host genome downstream of the provirus. The y-axis is the RNA-Pol2-S5p base pair coverage normalized to the total base pair coverage across the genome. Blue represents the transduction of NTC sgRNA with treatment of DMSO; yellow represents the transduction of NTC sgRNA with a treatment of 10 nM AZD5582; orange represents ING3 knockout with treatment of DMSO; red represents ING3 knockout with treatment of 10 nM AZD5582. Replicates for RNA-Pol2-S5p n = 13. For statistical analysis, all conditions are compared to the NTC knockout and DMSO treatment control. P-value <0.05 = *, <0.005 = **, <0.0005 = ***. (G) Genome browser tracks showing RNA-Pol2-S2p levels increase over the body of the HIV-1 provirus as well as the host genome downstream of the provirus upon ING3 knockout and AZD5582 treatment combined. As quality control, we determined the signal levels of RNA-Pol2-S2p from the CUT&Tag data and confirmed the replicates of the antibody was most highly correlated amongst the RNA-Pol2-S2p replicates (S3B Fig). (H) Same as (F) but quantifying RNA-Pol2-S2p levels. Replicates for RNA-Pol2-S2p n = 17.
Fig 8
Fig 8. Changes in RNA-Pol2-S5p levels upon ING3 knockout combined with AZD5582 treatment are nearly unique to the HIV-1 provirus.
(A) Volcano plot comparing RNA-Pol2-S5p peaks between the NTC KO + DMSO (negative control) and ING3 KO + AZD5582 conditions. Highlighted peaks over the HIV-1 LTR (yellow circle), the body of the provirus (green circle), and downstream region of HIV-1 provirus (blue circle) are the regions of the highest RNA-Pol2-S5p fold change and are highly significant. Other regions with an absolute log2 fold change greater than 1 and a -log10 adjusted p-value > 2 are highlighted in pink. (B) Scatter plot showing all of the RNA-Pol2-S5p peaks rank ordered by fold change. Peaks are colored as in (A). The top three regions are the HIV-1 LTR, body of the HIV-1 provirus, and downstream region of the HIV-1 provirus. The next two regions overlap HCG27 and the histone cluster 2 spanning HIST2H4A-HIST2H4B. The region with the greatest reduction in RNA-Pol2-S5p signal overlaps PCGF3.

Similar articles

Cited by

References

    1. Deeks SG, Overbaugh J, Phillips A, Buchbinder S. HIV infection. Nat Rev Dis Primers. 2015;1:15035. Epub 2015/01/01. doi: 10.1038/nrdp.2015.35 . - DOI - PubMed
    1. Chun TW, Davey RT Jr., Engel D, Lane HC, Fauci AS. Re-emergence of HIV after stopping therapy. Nature. 1999;401(6756):874–5. Epub 1999/11/30. doi: 10.1038/44755 . - DOI - PubMed
    1. Finzi D, Blankson J, Siliciano JD, Margolick JB, Chadwick K, Pierson T, et al.. Latent infection of CD4+ T cells provides a mechanism for lifelong persistence of HIV-1, even in patients on effective combination therapy. Nat Med. 1999;5(5):512–7. Epub 1999/05/06. doi: 10.1038/8394 . - DOI - PubMed
    1. Sengupta S, Siliciano RF. Targeting the Latent Reservoir for HIV-1. Immunity. 2018;48(5):872–95. Epub 2018/05/17. doi: 10.1016/j.immuni.2018.04.030 ; PubMed Central PMCID: PMC6196732. - DOI - PMC - PubMed
    1. Einkauf KB, Lee GQ, Gao C, Sharaf R, Sun X, Hua S, et al.. Intact HIV-1 proviruses accumulate at distinct chromosomal positions during prolonged antiretroviral therapy. J Clin Invest. 2019;129(3):988–98. Epub 2019/01/29. doi: 10.1172/JCI124291 ; PubMed Central PMCID: PMC6391088. - DOI - PMC - PubMed

Publication types

MeSH terms