. 2023 Jan 27;8(79):eade1413.
doi: 10.1126/sciimmunol.ade1413. Epub 2023 Jan 27.

T-independent responses to polysaccharides in humans mobilize marginal zone B cells prediversified against gut bacterial antigens

Affiliations

T-independent responses to polysaccharides in humans mobilize marginal zone B cells prediversified against gut bacterial antigens

Sandra Weller et al. Sci Immunol. .

Abstract

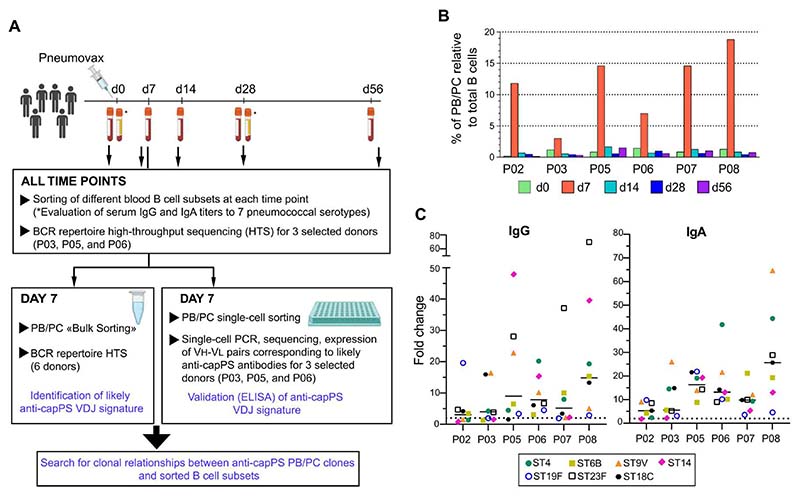
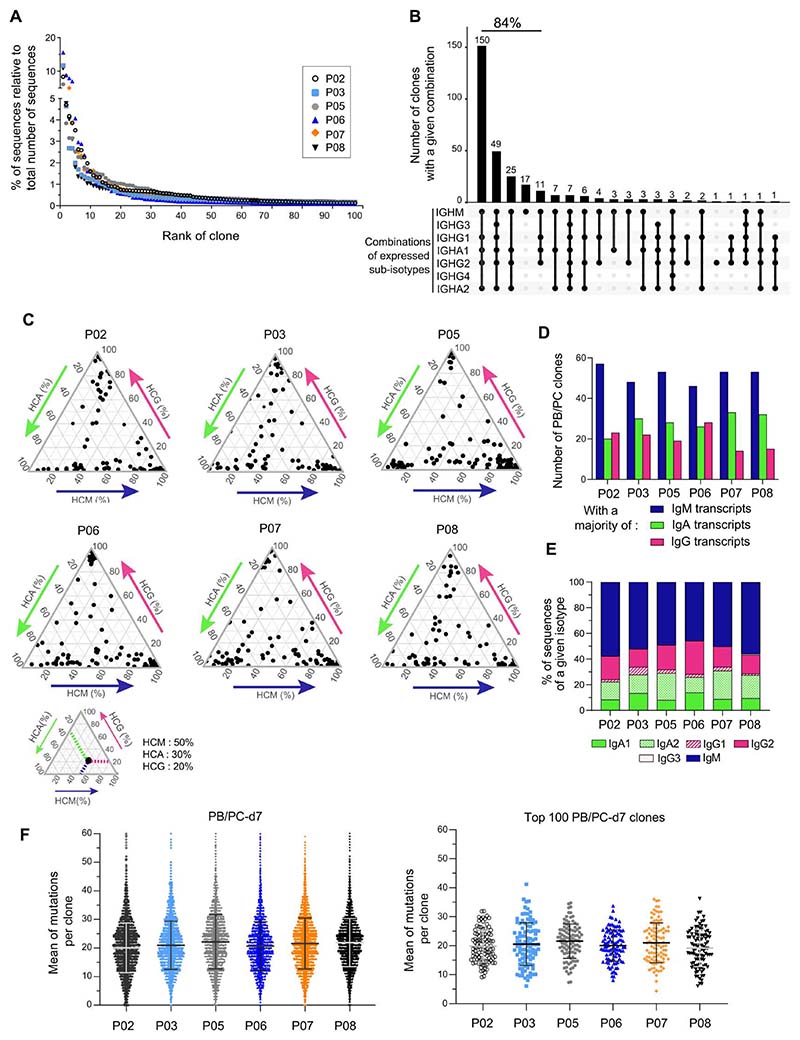
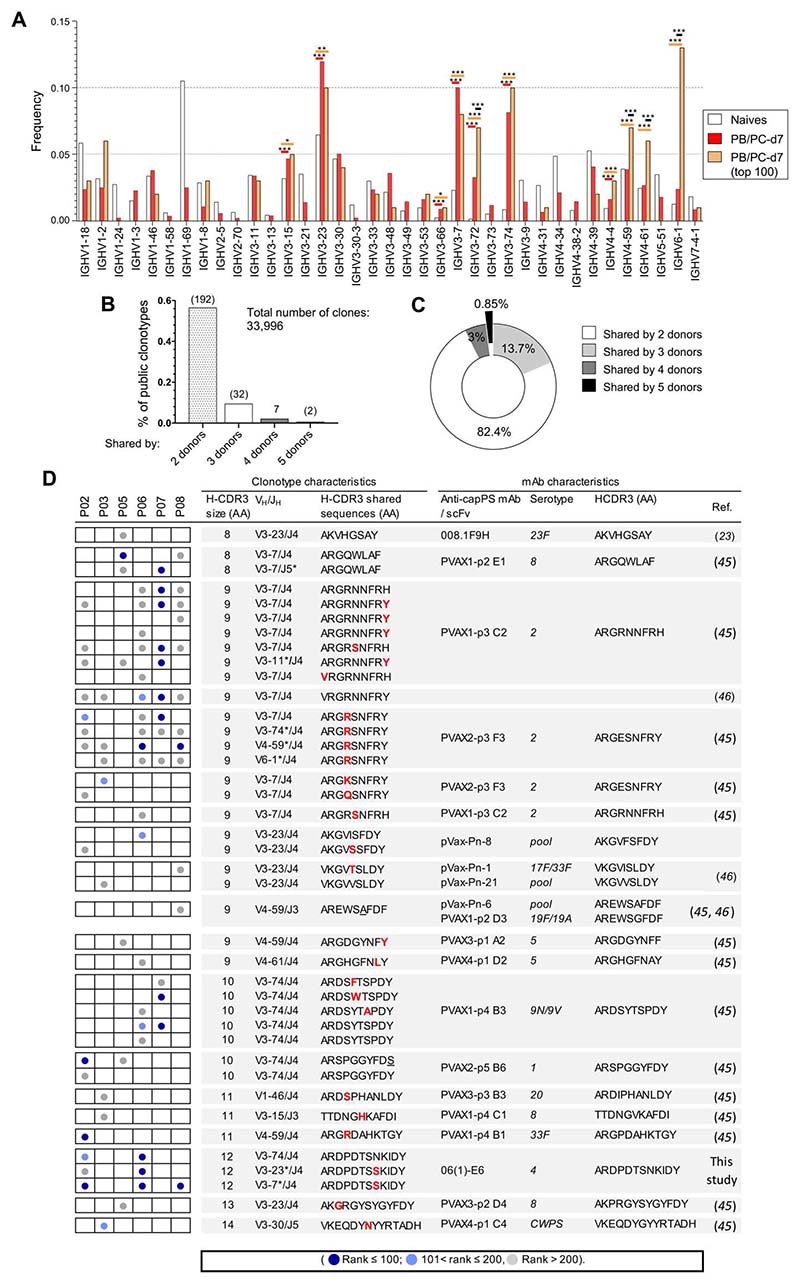
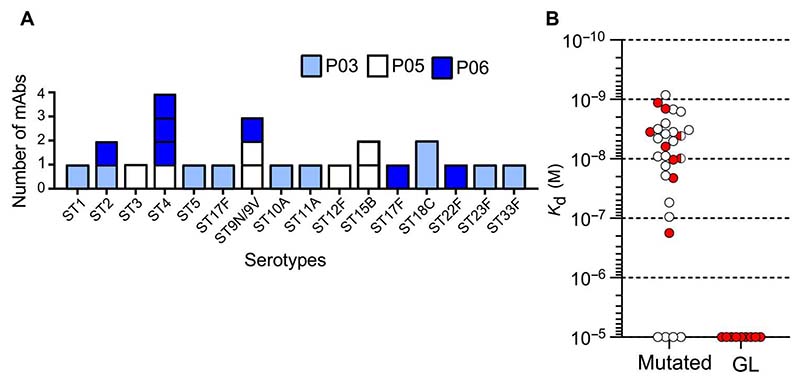
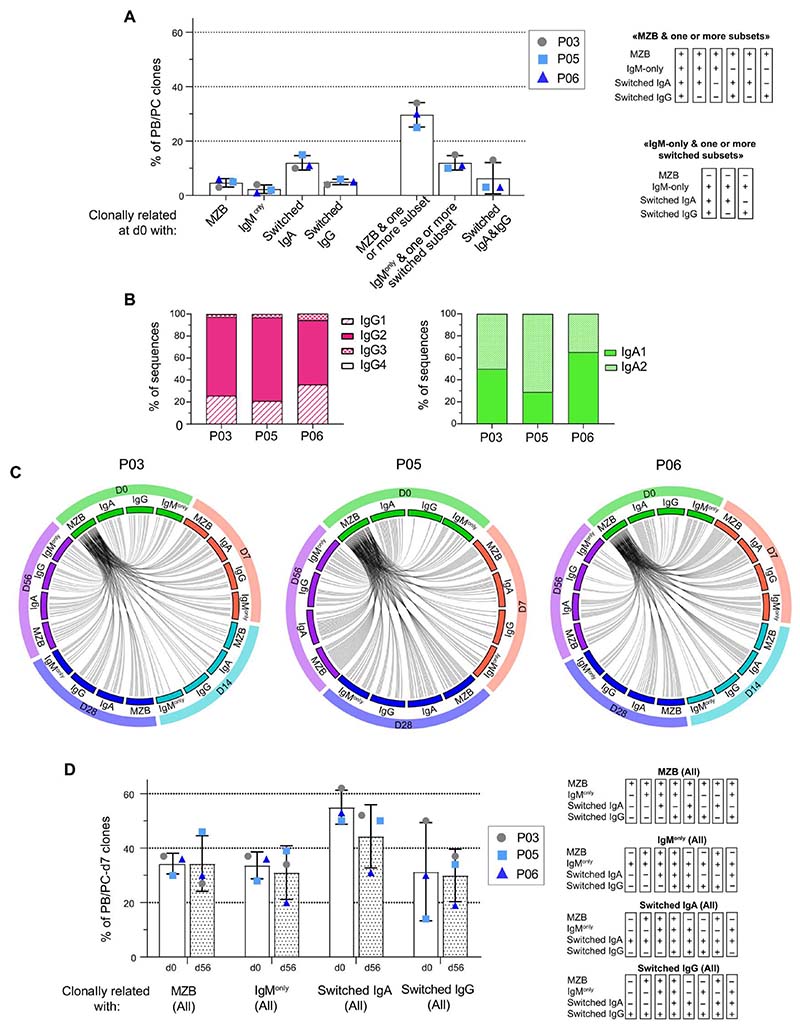
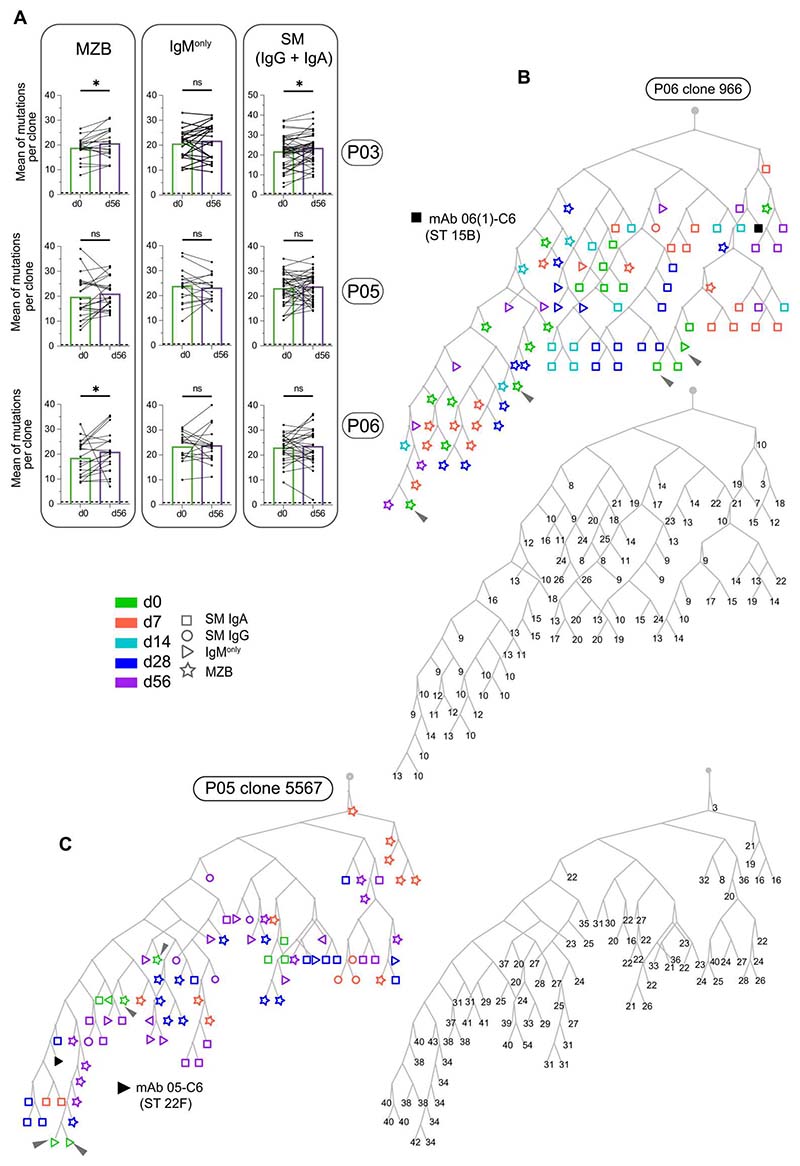
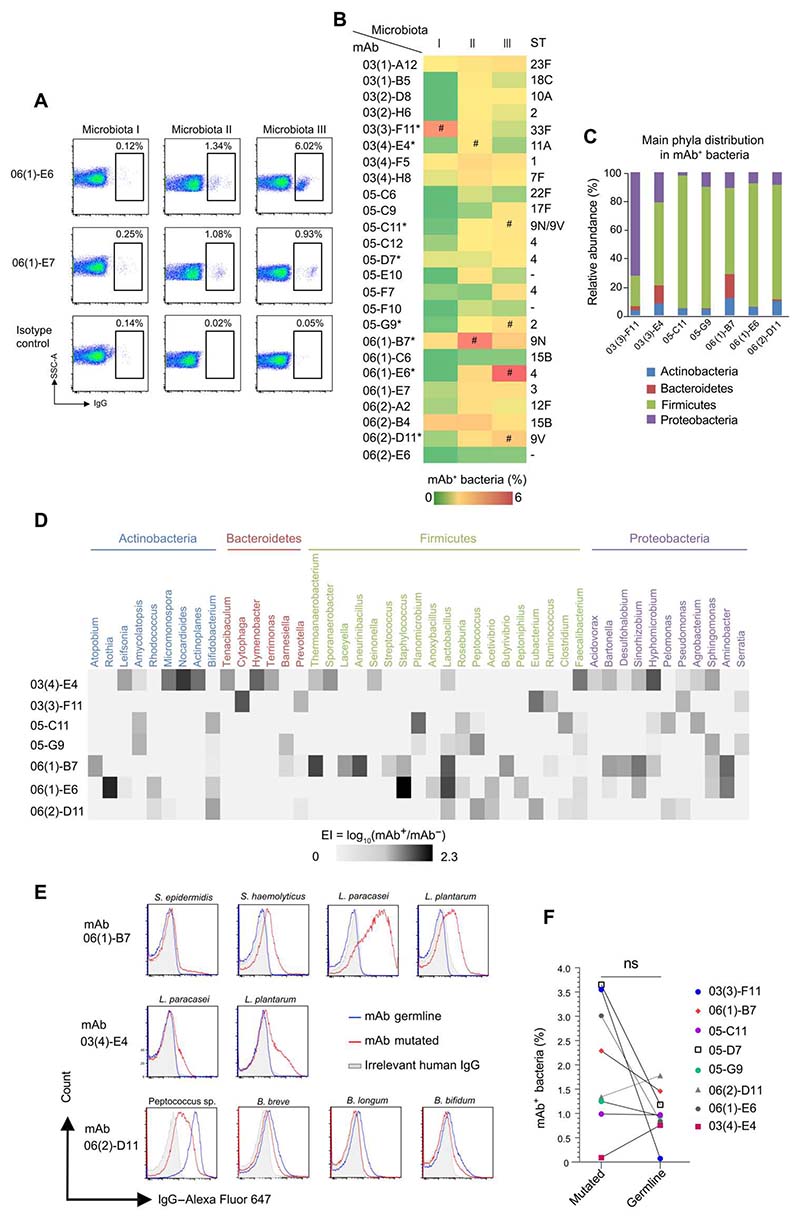
Marginal zone (MZ) B cells are one of the main actors of T-independent (TI) responses in mice. To identify the B cell subset(s) involved in such responses in humans, we vaccinated healthy individuals with Pneumovax, a model TI vaccine. By high-throughput repertoire sequencing of plasma cells (PCs) isolated 7 days after vaccination and of different B cell subpopulations before and after vaccination, we show that the PC response mobilizes large clones systematically, including an immunoglobulin M component, whose diversification and amplification predated the pneumococcal vaccination. These clones could be mainly traced back to MZ B cells, together with clonally related IgA+ and, to a lesser extent, IgG+CD27+ B cells. Recombinant monoclonal antibodies isolated from large PC clones recognized a wide array of bacterial species from the gut flora, indicating that TI responses in humans largely mobilize MZ and switched B cells that most likely prediversified during mucosal immune responses against bacterial antigens and acquired pneumococcal cross-reactivity through somatic hypermutation.


Conflict of interest statement

Competing interests: J.-C.W. received consulting fees from the Fondation Mérieux outside of this work. The other authors declare that they have no competing interests.

Figures

Fig. 1
Fig. 1. A strong but transient PB/PC response in blood at day 7 after Pneumovax vaccination.
(A) Study design and sample collection (see fig. S1). (B) Percentage of PBs/PCs relative to CD19+ B cells before and at different time points after vaccination with Pneumovax of six individuals. (C) Fold changes in serum levels of serotype-specific anti-capPS IgG and IgA between d0 and d28 after Pneumovax vaccination. The dashed line indicates a fold change of 2 (see fig. S1C).
Fig. 2
Fig. 2. High-throughput sequencing of the Ig repertoire of PB/PC-d7 cells after Pneumovax vaccination shows large clonal expansions, a high load of somatic hypermutations, and a representation of μ, α, and γ isotypes in the majority of the top 100–ranked clones.
(A) Percentages of sequences (relative to the total number of PB/PC-d7 sequences) represented by each of the top 100 PB/PC-d7 clones for each vaccinee (see fig. S2A). (B) Combinations of IgH sub-isotypes expressed by PB/PC-d7 clones. The analysis is done on pooled top 100 PB/PC-d7 clones of P03, P05, and P06. The number on top of each bar represents the number of clones, with the isotype combination indicated below. The total percentage of the five most frequent combinations is indicated above the corresponding histogram bars. (C) Ternary plots depicting the relative proportion of IgA, IgG, and IgM sequences in the top 100 PB/PC-d7 clones of each vaccinee. Each black dot corresponds to one clone. A small ternary plot below shows a theoretical example of a clone with its projected coordinates on the three axes, indicating the proportion of each isotype. (D) Number of PB/PC-d7 clones, among the top 100 clones, that have a majority of IgM, IgA, or IgG sequences. (E) Sub-isotype representation in the top 100 PB/PC-d7 clones of each vaccinee. The relative percentages of sub-isotype sequences were calculated per clone (to allow weighting to clone size) and averaged for the top 100 PB/PC clones. (F) Scatterplots representing the means of Ig-VH mutations per clone for the totality (left) or for the top 100 PB/PC-d7 clones (right) of each vaccinee. Black (or gray) lines and error bars represent means ± SD.
Fig. 3
Fig. 3. Occurrence of public clonotypes in the repertoire of PB/PC-d7 that are shared by two or more Pneumovax vaccinees, some of these clonotypes being expressed by previously described anti-capPS mAbs.
(A) Frequency of VH gene usage (relative to the total sequences of each subset) for naive (at d0), PB/PCd7, and top 100 PB/PC-d7 (pooled sequences from P03, P05, and P06). Only informative VH genes for the comparison between naive and PB/PC-d7, or between naive and top 100 PB/PC-d7, were plotted, i.e., VH genes either absent or representing less than 0.005% in two of three of the comparison groups were filtered out. Significance was calculated with Fisher’s exact test with a false discovery rate correction. P values are indicated only for VH genes that are significantly more expressed in PB/PC-d7 and/or top 100 PB/PC-d7 versus naive B cells. The color of the lines on top of the histogram bars indicates the comparison groups: red, naive versus PB/PC-d7; orange, naive versus top 100 PB/PC-d7; black, PB/PC-d7 versus top 100 PB/PC-d7. *P < 0.05; **P < 0.005; ***P < 0.0005. (B) Percentages of public clonotypes among the total number of PB/PC-d7 clones. Numbers on top of each histogram bar represent the number of clonotypes. (C) Proportion of public clonotypes, among those identified in the six vaccinees, that were shared by two, three, four, or five vaccinees. (D) Characteristics of the public clonotypes that matched with published anti-capPS mAb. The left part illustrates the sharedness of the clonotypes between the six vaccinees, each column corresponding to one of them, as indicated. The color of the dots in the boxes indicates the rank of the PB/PC-d7 clone associated to the clonotype whose characteristics are indicated on the right (dark blue: rank ≤100; light blue: 101 < rank ≤ 200; gray: rank > 200). Characteristics of the published mAb are indicated in the far right part of the table. “Pool” refers to the cases where a pool of capPS was used to test the specificity of the mAbs/single-chain fragment variable in the cited articles (see fig. S4). *, clonotypes matching with anti-capPS mAbs by both their H-CDR3 size and amino acid sequences, but expressing different VH or JH genes.
Fig. 4
Fig. 4. Representative VH-VL pairs of largely expanded PB/PC-d7 clones show anti-capPS reactivity that is dependent on somatic hypermutation.
(A) Pneumococcal serotypes recognized by the mAbs obtained from vaccinees P03, P05, and P06. Each mAb recognized only one serotype (except for 9N/9V). (B) Dissociation constants (Kd, expressed as moles per liter) of the 28 expressed mAbs against their specific serotypes (see data file S2). Red dots correspond to mAbs for which a GL version of the VH/VL pair was expressed. (The two half red circles correspond to the mAb that binds to serotype 9N and 9V with different Kd.) mAbs with no measurable affinity were considered nonbinders (Kd ≥ 10−5).
Fig. 5
Fig. 5. The top 100 PB/PC-d7 clones are clonally related to large preexisting clonal entities, including MZB, as well as IgM-only, IgG+, and IgA+ CD27+ B cells that remain stable over time.
(A) Percentage of top 100 PB/PC-d7 clones having clonal relationships at d0 with only one subset or with several subsets. The categories “MZB & one or more subset”and “IgMonly & one or more switched subset”include six and three combinations, respectively (see tables on the right of the graph).“+”means that a PB/PC-d7 clone is clonally linked to a given B cell subpopulation. (B) Isotype representation in the switched IgG and IgA d0 clones that are clonally related to the top 100 PB/PC-d7 clones. The relative percentages of sub-isotype sequences were calculated per clone (to allow weighting to clone size) and averaged. (C) Clonal overlap of d0 MZB clones that are related to the largest PB/PC-d7 clones with all other subsets at different time points, for P03, P05, and P06. For clarity, only the top 50 PB/PC-d7 clones that have clonal relationships with MZB cells at d0 (MZB-d0) were taken into consideration in this analysis, and their relationships with the different subsets are illustrated through an “MZB-d0-centric view” (PB/PC-d7 subsets are not depicted on the plot; see fig. S5). Accordingly, the many intersubset clonal relationships (e.g., between switched IgA, IgG, and IgM-only cells sampled over time) are not shown. (D) Percentage of top 100 PB/PC-d7 clones having clonal relationships with MZBs (All), IgM-only (All), switched IgG (All), or switched IgA (All) B cells at d0 and d56. Each “All”category includes eight possible combinations (see tables on the right of the graph).
Fig. 6
Fig. 6. Somatic mutations in clones related to the top 100 PB/PC-d7 clones do not increase 2 months after Pneumovax vaccination, and Ig mutation trees do not reveal a time-dependent pattern of mutation accumulation.
(A) Mean of mutation numbers (in VH sequences) per clone for clone pairs present at both d0 and d56 in the MZB, IgM-only, and switched (IgG + IgA) subsets, respectively. Dashed lines represent the mean mutation number in VH sequences of the naive cells of each donor. Significance was calculated with the Wilcoxon matched-pairs two-tailed signed-rank test (*P ≤ 0.05; ns, not significant). (B and C) Representative Ig lineage trees of two B cell clones with anti-capPS specificities. The trees were built, using the IgPhyML algorithm, with a subsampling of 10 sequences (or fewer if not available) by B cell subset and by time point. The black symbols correspond to the sequence of the anti-capPS mAb that was isolated from single cell–sorted PCs (see data file S3). The gray rectangle indicates the inferred common progenitor. Each lineage tree has been duplicated to indicate the number of mutations per VH of each sequence. (Arrowheads mark examples of cells sampled at d0 but mapped on terminal leaves.)
Fig. 7
Fig. 7. Anti-capPS mAbs cross-react against gut bacteria from various genera and show a largely preserved cross-reactivity when reverted to their VH-VL GL configuration.
(A) Representative flow cytometry plots of microbiota reactivity of two mAbs toward human gut bacteria. Commensal bacteria were isolated from fecal samples of three healthy individuals (I to III). Data are representative of two independent experiments. (B) Microbiota reactivity of the different mAbs toward human gut microbiota. Frequency of mAb-coated bacteria is represented with a color scale. Data are representative of two independent experiments. Serotype specificity is indicated on the right part of the graph. Asterisks (*) indicate mAbs for which GL versions have been produced. Hash symbols (#) indicate microbiota that have been sorted and analyzed by 16S ribosomal DNA sequencing in (C) and (D). (C) Relative abundance of the four main phyla in mAb+ fractions. (D) Heatmap diagram of EI of the most frequent genera from the three healthy microbiota. Selected genera are recognized by at least one mAb (EI > 0.2) and belong to the 100 most frequent genera in microbiota I, II, and III. Genera are grouped according to their phylum. (E) Representative flow cytometry analysis of mAb (red line) or irrelevant IgG (gray, anti–TNF-α IgG1) staining of pure bacterial strains. (F) Pairwise comparison of microbiota reactivity of mAbs and their respective GL revertants.

Comment in

Similar articles

Cited by

References

    1. Mosier DE, Mond JJ, Goldings EA. The ontogeny of thymic independent antibody responses in vitro in normal mice and mice with an X-linked B cell defect. J Immunol. 1977;119:1874–1878. - PubMed
    1. Mond JJ, Lees A, Snapper CM. T cell-independent antigens type 2. Annu Rev Immunol. 1995;13:655–692. - PubMed
    1. Mond JJ, Vos Q, Lees A, Snapper CM. T cell independent antigens. Curr Opin Immunol. 1995;7:349–354. - PubMed
    1. Vos Q, Lees A, Wu ZQ, Snapper CM, Mond JJ. B-cell activation by T-cell-independent type 2 antigens as an integral part of the humoral immune response to pathogenic microorganisms. Immunol Rev. 2000;176:154–170. - PubMed
    1. Balázs M, Martin F, Zhou T, Kearney JF. Blood dendritic cells interact with splenic marginal zone B cells to initiate T-independent immune responses. Immunity. 2002;17:341–352. - PubMed

Publication types