. 2023 Apr 13;141(15):1817-1830.
doi: 10.1182/blood.2022018246.

Mechanisms of response and resistance to combined decitabine and ipilimumab for advanced myeloid disease

Affiliations

Mechanisms of response and resistance to combined decitabine and ipilimumab for advanced myeloid disease

Livius Penter et al. Blood. .

Abstract

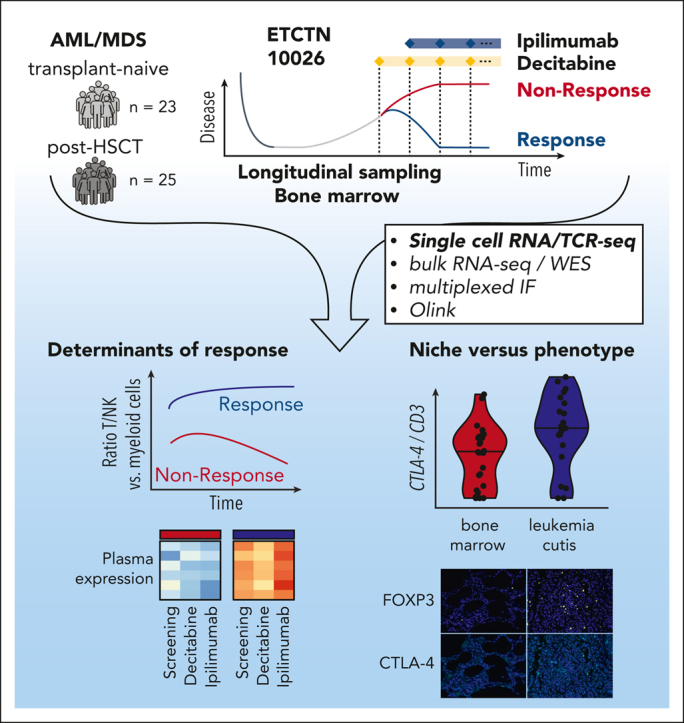
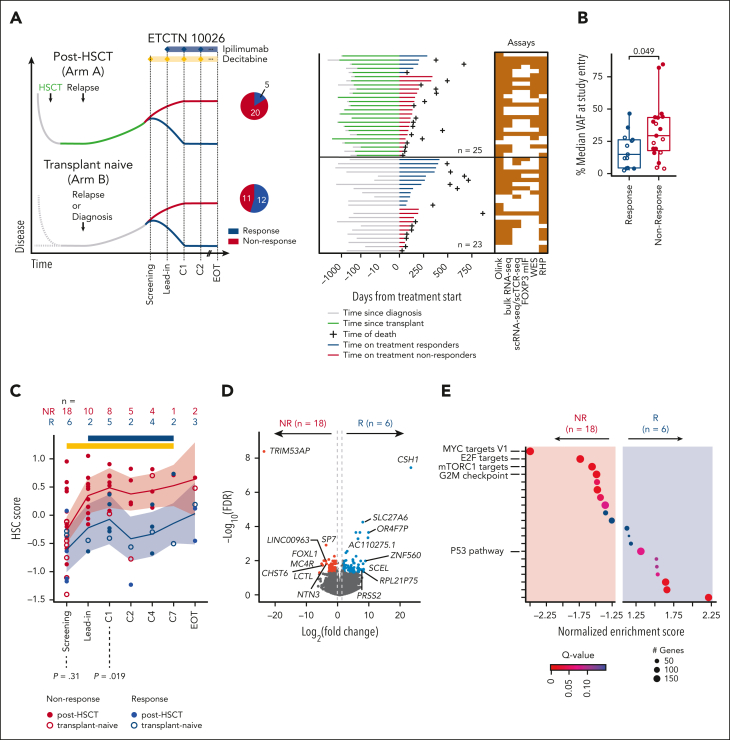
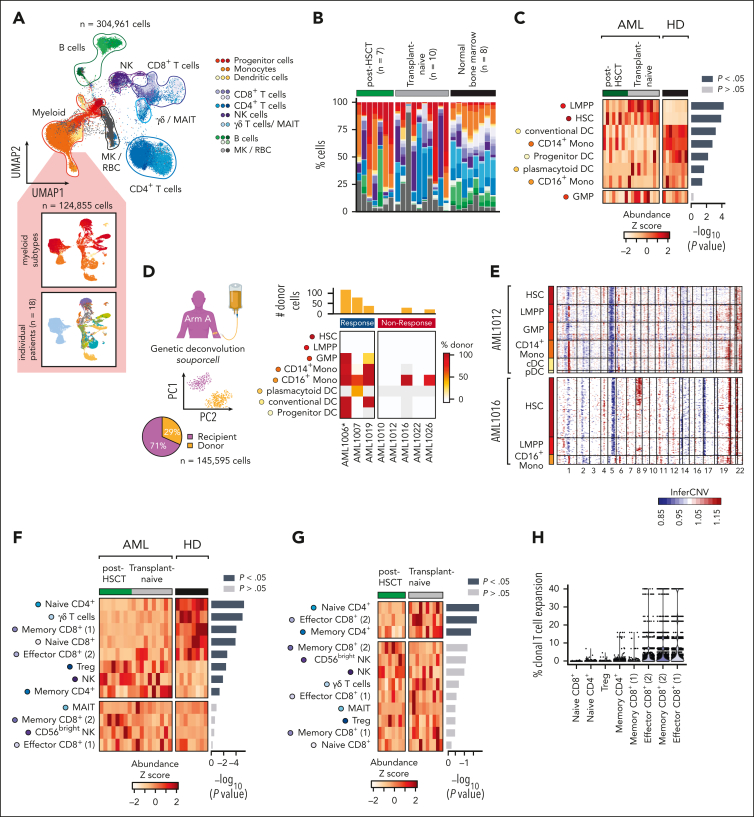
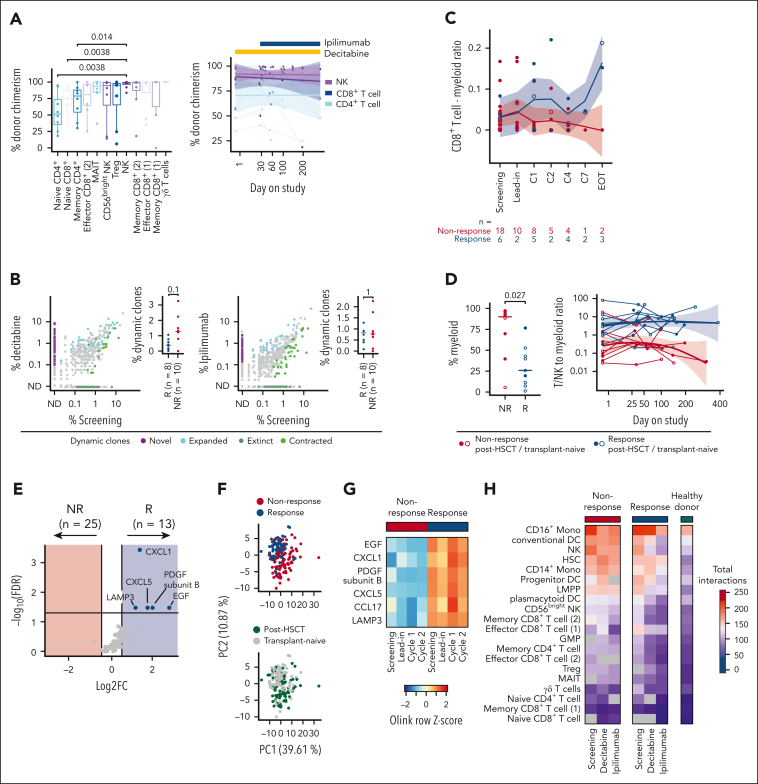
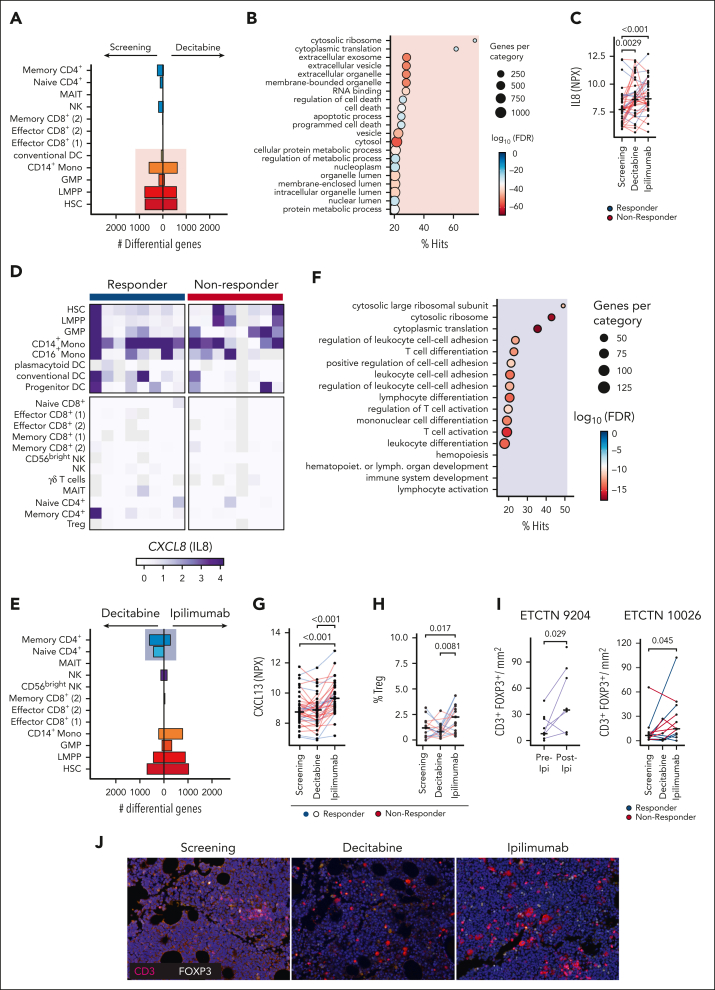
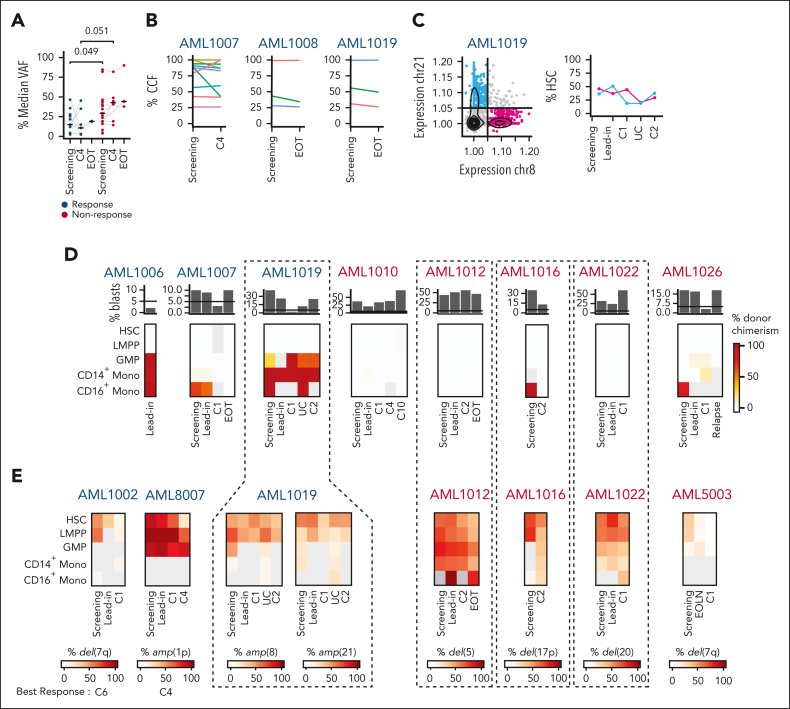
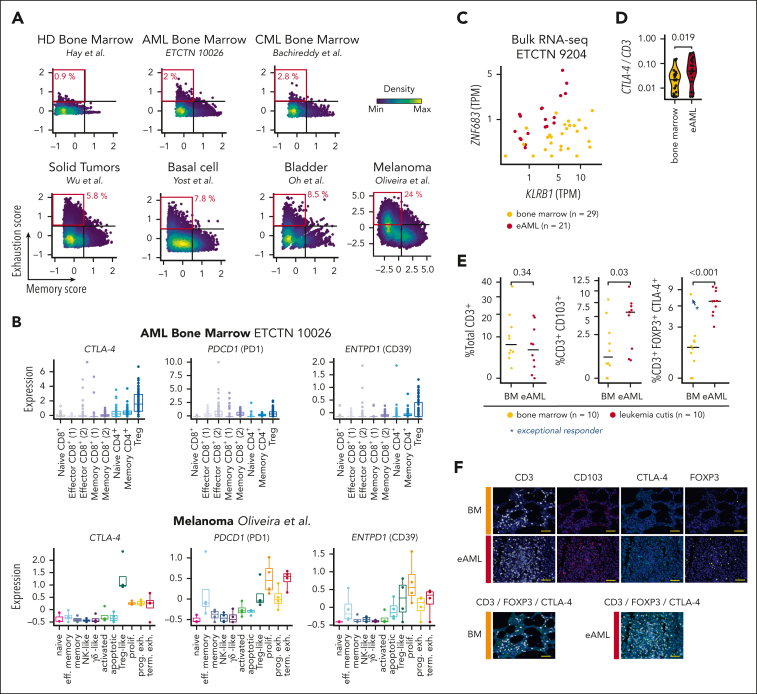
The challenge of eradicating leukemia in patients with acute myelogenous leukemia (AML) after initial cytoreduction has motivated modern efforts to combine synergistic active modalities including immunotherapy. Recently, the ETCTN/CTEP 10026 study tested the combination of the DNA methyltransferase inhibitor decitabine together with the immune checkpoint inhibitor ipilimumab for AML/myelodysplastic syndrome (MDS) either after allogeneic hematopoietic stem cell transplantation (HSCT) or in the HSCT-naïve setting. Integrative transcriptome-based analysis of 304 961 individual marrow-infiltrating cells for 18 of 48 subjects treated on study revealed the strong association of response with a high baseline ratio of T to AML cells. Clinical responses were predominantly driven by decitabine-induced cytoreduction. Evidence of immune activation was only apparent after ipilimumab exposure, which altered CD4+ T-cell gene expression, in line with ongoing T-cell differentiation and increased frequency of marrow-infiltrating regulatory T cells. For post-HSCT samples, relapse could be attributed to insufficient clearing of malignant clones in progenitor cell populations. In contrast to AML/MDS bone marrow, the transcriptomes of leukemia cutis samples from patients with durable remission after ipilimumab monotherapy showed evidence of increased infiltration with antigen-experienced resident memory T cells and higher expression of CTLA-4 and FOXP3. Altogether, activity of combined decitabine and ipilimumab is impacted by cellular expression states within the microenvironmental niche of leukemic cells. The inadequate elimination of leukemic progenitors mandates urgent development of novel approaches for targeting these cell populations to generate long-lasting responses. This trial was registered at www.clinicaltrials.gov as #NCT02890329.


Conflict of interest statement

Conflict-of-interest disclosure: S.R. receives research support from Bristol-Myers-Squibb and KITE/Gilead, and is a member of the SAB of Immunitas Therapeutics. P.B. reports equity in Agenus, Amgen, Breakbio Corp, Johnson & Johnson, Exelixis, and BioNTech. and receives research support from Allogene Therapeutics. S.Gnjatic reports consultancy and/or advisory roles for Merck, Neon Therapeutics and OncoMed and research funding from Bristol-Myers Squibb, Genentech, Boehringer-Ingelheim, Takeda, and Regeneron. J.R. receives research funding from Kite/Gilead, Oncternal, and Novartis, serves on a Data Safety Monitoring Committee for AvroBio and on the Scientific Advisory Boards for Akron Biotech, Clade Therapeutics, Garuda Therapeutics, LifeVault Bio, Novartis, Smart Immune, Talaris Therapeutics, and TScan Therapeutics. D.N. received personal fee from Pharmacyclics, served as consultant to the American Society of Hematology Research Collaborative and has stock ownership in Madrigal Pharmaceuticals. K.J.L. reports equity in Standard BioTools Inc. F.S.H. reports grants and personal fees from Bristol-Myers Squibb; personal fees from Merck; grants and personal fees from Novartis; and personal fees from Surface, Compass Therapeutics, Apricity, Bicara, Pieris Pharmacutical, Checkpoint Therapeutics, Genentech/Roche, Bioentre, Gossamer, Iovance, Catalym, Immunocore, Amgen, Kairos, Rheos, Zumutor, Corner Therapeuitcs, Curis, and Astra Zeneca; outside the submitted work; In addition, F.S.H. has a patent Methods for Treating MICA-Related Disorders (#20100111973) with royalties paid; a patent Tumor antigens and uses thereof (#7250291) issued; a patent Angiopoietin-2 Biomarkers Predictive of Anti-immune checkpoint response (#20170248603) pending; a patent Compositions and Methods for Identification, Assessment, Prevention, and Treatment of Melanoma using PD-L1 Isoforms (#20160340407) pending; a patent Therapeutic peptides (#20160046716) pending; a patent Therapeutic Peptides (#20140004112) pending; a patent Therapeutic Peptides (#20170022275) pending; a patent Therapeutic Peptides (#20170008962) pending; a patent THERAPEUTIC PEPTIDES Therapeutic Peptides Patent number: 9402905 issued; a patent METHODS OF USING PEMBROLIZUMAB AND TREBANANIB pending; a patent Vaccine compositions and methods for restoring NKG2D pathway function against cancers Patent number: 10279021 issued; a patent antibodies that bind to major histocompatibility complex class I polypeptide-related sequence A Patent number:10106611 issued; and a patent ANTI-GALECTIN ANTIBODY BIOMARKERS PREDICTIVE OF ANTI-IMMUNE CHECKPOINT AND ANTI-ANGIOGENESIS RESPONSES Publication number: 20170343552 pending. M.S.D. has received consulting fees from AbbVie, Adaptive Biosciences, Aptitude Health, Ascentage Pharma, AstraZeneca, BeiGene, Bio Ascend, BMS, Curio Science, Eli Lilly, Genentech, Janssen, Merck, Ono Pharmaceuticals, Research to Practice, Secura Bio, TG Therapeutics, and Takeda and research support from AstraZeneca, Ascentage Pharma, Genentech, MEI Pharma, Novartis, Surface Oncology, and TG Therapeutics. F.M. is a cofounder of and has equity in Harbinger Health, has equity in Zephyr AI, and serves as a consultant for Harbinger Health, Zephyr AI, and Red Cell Partners. F.M. declares that none of these relationships are directly or indirectly related to the content of this manuscript. R.J.S. serves on the Board of Directors for Be the Match/National Marrow Donor Program and DSMB for Juno Therapeutics, Celgene USA, and BMS; reports personal fees from Vor Biopharma, Smart Immune, Daiichi Sankyo Inc, Neovii, Bluesphere Bio, Cugene, and Jasper. J.S.G. reports serving on steering committee and receiving personal fees from AbbVie, Astellas, and Takeda and institutional research funds from AbbVie, Genentech, Prelude, and AstraZeneca. C.J.W. holds equity in BioNTech, Inc and receives research support from Pharmacyclics. The remaining authors declare no competing financial interests.

Figures

None
Graphical abstract
Figure 1.
Figure 1.
Study overview and predictive markers of response to decitabine and ipilimumab treatment. (A) The ETCTN/CTEP 10026 study consisted of a cohort of relapsed AML after HSCT (arm A) and transplant-naïve AML/MDS (arm B) with morphologic disease. Following baseline assessment at study entry (Screening), a priming cycle of decitabine monotherapy (Lead-in) was administered. Subsequent cycles of therapy were given as a combination of decitabine and ipilimumab (C1, C2, …). Biopsies were also acquired at end of treatment. The swimmer plots indicate clinical course and duration of treatment for responders (blue) and nonresponders (red). Performed assays are indicated. (B) Median variant allele frequency of recurrent somatic mutations in bone marrow aspirates at screening grouped by response status across both arms (response [n = 16] and non-response [n = 25] according to study protocol) and study arm. Statistical testing using 2-sided t-test. (C) Changes of HSC score (van Galen et al31) throughout the study. Blue indicates responders; red indicates nonresponders. Statistical testing using Wilcoxon rank-sum test. (D,E) Differential gene-expression analysis of bone marrow core biopsies between responders (n = 6) and NRs (n = 18) across both arms according to study protocol (D) and gene set enrichment analysis (E) FDR, false discovery rate.
Figure 2.
Figure 2.
Single cell bone marrow map of AML. (A) Uniform manifold approximation and projection (UMAP) embedding of single cell transcriptomic profiles of 64 AML bone marrow samples of 18 AML patients (2-5 samples per patient) (refer to supplemental Figure 2-3 for details). The annotated cell types are indicated by the color code. The inset UMAP embeddings show the subclustered myeloid cell compartment at screening colored by annotated cell types (top) and individual patients (bottom). (B-C) Distribution of cell types in screening samples of AML and healthy bone marrow. Differential abundance of myeloid cell types between AML and healthy donors (HD) (C). Statistical testing using Wilcoxon rank-sum test. (D) Genetic deconvolution of 145,595 donor (29% total) and recipient-derived (71%) single cells determines donor chimerism of individual cell types across baseline samples posttransplant (arm A). The bars above the heatmap indicate the total number of donor-derived cells across all myeloid subsets per study subject. ∗Sample at Lead-in. (E) Copy number changes across myeloid cell types identified through inferCNV in AML1012 and AML1016. (F) Comparison of distribution of T/NK cell subsets in AML (n = 18) vs healthy donor (n = 8) bone marrow. Statistical testing using Wilcoxon rank-sum test. (G) Comparison of distribution of T/NK cell subsets in AML posttransplant vs AML/MDS transplant-naïve bone marrow. (H) Clonal T-cell expansion (fraction of T cells sharing the same TCR) across CD4+ and CD8+ T cell subsets with most clonal expansion in effector and memory CD8+ T cells.
Figure 3.
Figure 3.
Stability of T cell compartment during combined decitabine and ipilimumab treatment. (A) Donor chimerism across T/NK cell subsets (left) and longitudinal chimerism of CD4+, CD8+ and NK cells throughout treatment (right) for 8 posttransplant patients (arm A). Statistical testing using Wilcoxon rank-sum test. Shaded areas indicate 95% confidence interval. (B) Changes in TCR repertoire in transplant-naïve and posttransplant samples after decitabine (left) and ipilimumab treatment (right). Break-down by responders (Rs) and NRs shown in inset. Statistical testing using Fisher exact test and FDR correction for individual T-cell clones and Wilcoxon rank-sum test between responders and NRs (FDR < 0.05). (C) Ratio of CD8+ T cell to myeloid cell infiltration in bone marrow core biopsies estimated using quanTIseq from available bulk RNA-seq data of patients across both study arms. (D) Percentage of myeloid cells in screening bone marrow samples of NRs (n = 10) and responders (n = 8) using scRNA-seq data (left). T/NK cell to myeloid ratio for the same patients detailed throughout treatment (right). (E) Differential expression analysis of screening bone marrow plasma profiles between responders (n = 13) and NRs (n = 25) across both study arms. Statistical testing using Wilcoxon rank-sum test and FDR correction for multiple hypothesis testing (FDR < 0.05). (F) Principal component analysis of bone marrow plasma profiles from all available samples (n = 185) colored by clinical response (top) and study arm (bottom). (G) Expression of proteins associated with clinical response throughout treatment in responders and NRs. (H) Decrease in the number of cell-cell interactions detected using CellPhoneDB from scRNA-seq data across different cell subsets following decitabine and ipilimumab in responders (n = 8) compared with NRs (n = 10) and healthy donors (n = 8).
Figure 4.
Figure 4.
Pharmacodynamics of decitabine and ipilimumab. (A) Number of differentially expressed genes across cell types between before decitabine treatment (Screening) and after one cycle of decitabine (Decitabine, Lead-in) from scRNA-seq dataset shows predominantly myeloid-specific effect of decitabine (pink) (Log2FC > 0.25, −log10FDR > 10). (B) Gene set enrichment analysis of differentially expressed genes in myeloid cells. (C) Soluble IL8 in peripheral blood plasma quantified using Olink assay throughout treatment. Statistical testing using Wilcoxon rank-sum test. NPX – Normalized protein expression. (D) Mean gene expression of CXCL8 (encoding IL8) across cell subsets shows preferential expression in CD14+ monocytes and other myeloid cells, while expression is absent in T and NK cells. (E) Number of differentially expressed genes across cell types after 1 cycle of decitabine (Decitabine) and after combined treatment of decitabine and ipilimumab (Ipilimumab) shows ipilimumab-specific effect on CD4+ T cells (blue box) (log2FC > 0.25, −log10FDR > 10). (F) Gene set enrichment analysis of differentially expressed genes in CD4+ T cells. (G) Soluble CXCL13 in peripheral blood plasma throughout treatment quantified using Olink assay. Statistical testing using Wilcoxon rank-sum test. (H-I) Percentage of Tregs in bone marrow aspirates measured using single cell sequencing (H) and multiplexed immunofluorescence (I) shows ipilimumab-induced increase of Tregs. Data from ETCTN 9204 were obtained before (Pre-Ipi) and after (Post-Ipi) ipilimumab monotherapy. Tissue biopsies from ETCTN 9204 were obtained from bone marrow (n = 17) and extramedullary AML sites (skin n = 3; breast n = 2; soft tissue n = 1), while tissue biopsies from ETCTN 10026 were exclusively bone marrow (n = 36). Statistical testing using Wilcoxon rank-sum test. (J) Validation of ipilimumab-induced increase in Tregs (CD3+ FOXP3+) in tissue biopsies from ETCTN/CTEP 10026 study using multiplexed immunofluorescence staining at screening, after 1 cycle of decitabine monotherapy (Decitabine, Lead-in) and after combination treatment (Ipilimumab). NPX, normalized protein expression.
Figure 5.
Figure 5.
Longitudinal tracking of malignant cell clones reveals insufficient clearing from progenitor cell populations. (A) Median variant allele frequency of recurrent somatic mutations in bone marrow aspirates of responders (blue) and NR (red) at screening, after 4 cycles of decitabine and ipilimumab (C4) and at end of treatment. Statistical testing using Wilcoxon rank-sum test. (B) Cancer cell fractions calculated from whole exome sequencing of bone marrow aspirates at screening and C4 in AML1007, AML1008 and AML1019 (all responders). (C) Identification of 2 distinct AML subclones defined by amp(8) in pink and amp(21) in cyan using inferCNV. Longitudinal tracking of both clones within the HSC-like compartment (right). (D) Longitudinal tracking of donor chimerism across myeloid cell subsets of responders (blue) and NRs (red). Disease burden (% blasts) obtained from routine clinical diagnostics with 5% mark indicated by horizontal bar. Grey indicates no data available. (E) Longitudinal detection of copy number changes across myeloid subsets. Grey indicates no data available or too few cells to perform analysis of copy number changes.
Figure 6.
Figure 6.
Comparative analysis of T-cell exhaustion in hematologic and solid malignancies. (A) T-cell exhaustion and memory scores calculated for CD8+ T cells from healthy bone marrow, AML and chronic myeloid leukemia bone marrow and different solid tumors including basal cell carcinoma, bladder cancer and metastatic melanoma. (B) Expression of CTLA-4, PDCD1 (encoding PD-1) and ENTPD1 (encoding CD39) across T-cell subsets in AML bone marrow (top, n = 18 patients) and in metastatic melanoma (bottom, n = 4 patients; Oliveira et al36). (C) Bulk RNA sequencing (RNA-seq) expression of ZNF683 and KLRB1 across 29 AML/MDS bone marrow biopsies with disease involvement and 21 extramedullary AML (eAML) biopsies from patients with sole extramedullary relapse. (D) Ratio of CTLA-4 and KLRB1 to CD3 expression obtained from bulk RNA-seq data across AML/MDS and eAML. Statistical testing using 2-sided t-test. (E) Percentage of CD3+ T-cell infiltrate (left), CD103+ T cells (middle) and FOXP3+ CTLA-4+ T cells (right) compared between bone marrow (BM; n = 10) and leukemia cutis (eAML; n = 10) before treatment. The exceptional responder with ongoing complete remission >3 years after treatment with decitabine and ipilimumab is indicated by the blue arrow. Statistical testing with 2-sided t-test. Medians are indicated for each group by the horizontal bar. (F) Representative single stains of CD3 (white), CD103 (red), CTLA-4 (cyan) and FOXP3 (yellow) for bone marrow (BM) and leukemia cutis (eAML) (top). Integrated staining of CD3, FOXP3 and CTLA-4 is shown for BM and eAML (bottom). The images were captured with 20× optical magnification and 250% zoom. Yellow bars indicate a distance of 50 μm.

Comment in

  • Location, location, location.
    Biernacki MA. Biernacki MA. Blood. 2023 Apr 13;141(15):1782-1783. doi: 10.1182/blood.2023019739. Blood. 2023. PMID: 37052941 No abstract available.

Similar articles

Cited by

References

    1. Papaemmanuil E, Gerstung M, Bullinger L, et al. Genomic classification and prognosis in acute myeloid leukemia. N Engl J Med. 2016;374(23):2209–2221. - PMC - PubMed
    1. Kantarjian H, Kadia T, DiNardo C, et al. Acute myeloid leukemia: current progress and future directions. Blood Cancer J. 2021;11(2) 41-25. - PMC - PubMed
    1. Zeidan AM, Wang R, Wang X, et al. Clinical outcomes of older patients with AML receiving hypomethylating agents: a large population-based study in the United States. Blood Adv. 2020;4(10):2192–2201. - PMC - PubMed
    1. DiNardo CD, Jonas BA, Pullarkat V, et al. Azacitidine and venetoclax in previously untreated acute myeloid leukemia. N Engl J Med. 2020;383(7):617–629. - PubMed
    1. Davids MS, Kim HT, Bachireddy P, et al. Ipilimumab for patients with relapse after allogeneic transplantation. N Engl J Med. 2016;375(2):143–153. - PMC - PubMed

Publication types

MeSH terms

Associated data