

Genetic Perturbation Alters Functional Substates in Alkaline Phosphatase
- PMID: 36706363
- PMCID: PMC9912328
- DOI: 10.1021/jacs.2c06693
Genetic Perturbation Alters Functional Substates in Alkaline Phosphatase
Abstract
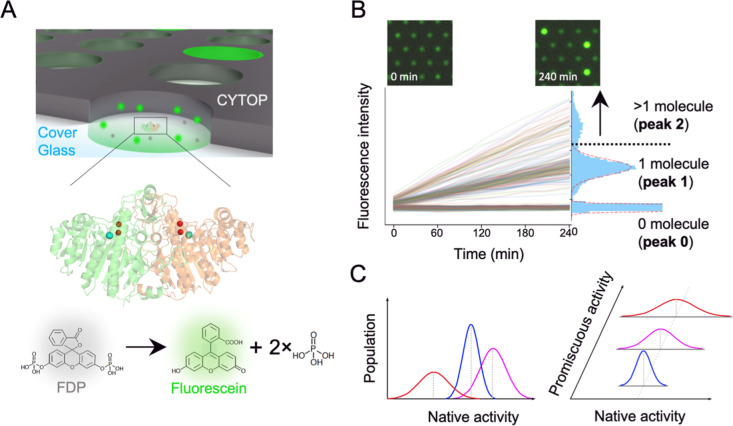
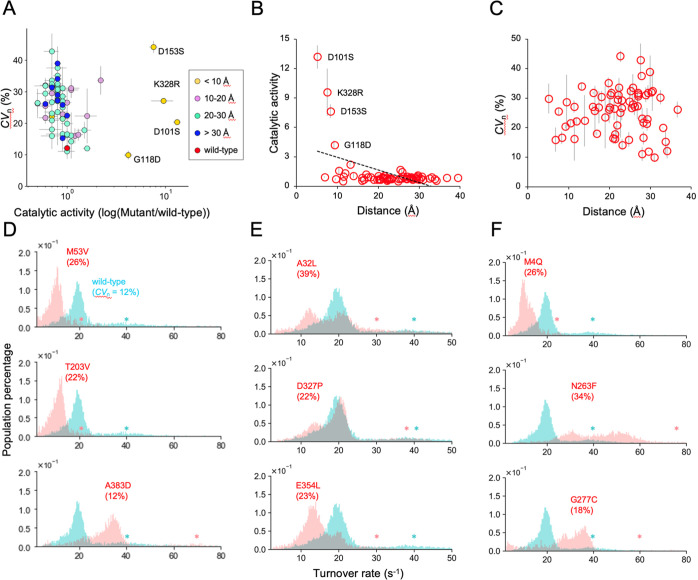
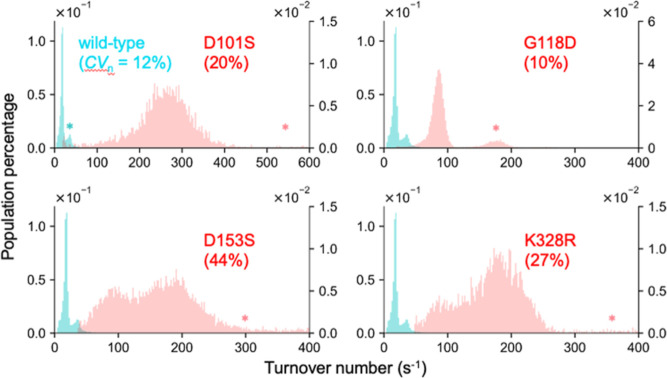
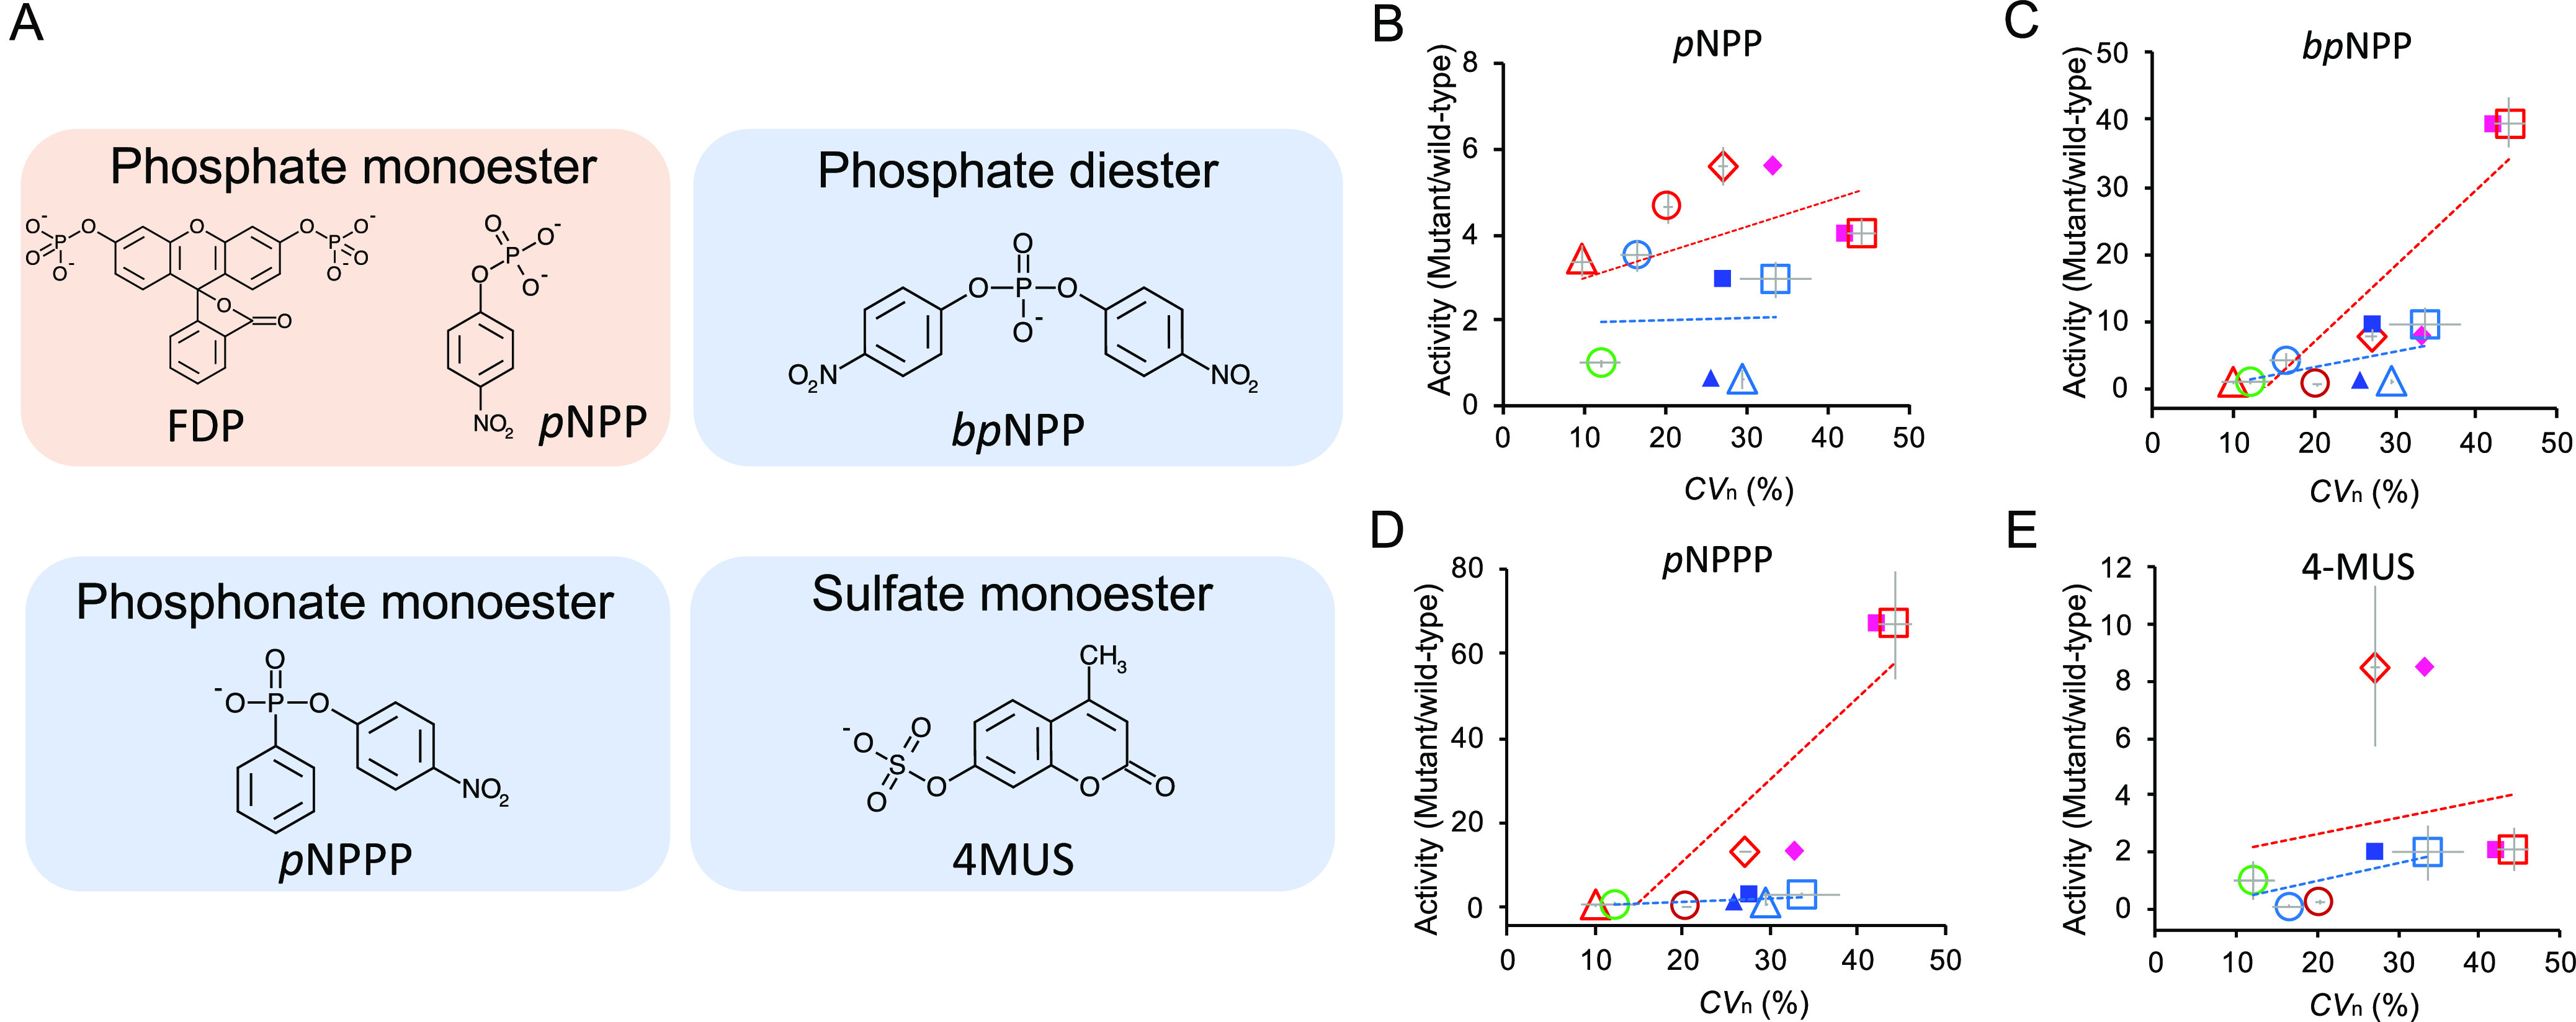
Enzymes inherently exhibit molecule-to-molecule heterogeneity in their conformational and functional states, which is considered to be a key to the evolution of new functions. Single-molecule enzyme assays enable us to directly observe such multiple functional states or functional substates. Here, we quantitatively analyzed functional substates in the wild-type and 69 single-point mutants of Escherichia coli alkaline phosphatase by employing a high-throughput single-molecule assay with a femtoliter reactor array device. Interestingly, many mutant enzymes exhibited significantly heterogeneous functional substates with various types, while the wild-type enzyme showed a highly homogeneous substate. We identified a correlation between the degree of functional substates and the level of improvement in promiscuous activities. Our work provides much comprehensive evidence that the functional substates can be easily altered by mutations, and the evolution toward a new catalytic activity may involve the modulation of the functional substates.
Conflict of interest statement
The authors declare no competing financial interest.
Figures
Similar articles
-
Artificial evolution of an enzyme active site: structural studies of three highly active mutants of Escherichia coli alkaline phosphatase.J Mol Biol. 2002 Mar 1;316(4):941-53. doi: 10.1006/jmbi.2001.5384. J Mol Biol. 2002. PMID: 11884134
-
Characterization of heterodimeric alkaline phosphatases from Escherichia coli: an investigation of intragenic complementation.J Mol Biol. 2000 Dec 8;304(4):645-56. doi: 10.1006/jmbi.2000.4230. J Mol Biol. 2000. PMID: 11099386
-
Improving Escherichia coli alkaline phosphatase efficacy by additional mutations inside and outside the catalytic pocket.Chembiochem. 2001 Aug 3;2(7-8):517-23. doi: 10.1002/1439-7633(20010803)2:7/8<517::AID-CBIC517>3.0.CO;2-H. Chembiochem. 2001. PMID: 11828484
-
Protein conformational populations and functionally relevant substates.Acc Chem Res. 2014 Jan 21;47(1):149-56. doi: 10.1021/ar400084s. Epub 2013 Aug 29. Acc Chem Res. 2014. PMID: 23988159 Review.
-
Gene fusion approaches to membrane protein topology.Soc Gen Physiol Ser. 1993;48:23-37. Soc Gen Physiol Ser. 1993. PMID: 8503047 Review. No abstract available.
Cited by
-
Single-Molecule Enzyme Activity Analysis for Illuminating Pathological Proteoforms.ACS Cent Sci. 2025 Jun 17;11(7):1041-1051. doi: 10.1021/acscentsci.5c00100. eCollection 2025 Jul 23. ACS Cent Sci. 2025. PMID: 40726794 Free PMC article. Review.
-
Bacteriophage Φ21's receptor-binding protein evolves new functions through destabilizing mutations that generate non-genetic phenotypic heterogeneity.Virus Evol. 2024 Jul 11;10(1):veae049. doi: 10.1093/ve/veae049. eCollection 2024. Virus Evol. 2024. PMID: 39170727 Free PMC article.
-
Viral Receptor-Binding Protein Evolves New Function through Mutations That Cause Trimer Instability and Functional Heterogeneity.Mol Biol Evol. 2024 Apr 2;41(4):msae056. doi: 10.1093/molbev/msae056. Mol Biol Evol. 2024. PMID: 38586942 Free PMC article.
-
Functional analysis of single enzymes combining programmable molecular circuits with droplet-based microfluidics.Nat Nanotechnol. 2024 Jun;19(6):800-809. doi: 10.1038/s41565-024-01617-1. Epub 2024 Feb 26. Nat Nanotechnol. 2024. PMID: 38409552
-
Single molecule-driven nanomotors reveal the dynamic-disordered chemomechanical transduction of active enzymes.Sci Adv. 2025 Jan 31;11(5):eads0446. doi: 10.1126/sciadv.ads0446. Epub 2025 Jan 31. Sci Adv. 2025. PMID: 39888997 Free PMC article.
References
Publication types
MeSH terms
Substances
LinkOut - more resources
Full Text Sources
