. 2023 Mar 13;33(5):807-816.e4.
doi: 10.1016/j.cub.2023.01.008. Epub 2023 Jan 26.

Stochastic phenotypes in RAS-dependent developmental diseases

Affiliations

Stochastic phenotypes in RAS-dependent developmental diseases

Robert A Marmion et al. Curr Biol. .

Abstract

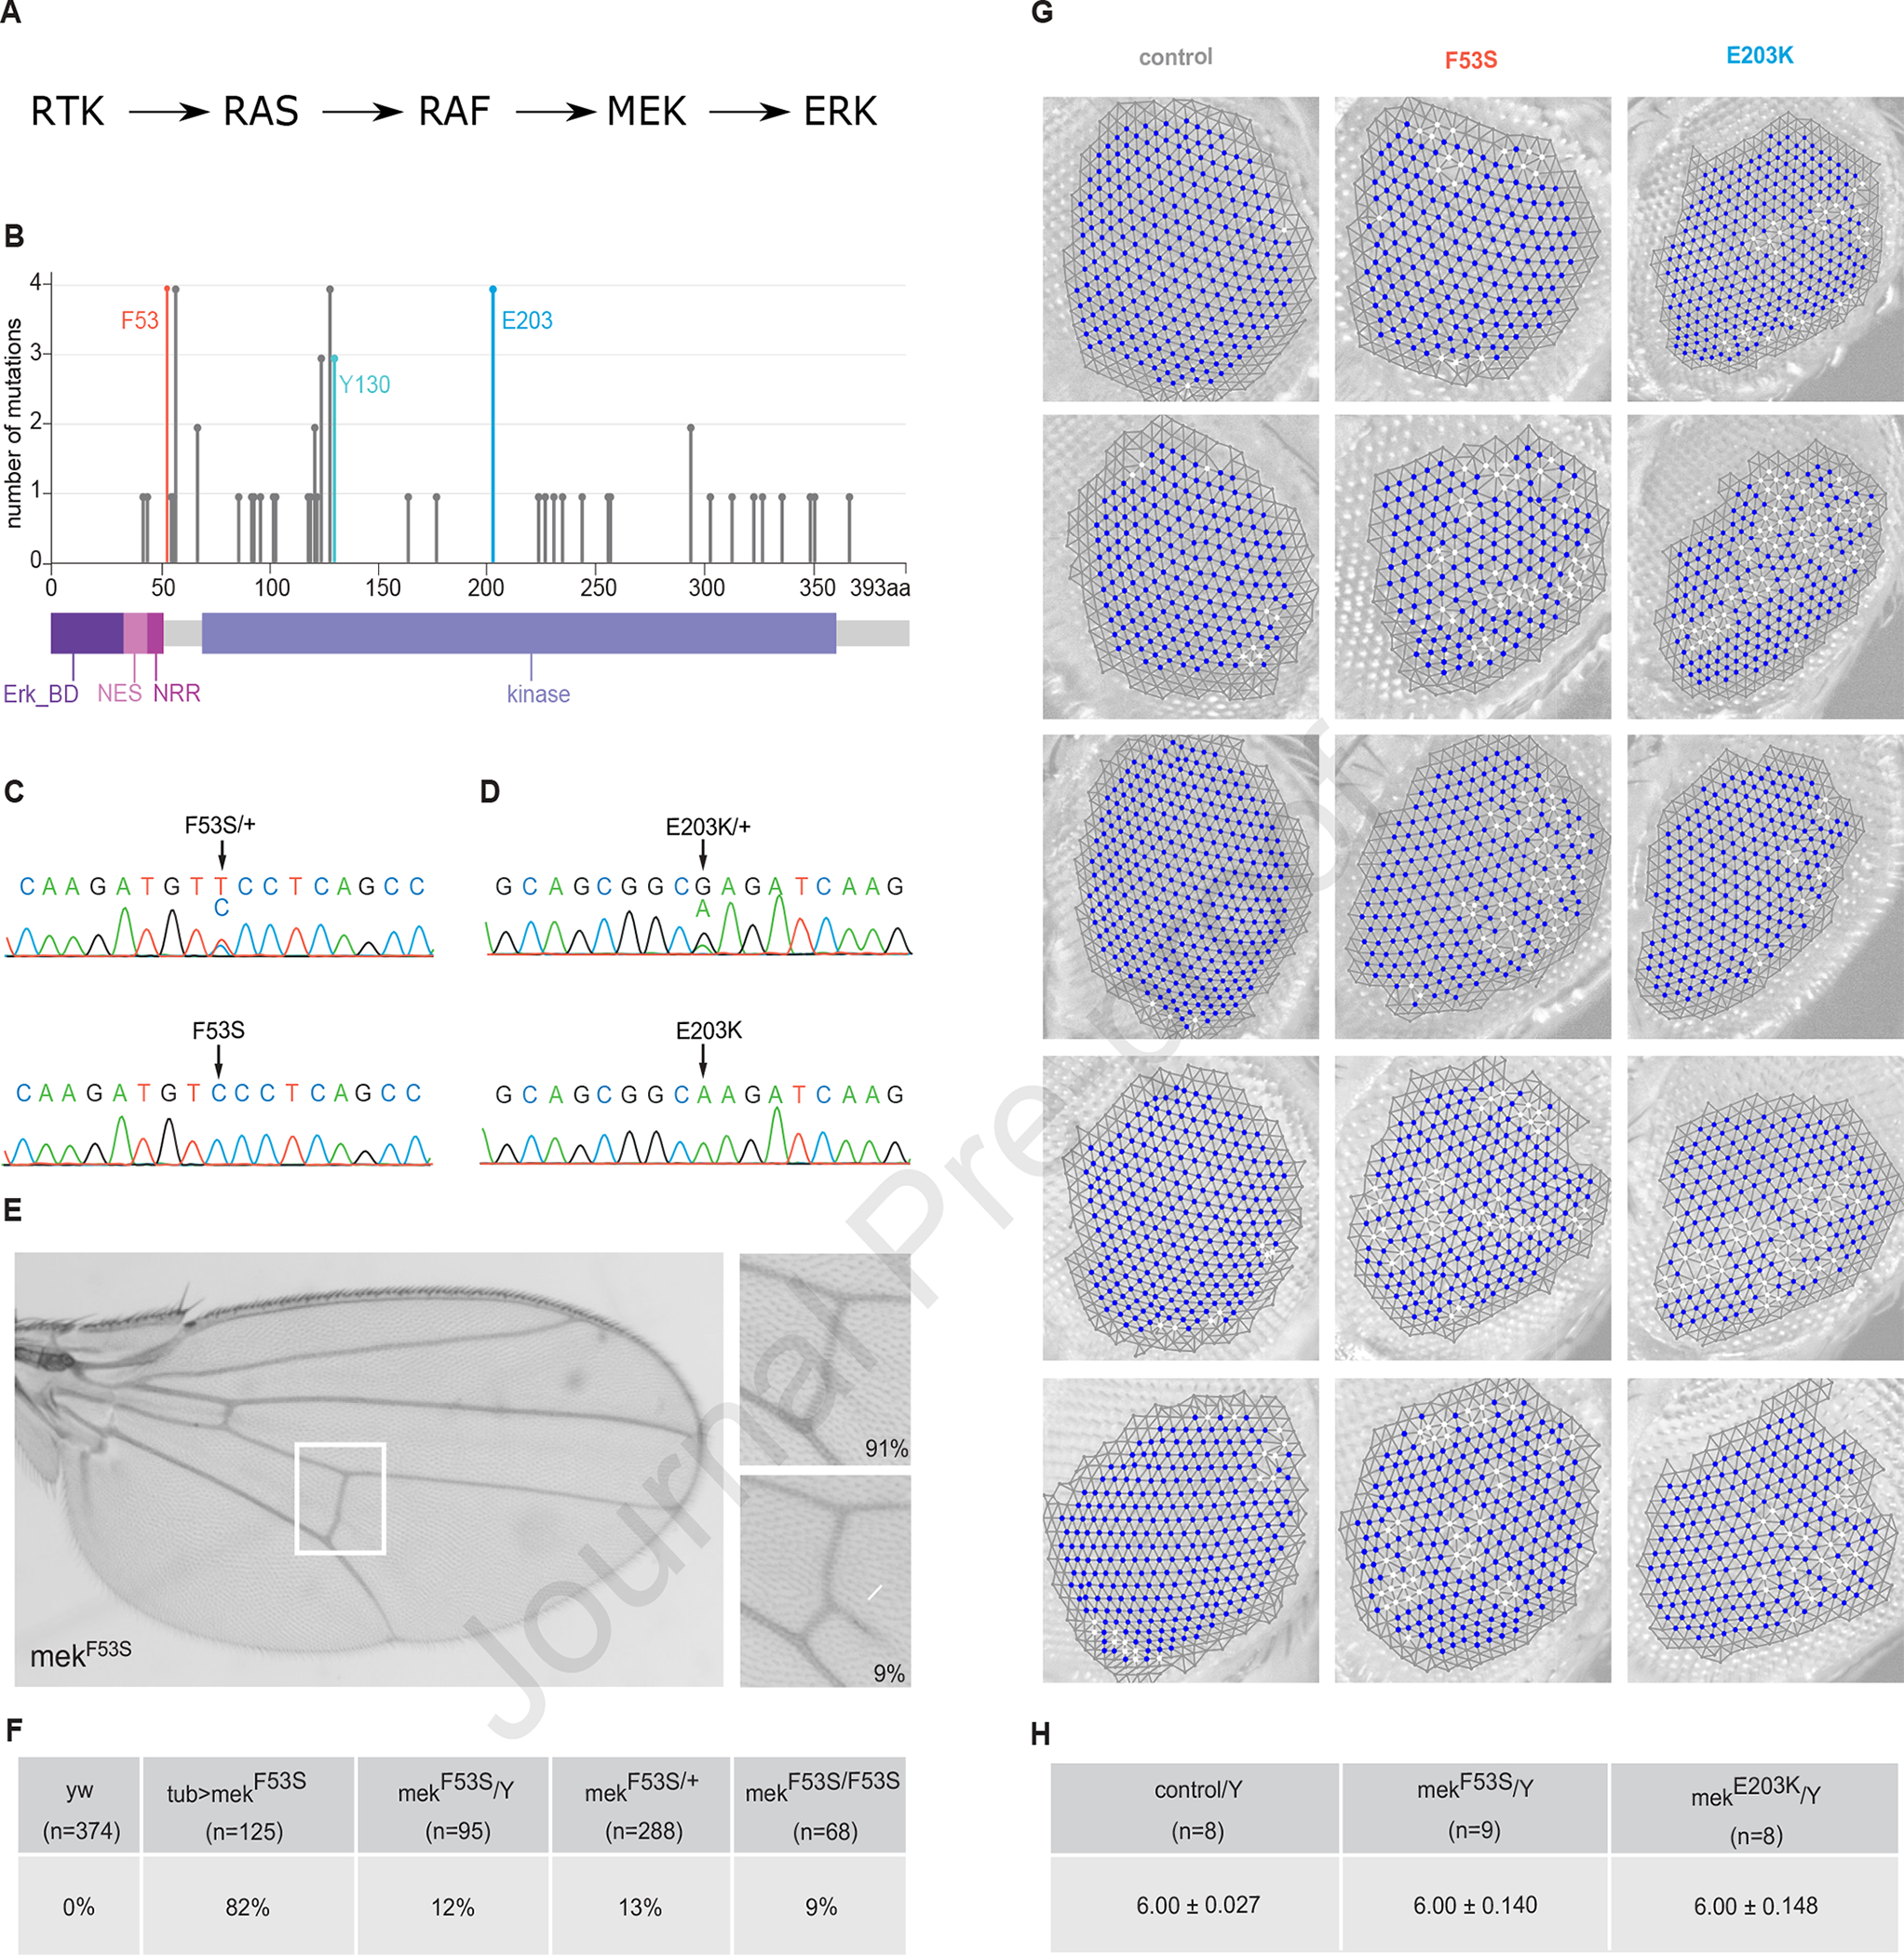
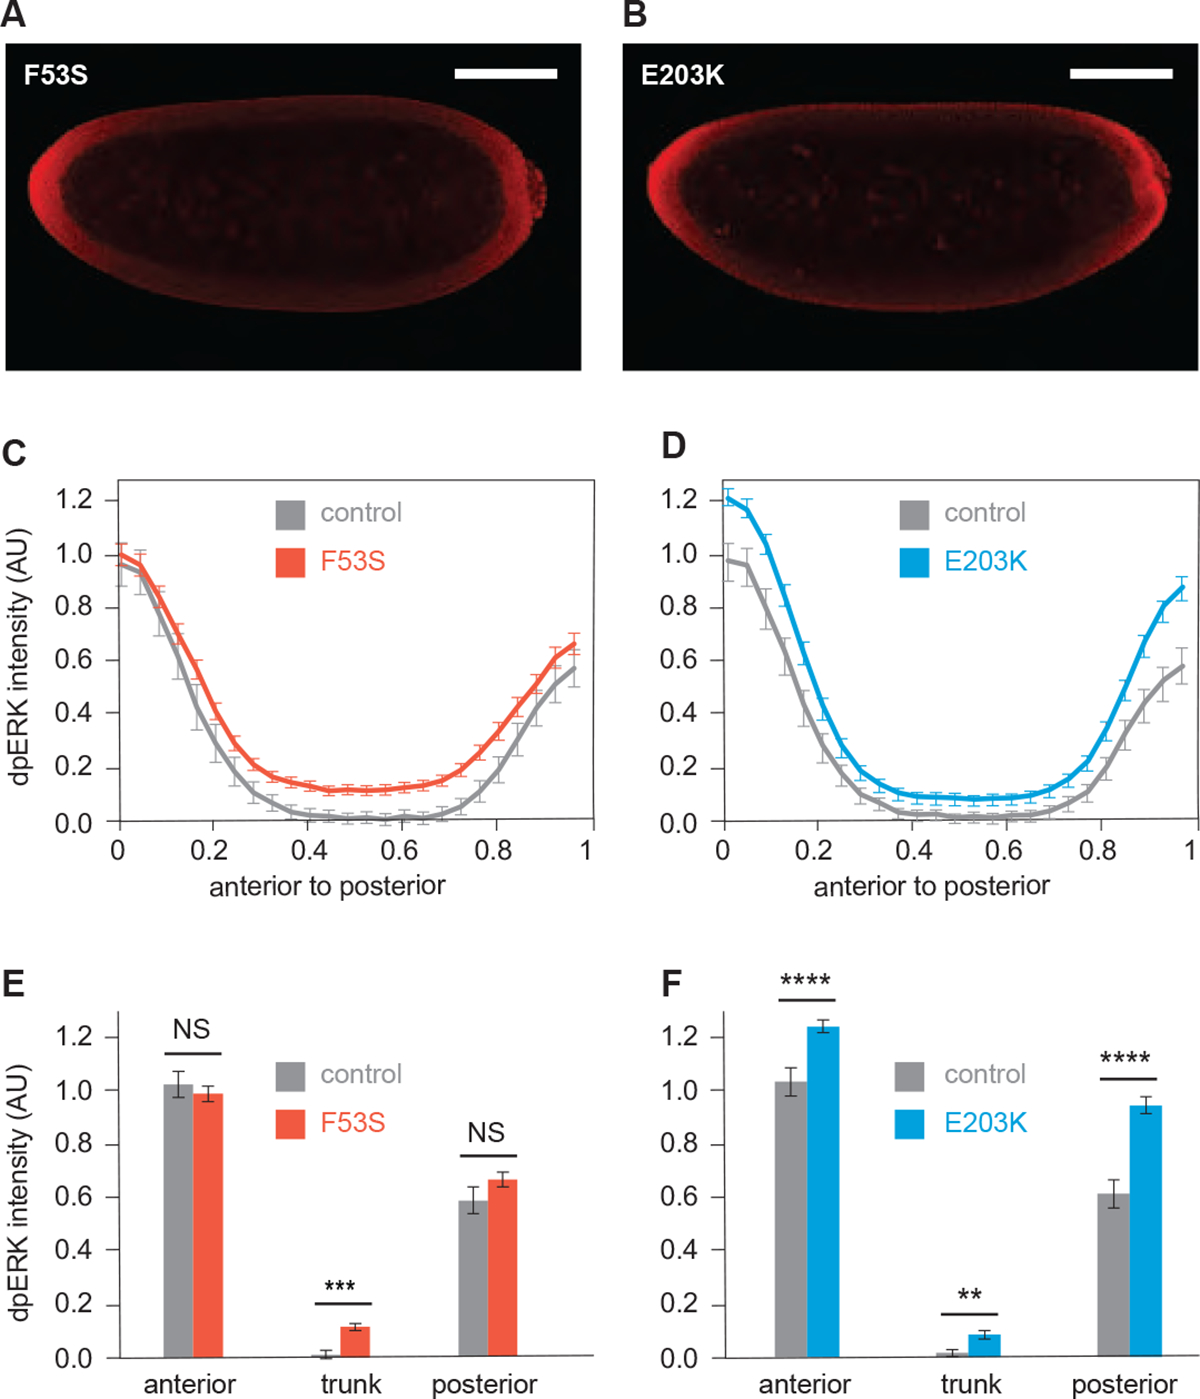
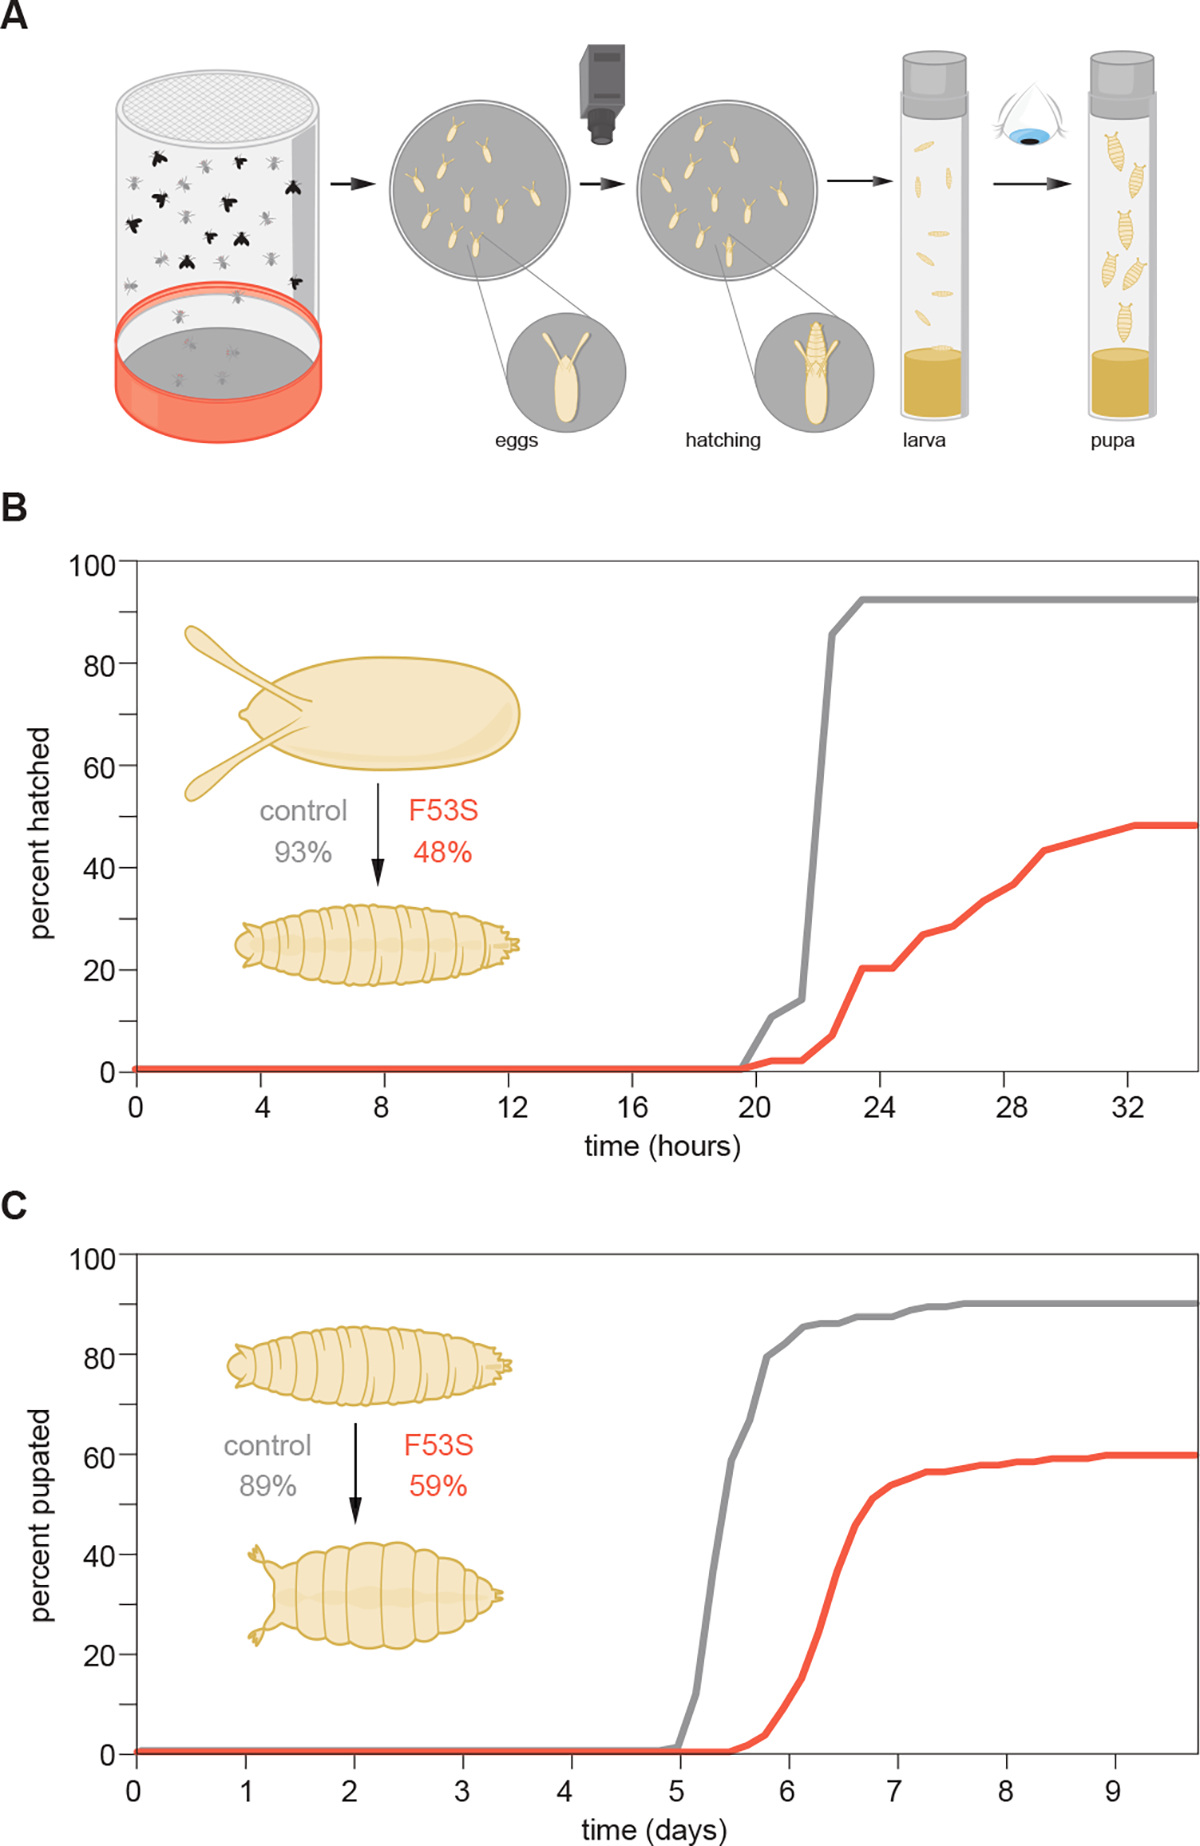
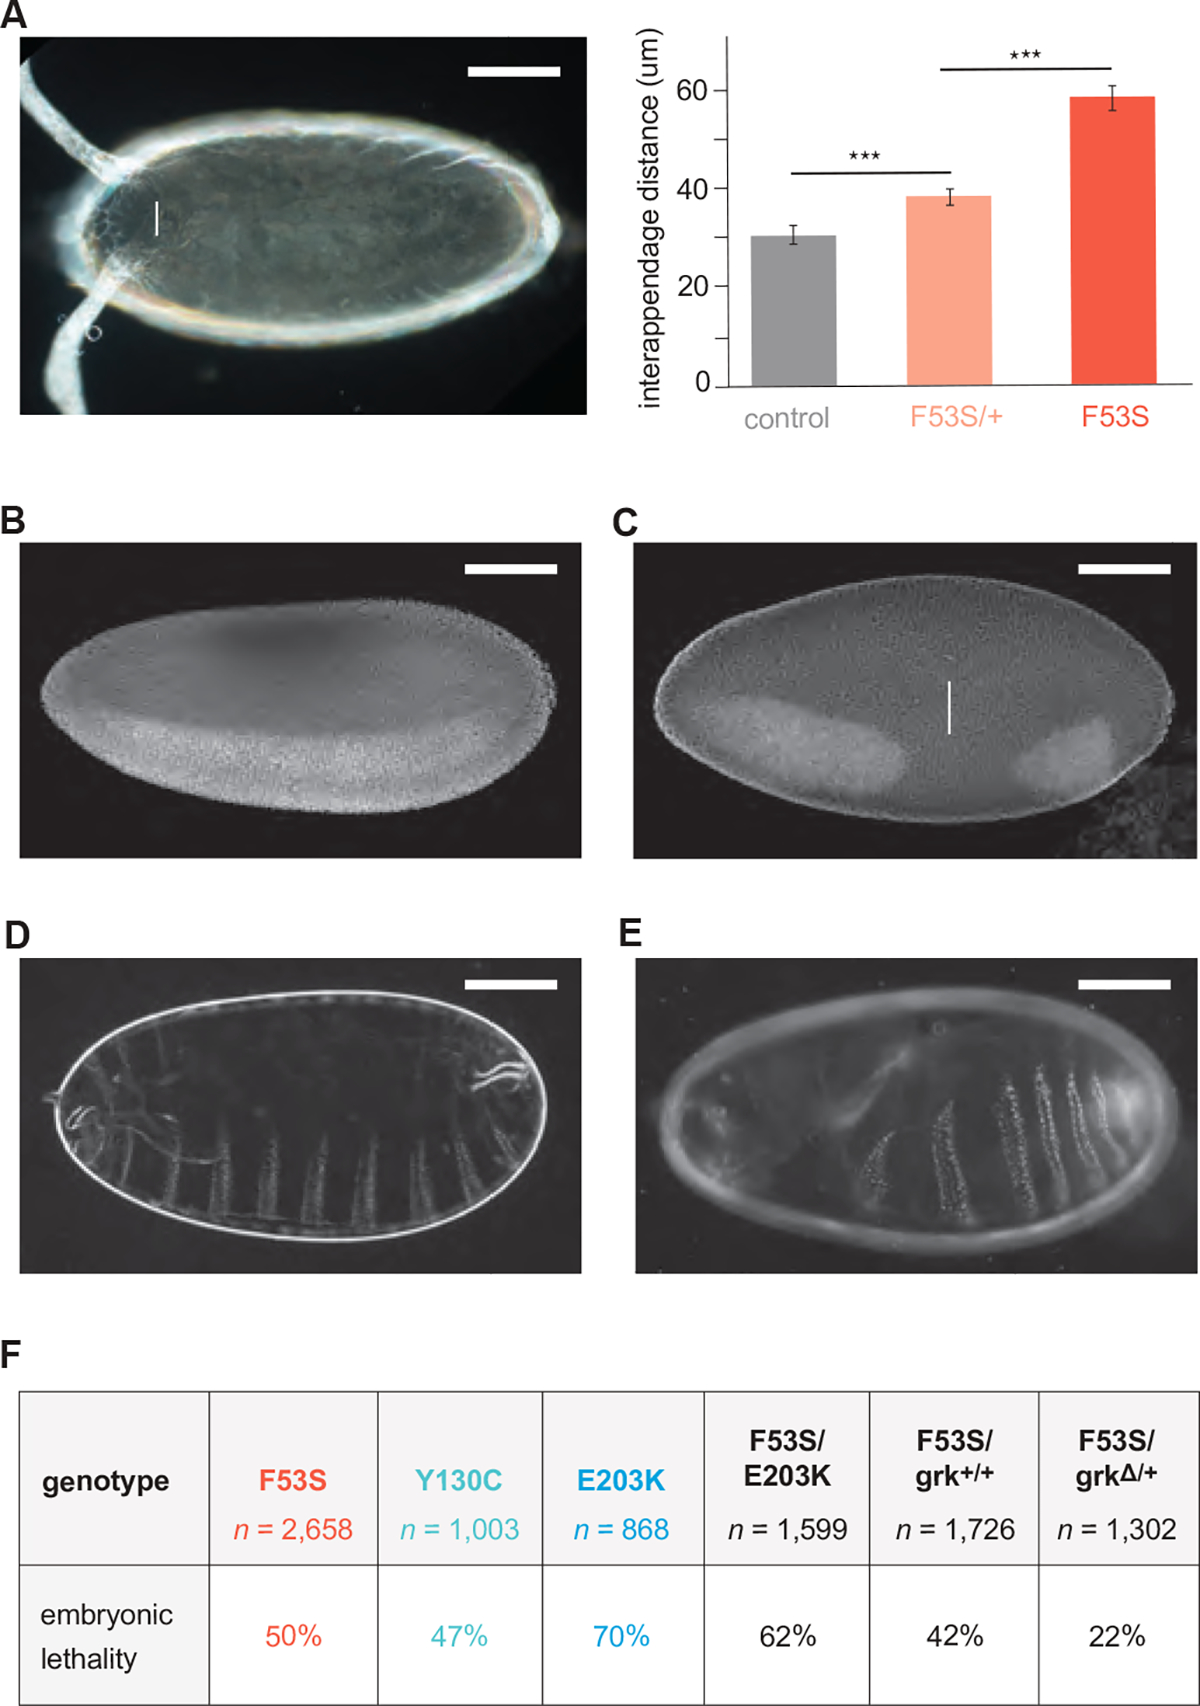
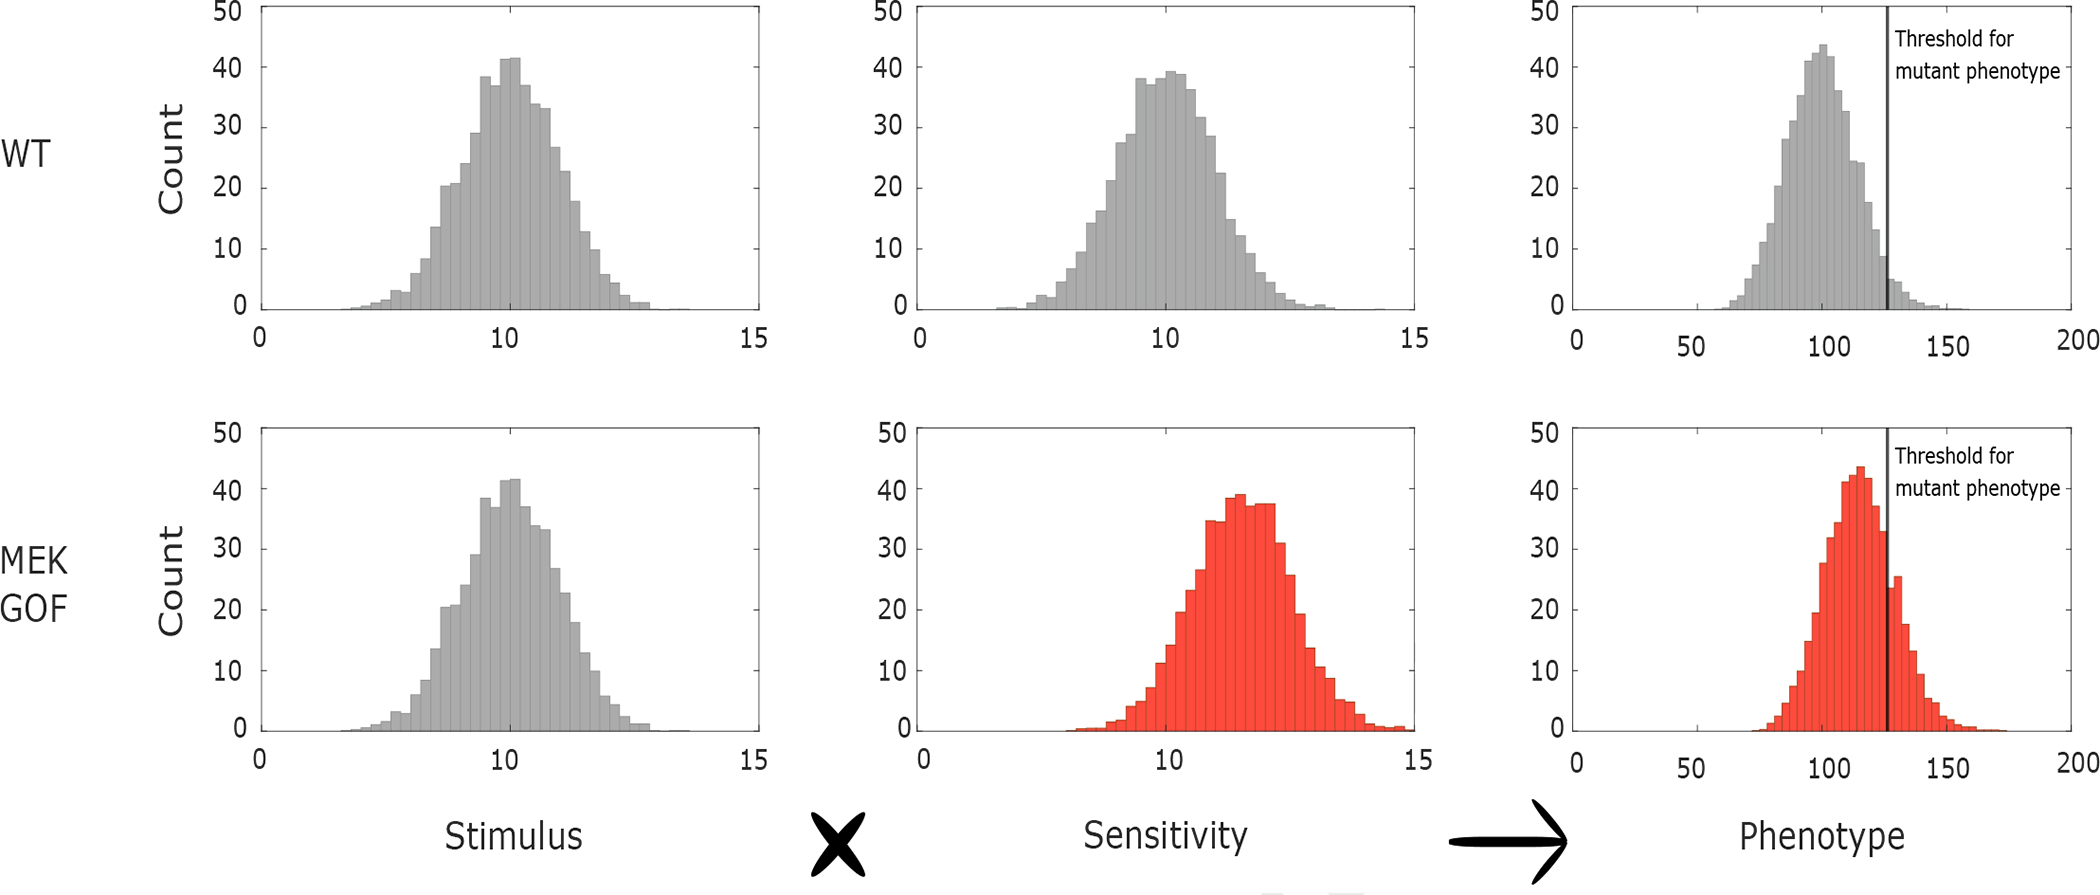
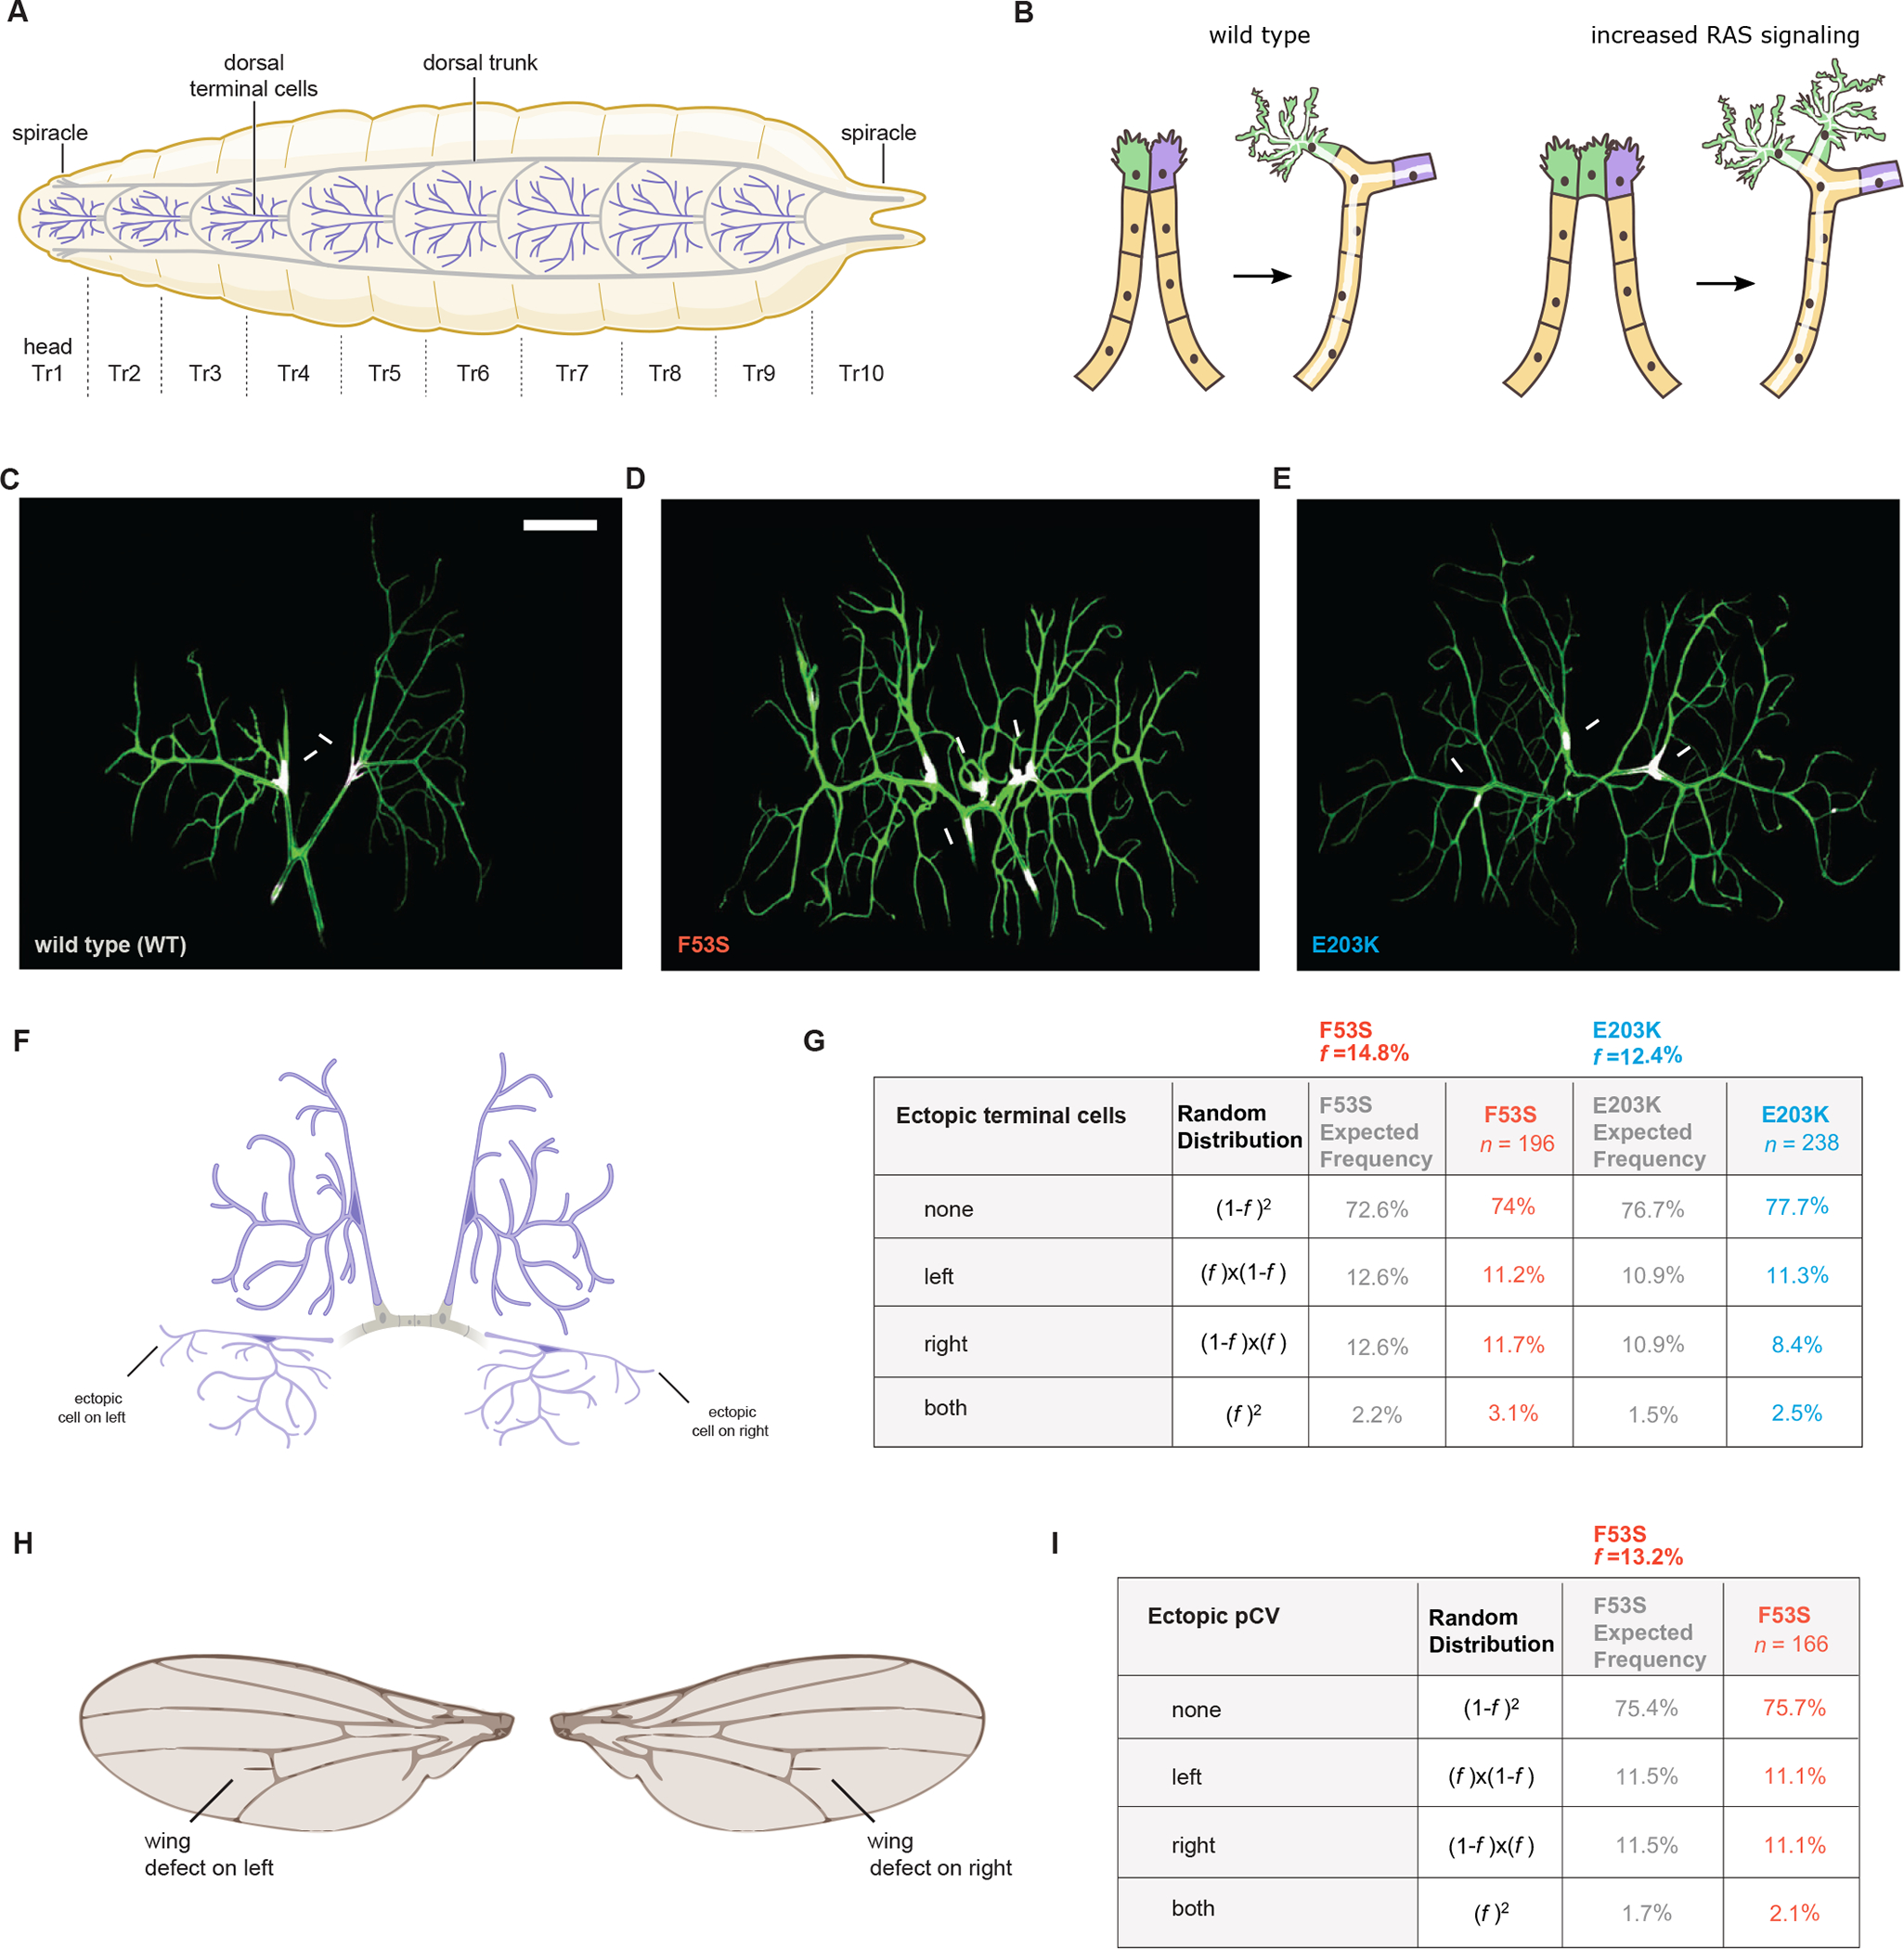
Germline mutations upregulating RAS signaling are associated with multiple developmental disorders. A hallmark of these conditions is that the same mutation may present vastly different phenotypes in different individuals, even in monozygotic twins. Here, we demonstrate how the origins of such largely unexplained phenotypic variations may be dissected using highly controlled studies in Drosophila that have been gene edited to carry activating variants of MEK, a core enzyme in the RAS pathway. This allowed us to measure the small but consistent increase in signaling output of such alleles in vivo. The fraction of mutation carriers reaching adulthood was strongly reduced, but most surviving animals had normal RAS-dependent structures. We rationalize these results using a stochastic signaling model and support it by quantifying cell fate specification errors in bilaterally symmetric larval trachea, a RAS-dependent structure that allows us to isolate the effects of mutations from potential contributions of genetic modifiers and environmental differences. We propose that the small increase in signaling output shifts the distribution of phenotypes into a regime, where stochastic variation causes defects in some individuals, but not in others. Our findings shed light on phenotypic heterogeneity of developmental disorders caused by deregulated RAS signaling and offer a framework for investigating causal effects of other pathogenic alleles and mild mutations in general.


Conflict of interest statement

Declaration of interests The authors declare no competing interests.

Figures

Figure 1.
Figure 1.. Activating mutations cause defects with incomplete penetrance and expressivity.
(A) Schematic of RTK/RAS signaling to ERK through MEK. (B) Manhattan plot of number of mutations per amino acid residue in human disease. The position for F53S, a mutation that is the focus of this study is indicated in red. The positions for Y130C and E203K are indicated in teal and blue accordingly. (C) Sanger sequencing of a heterozygote depicting SNP coding for non-synonymous mutation F53S (top); genotype: y,w,mekF53S/y,sc,v. The wild-type thymine is detected together with the mutant cytosine (arrow). Sanger sequencing of a homozygote depicting SNP coding for non-synonymous mutation F53S (bottom); genotype: y,w,mekF53S/y,w,mekF53S. (D) Sanger sequencing of a heterozygote depicting SNP coding for non-synonymous mutation E203K (top); genotype: y,w,mekE203K/y,sc,v. The wild-type guanine is detected together with the mutant adenine (arrow). Sanger sequencing of a homozygote depicting SNP coding for non-synonymous mutation E203K (bottom); genotype: y,w,mekE203K/y,w,mekE203K. (E) Posterior crossveins in mutant wings. Posterior crossvein (boxed area) can be quantified for comparison of mutant MEK overexpression vs mutant MEK at normal levels of expression. (top inset) Most wings are phenotypically wild-type. (bottom inset) A subset of wings display ectopic crossveins. (F) Frequencies of ectopic cross veins in gene-edited flies and in flies where MEK was overexpressed. (G) Defects (white) in the hexagonal patterning of ommatidia in F53S and E203K males. (H) The average degree per eye does not change; however, the variance in mutant eyes is significantly increased. See also Figure S1 for more information on the generation of MEK alleles.
Figure 2.
Figure 2.. Activating mutations cause mild increases of ERK activation.
(A, B) Representative images of nuclear cycle 14 embryos stained for active, dually phosphorylated ERK (dpERK) for different genetic backgrounds. Scale bar, 100 μm. (C, D) Pairwise comparisons of dpERK profiles in nuclear cycle 14 embryos for wild type (gray) and mutant (red) embryos. (C) WT (n=13) and mekF53S (n=46). (D) WT (n=17) and mekE203K (n=40). Error bars denote standard error of the mean. (E, F) Comparative analysis of dpERK levels in the anterior, middle, and posterior regions of the embryo. The analysis performed corresponds to the same embryo data used to generate the spatial plots in C, D. P values were obtained by Student’s t-test (two-sided, homoscedastic): **** P < 0.0001, ** P < 0.01, NS: P > 0.05. Error bars denote standard error of the mean.
Figure 3.
Figure 3.. Activating mutations cause developmental delay and lethality.
(A) Schematic of time course measurements of egg hatching as well as the L1 to pupal transition, in time after egg lay (AEL). Eggs were collected for 1 hour then monitored by video at 2-minute intervals. L1 larvae were moved to food vials at 26 hours (AEL) and monitored for pupation on 4-hour intervals. (B) Embryo hatching time course from y,w females (grey) or homozygous mekF53S females (red). Mutant embryos (n=60) experience a delay in hatching compared to y,w (grey) (n=29) (P=5.2e-14). There is also a viability decrease from 93% to 48%. (C) Pupation of mutant larvae (n=150) is delayed to y,w controls (n=150) (P=8.1e-13). There is also a viability decrease from 89% to 59%. All P-values determined by Fisher’s exact test at 50%.
Figure 4.
Figure 4.. Activating mutations cause eggshell patterning defects.
(A) Homozygous mekF53S females lay eggs with markedly increased interappendage distance (arrows). Bar graph displays average measured interappendage distances of eggshells from heterozygous (pink, n=32) and homozygous mekF53S females (red, n=29) compared to the y,w control (grey, n=34). P values are obtained by Student’s t-test (two-sided, homoscedastic): *** P < 0.001. Error bars denote standard error of the mean. All scale bars, 100 μm. (B, C) Sna antibody stainings of homozygous mekF53S embryos at nuclear cycle 14. (B) The majority of embryos have normal DV patterning as observed by Snail (Sna), a marker of ventral mesoderm. (C) A fraction of embryos shows discontinuities in Snail (3/11). (D, E) Cuticle preparations of dead embryos. (D) Embryos with normal cuticle morphology that do not hatch (n=310). (E) Dorsalized embryos (n=32). Anterior ventral structures are missing, and the head is misshapen.

(F) Table of embryonic lethality of MEK variants and rescue by half-dose gurken (grk). CRISPR PAM derived flies that lack coding changes are used as controls. mekF53S and mekY130C have the same control; lethality = 16% (n=1,770). mekE203K control; lethality = 13% (n=1,299). mekF53S (n=2,658). mekY130C (n=1,003). mekE230K (n=868). mekF53S/E203K (n=1,599). mekF53S; grk+/+ (n=1,726). mekF53S; grk Δ/+ (n=1,302).
Figure 5.
Figure 5.. Conceptual model of sensitization of signaling by mutant MEK.
In a conceptual model of wild type, both the stimulus and pathway sensitivity of the responding cell are variable (top row). Stochasticity in these variables leads to a distribution in the output phenotype. A substantially high level of signaling is required for induction of the mutant phenotype in wild type animals. In the case of MEK gain-of-function (GOF), increased MEK kinase activity sensitizes the patterning system to normal levels of ligand and results in increased numbers of patterning defects, uncovering more animals with the mutant phenotype (bottom row). Stimulus, sensitivity, and phenotype are in arbitrary units (AU).
Figure 6.
Figure 6.. Experimental tests of stochastic model of variable phenotypes.
(A) Schematic of the dorsal pairs of terminal cells of the trachea. (B) In wild type, two leader cells are drawn towards a source of Branchless (Bnl). Later, one leader cell becomes the fusion cell and the other differentiates into a terminal cell. Increased signaling by multiple genetic perturbations leads to increased numbers of leader cells. Ectopic leader cells become terminal cells in many contexts. (C-E) Representative Tr7 metameres from WT and mutant larvae co-expressing cytosolic eGFP to mark the cellular branching and NLS-DsRed to mark individual nuclei of terminal cells (white/arrow), both under control of btl::GAL4. (D) WT metameres are almost exclusively found as a pair of cells (arrows). (E) Ectopic terminal cells are regularly found in larvae with mekF53S (55/200 examined metameres vs 6/160 examined metameres in PAM control; 4/25 normal F53S individuals vs 15/20 normal control individuals. (ectopic cells: P=2.4e-9; normal individuals: P=6.8e-5). (F) Ectopic cells are also abundant in larvae with mekE203K (54/240 examined metameres vs 7/200 examined metameres in PAM control; 4/30 normal 203K individuals vs 19/25 normal control individuals. (ectopic cells: P=9.3e-9; normal individuals: P=2.4e-6). All scale bars, 100 μm. P values are obtained by Pearson’s chi-squared test of homogeneity in mutants vs control. (F) Induction of ectopic terminal cells within the larval tracheal system appear to be randomly distributed. They can be found on either side of a metamere, or on both sides of a metamere. (G) Table showing distribution of ectopic terminal cells. Cumulative frequencies are expected if induction on either side is independent. Frequency (f) is derived from the fraction of metamere halves that contain an ectopic cell. Cumulative frequencies (black) are used to calculate expected distributions (grey) and can be compared to observed distributions for mekF53S (red) (P=0.29) and mekE203K (blue) (P=0.15). Any metamere where the side could not be determined was removed. (H) Induction of ectopic posterior crossvein (pCV) vein of the adult wing appears to be randomly distributed. They may be found on either wing, or on both wings of an individual. (I) Table showing distribution of ectopic posterior crossveins. Cumulative frequencies are expected if induction on either side is independent. Frequency (f) is derived from the fraction of wings that contain an ectopic pCV. Cumulative frequencies (black) are used to calculate expected distributions (grey) and can be compared to observed distributions for mekF53S (red) (P=0.72). P-values are obtained by Pearson’s chi-squared test of independence of defects between the two sides.

Similar articles

Cited by

References

    1. Maher GJ, Ralph HK, Ding Z, Koelling N, Mlcochova H, Giannoulatou E, Dhami P, Paul DS, Stricker SH, Beck S, et al. (2018). Selfish mutations dysregulating RAS-MAPK signaling are pervasive in aged human testes. Genome Res 28, 1779–1790. 10.1101/gr.239186.118. - DOI - PMC - PubMed
    1. Fan J, Li Y, Jia R, and Fan X (2018). An inherited FGFR2 mutation increased osteogenesis gene expression and result in Crouzon syndrome. BMC Med Genet 19, 91. 10.1186/s12881-018-0607-8. - DOI - PMC - PubMed
    1. Anderson J, Burns HD, Enriquez-Harris P, Wilkie AO, and Heath JK (1998). Apert syndrome mutations in fibroblast growth factor receptor 2 exhibit increased affinity for FGF ligand. Hum Mol Genet 7, 1475–1483. 10.1093/hmg/7.9.1475. - DOI - PubMed
    1. Rauen KA (2013). The RASopathies. Annu Rev Genomics Hum Genet 14, 355–369. 10.1146/annurev-genom-091212-153523. - DOI - PMC - PubMed
    1. Jafry M, and Sidbury R (2020). RASopathies. Clin Dermatol 38, 455–461. 10.1016/j.clindermatol.2020.03.010. - DOI - PubMed

Publication types

LinkOut - more resources