

Enrichment of oral-derived bacteria in inflamed colorectal tumors and distinct associations of Fusobacterium in the mesenchymal subtype
- PMID: 36706753
- PMCID: PMC9975273
- DOI: 10.1016/j.xcrm.2023.100920
Enrichment of oral-derived bacteria in inflamed colorectal tumors and distinct associations of Fusobacterium in the mesenchymal subtype
Abstract
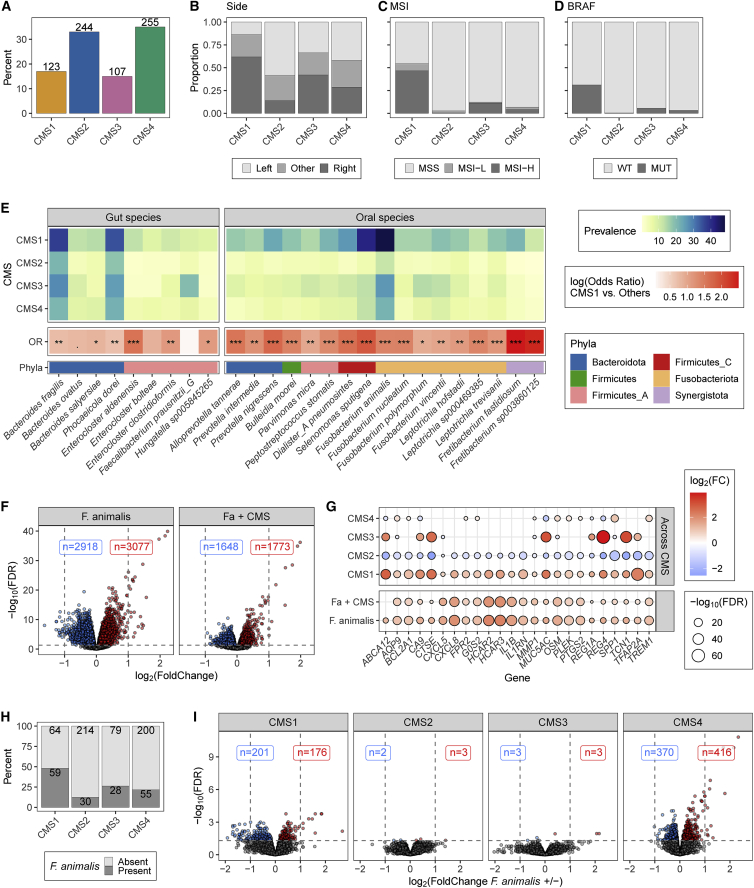
While the association between colorectal cancer (CRC) features and Fusobacterium has been extensively studied, less is known of other intratumoral bacteria. Here, we leverage whole transcriptomes from 807 CRC samples to dually characterize tumor gene expression and 74 intratumoral bacteria. Seventeen of these species, including 4 Fusobacterium spp., are classified as orally derived and are enriched among right-sided, microsatellite instability-high (MSI-H), and BRAF-mutant tumors. Across consensus molecular subtypes (CMSs), integration of Fusobacterium animalis (Fa) presence and tumor expression reveals that Fa has the most significant associations in mesenchymal CMS4 tumors despite a lower prevalence than in immune CMS1. Within CMS4, the prevalence of Fa is uniquely associated with collagen- and immune-related pathways. Additional Fa pangenome analysis reveals that stress response genes and the adhesion FadA are commonly expressed intratumorally. Overall, this study identifies oral-derived bacteria as enriched in inflamed tumors, and the associations of bacteria and tumor expression are context and species specific.
Keywords: Fusobacterium; TCGA; cancer; colorectal cancer; gut microbiome; intratumoral bacteria; microbiome; microbiota; oral microbiome; pangenome.
Copyright © 2023 The Authors. Published by Elsevier Inc. All rights reserved.
Conflict of interest statement
Declaration of interests O.M., J.R., D.R.N., Z.M., and A.L.B. are Genentech/Roche employees. B.S.Y. and M.L.A. were Genentech/Roche employees.
Figures


Similar articles
-
Intratumoral Fusobacterium nucleatum abundance correlates with macrophage infiltration and CDKN2A methylation in microsatellite-unstable colorectal carcinoma.Virchows Arch. 2017 Sep;471(3):329-336. doi: 10.1007/s00428-017-2171-6. Epub 2017 Jun 8. Virchows Arch. 2017. PMID: 28597080
-
Host-microbiota interactions contributing to the heterogeneous tumor microenvironment in colorectal cancer.Physiol Genomics. 2024 Feb 1;56(2):221-234. doi: 10.1152/physiolgenomics.00103.2023. Epub 2023 Dec 11. Physiol Genomics. 2024. PMID: 38073489
-
Virulence factor discovery identifies associations between the Fic gene family and Fap2+ fusobacteria in colorectal cancer microbiomes.mBio. 2025 Feb 5;16(2):e0373224. doi: 10.1128/mbio.03732-24. Epub 2025 Jan 14. mBio. 2025. PMID: 39807864 Free PMC article.
-
The Evolving Role of Consensus Molecular Subtypes: a Step Beyond Inpatient Selection for Treatment of Colorectal Cancer.Curr Treat Options Oncol. 2021 Nov 6;22(12):113. doi: 10.1007/s11864-021-00913-5. Curr Treat Options Oncol. 2021. PMID: 34741675 Review.
-
Association of Fusobacterium nucleatum with immunity and molecular alterations in colorectal cancer.World J Gastroenterol. 2016 Jan 14;22(2):557-66. doi: 10.3748/wjg.v22.i2.557. World J Gastroenterol. 2016. PMID: 26811607 Free PMC article. Review.
Cited by
-
Reexamining the role of Fusobacterium nucleatum subspecies in clinical and experimental studies.Gut Microbes. 2024 Jan-Dec;16(1):2415490. doi: 10.1080/19490976.2024.2415490. Epub 2024 Oct 12. Gut Microbes. 2024. PMID: 39394990 Free PMC article. Review.
-
Fusobacterium nucleatum infection modulates the transcriptome and epigenome of HCT116 colorectal cancer cells in an oxygen-dependent manner.Commun Biol. 2024 May 8;7(1):551. doi: 10.1038/s42003-024-06201-w. Commun Biol. 2024. PMID: 38720110 Free PMC article.
-
Porphyromonas gingivalis, a bridge between oral health and immune evasion in gastric cancer.Front Oncol. 2024 May 14;14:1403089. doi: 10.3389/fonc.2024.1403089. eCollection 2024. Front Oncol. 2024. PMID: 38807771 Free PMC article.
-
Collagen remodeling-mediated signaling pathways and their impact on tumor therapy.J Biol Chem. 2025 Mar;301(3):108330. doi: 10.1016/j.jbc.2025.108330. Epub 2025 Feb 19. J Biol Chem. 2025. PMID: 39984051 Free PMC article. Review.
-
Intratumor microbiota in cancer pathogenesis and immunity: from mechanisms of action to therapeutic opportunities.Front Immunol. 2023 Oct 6;14:1269054. doi: 10.3389/fimmu.2023.1269054. eCollection 2023. Front Immunol. 2023. PMID: 37868956 Free PMC article. Review.
References
-
- Lee K.-H., Chen W.-S., Jiang J.-K., Yang S.-H., Wang H.-S., Chang S.-C., Lan Y.-T., Lin C.-C., Lin H.-H., Huang S.-C., et al. The efficacy of anti-EGFR therapy in treating metastatic colorectal cancer differs between the middle/low rectum and the left-sided colon. Br. J. Cancer. 2021;125:816–825. doi: 10.1038/s41416-021-01470-2. - DOI - PMC - PubMed
-
- Thomas A.M., Manghi P., Asnicar F., Pasolli E., Armanini F., Zolfo M., Beghini F., Manara S., Karcher N., Pozzi C., et al. Metagenomic analysis of colorectal cancer datasets identifies cross-cohort microbial diagnostic signatures and a link with choline degradation. Nat. Med. 2019;25:667–678. doi: 10.1038/s41591-019-0405-7. - DOI - PMC - PubMed
MeSH terms
Supplementary concepts
LinkOut - more resources
Full Text Sources
Medical
Research Materials
Miscellaneous
