. 2023 Apr 5;111(7):1118-1135.e5.
doi: 10.1016/j.neuron.2022.12.034. Epub 2023 Jan 26.

Local 5-HT signaling bi-directionally regulates the coincidence time window for associative learning

Affiliations

Local 5-HT signaling bi-directionally regulates the coincidence time window for associative learning

Jianzhi Zeng et al. Neuron. .

Abstract

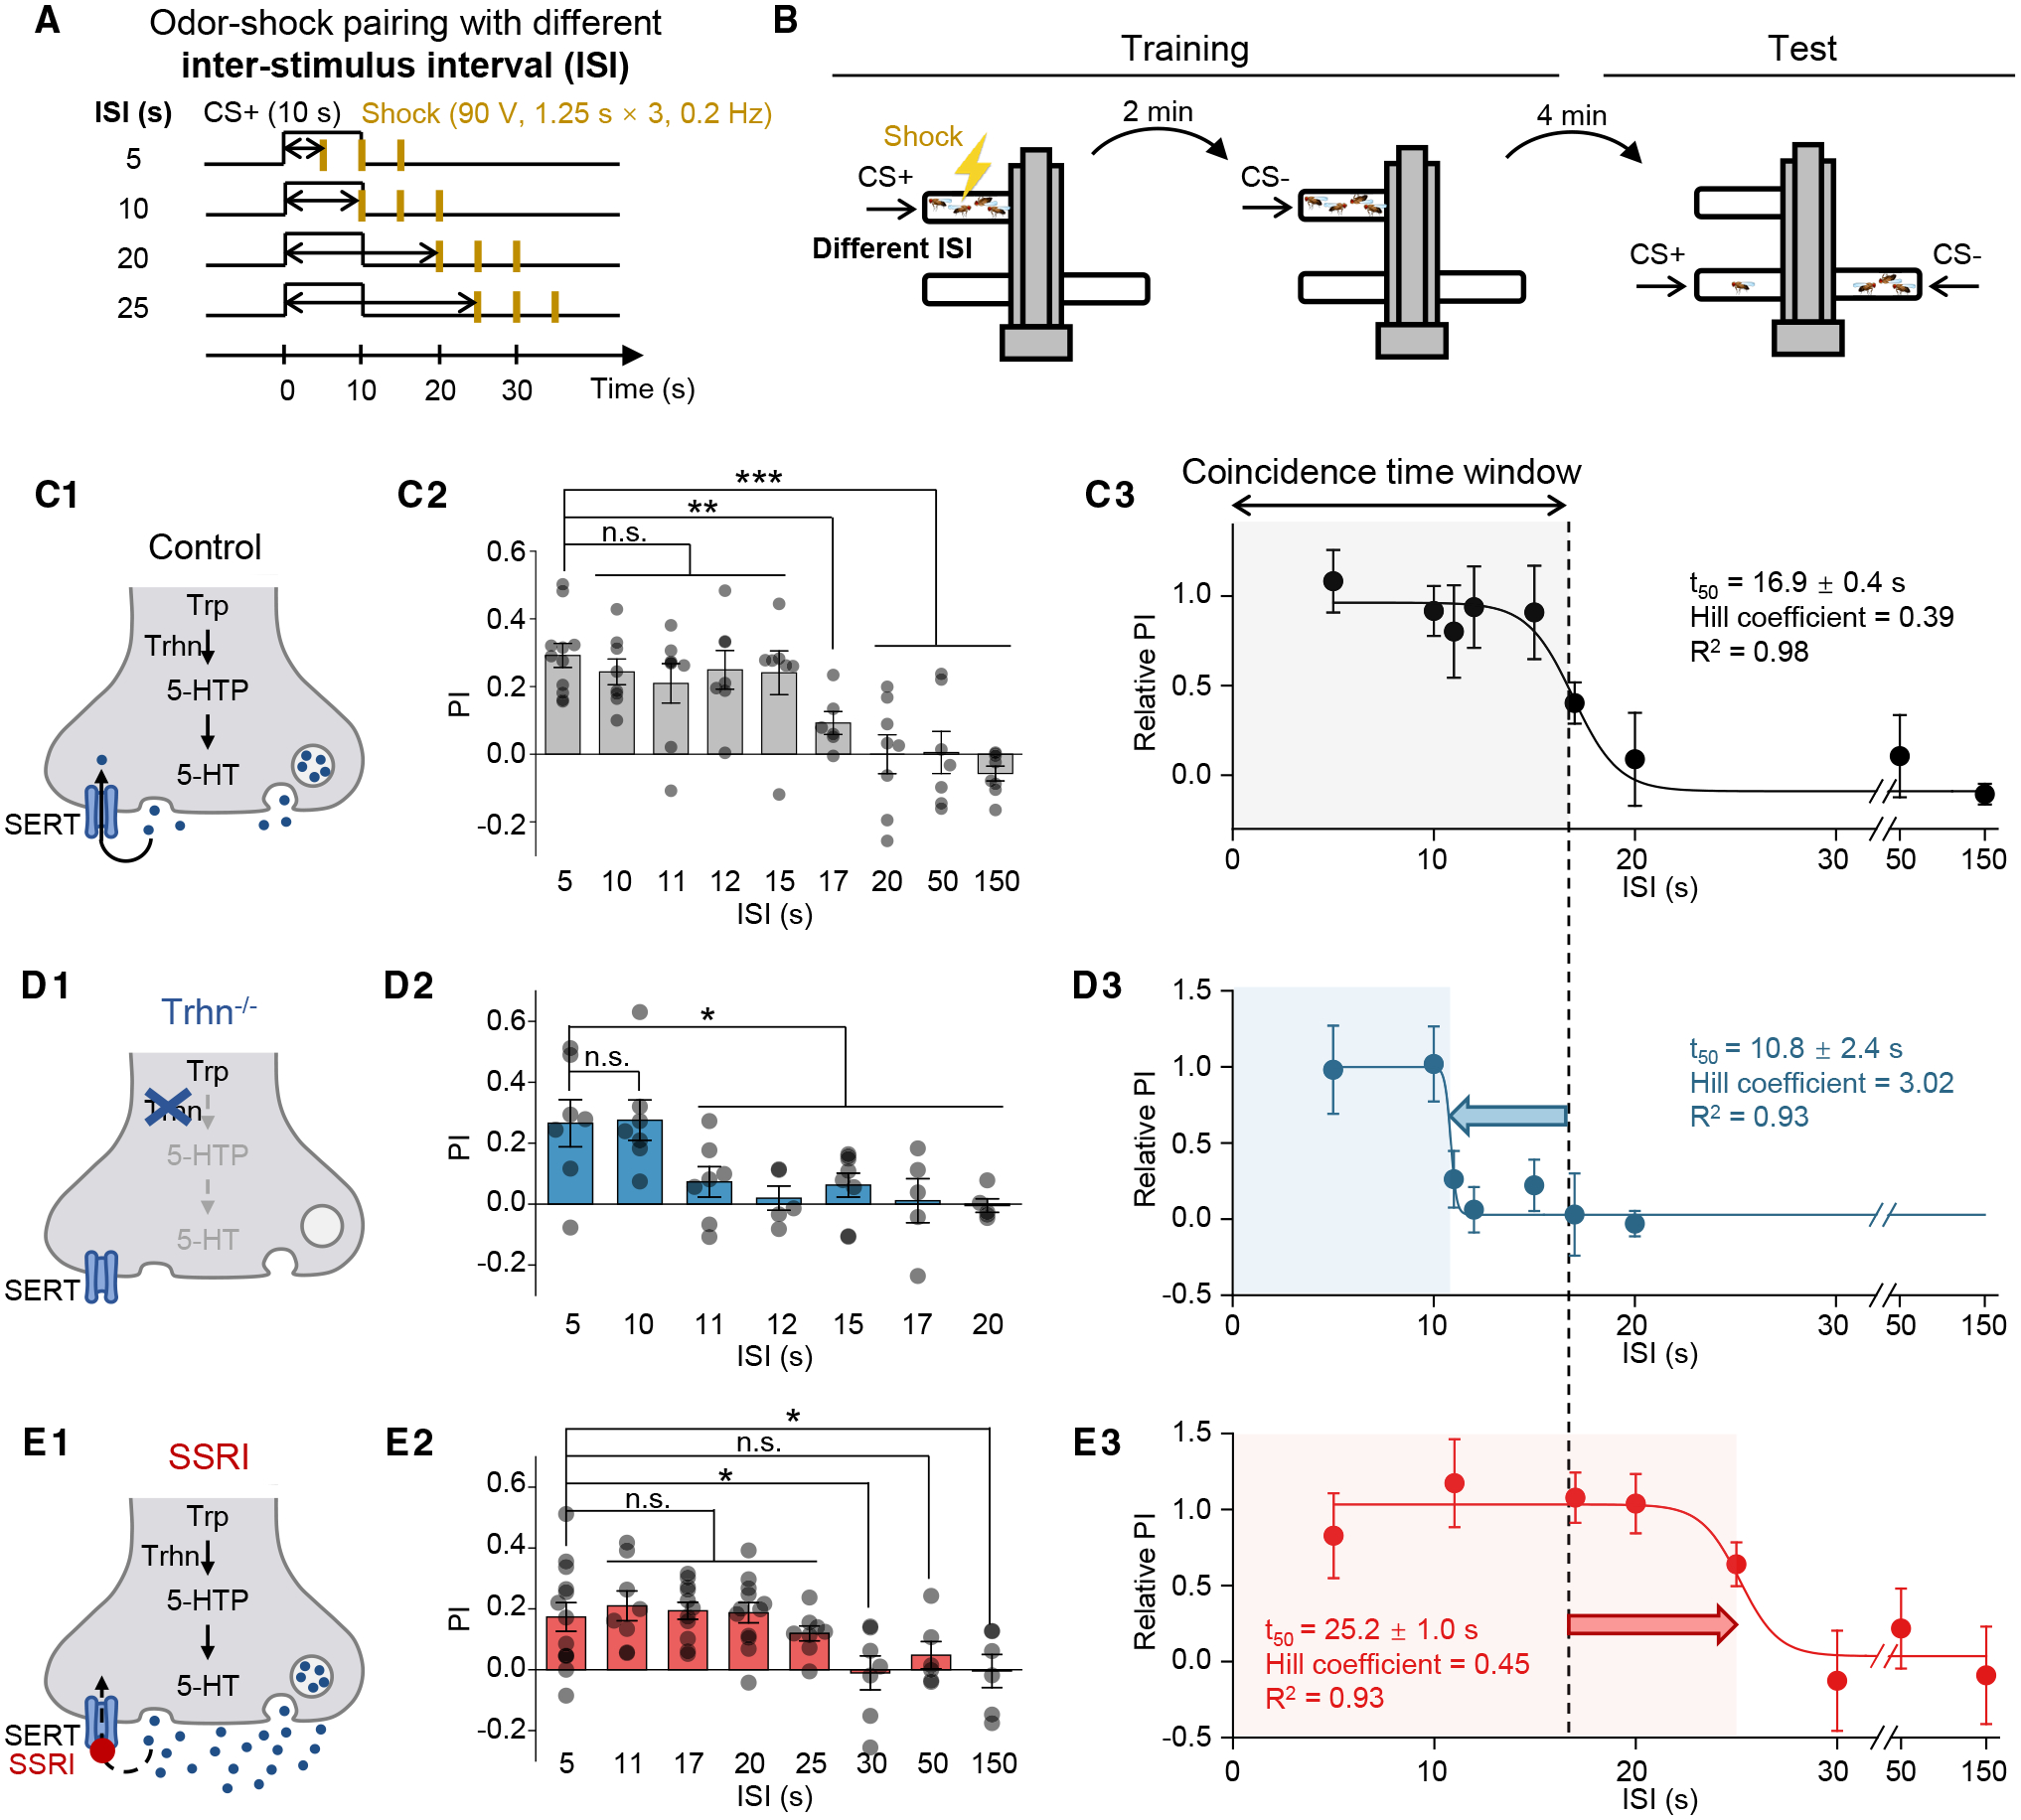
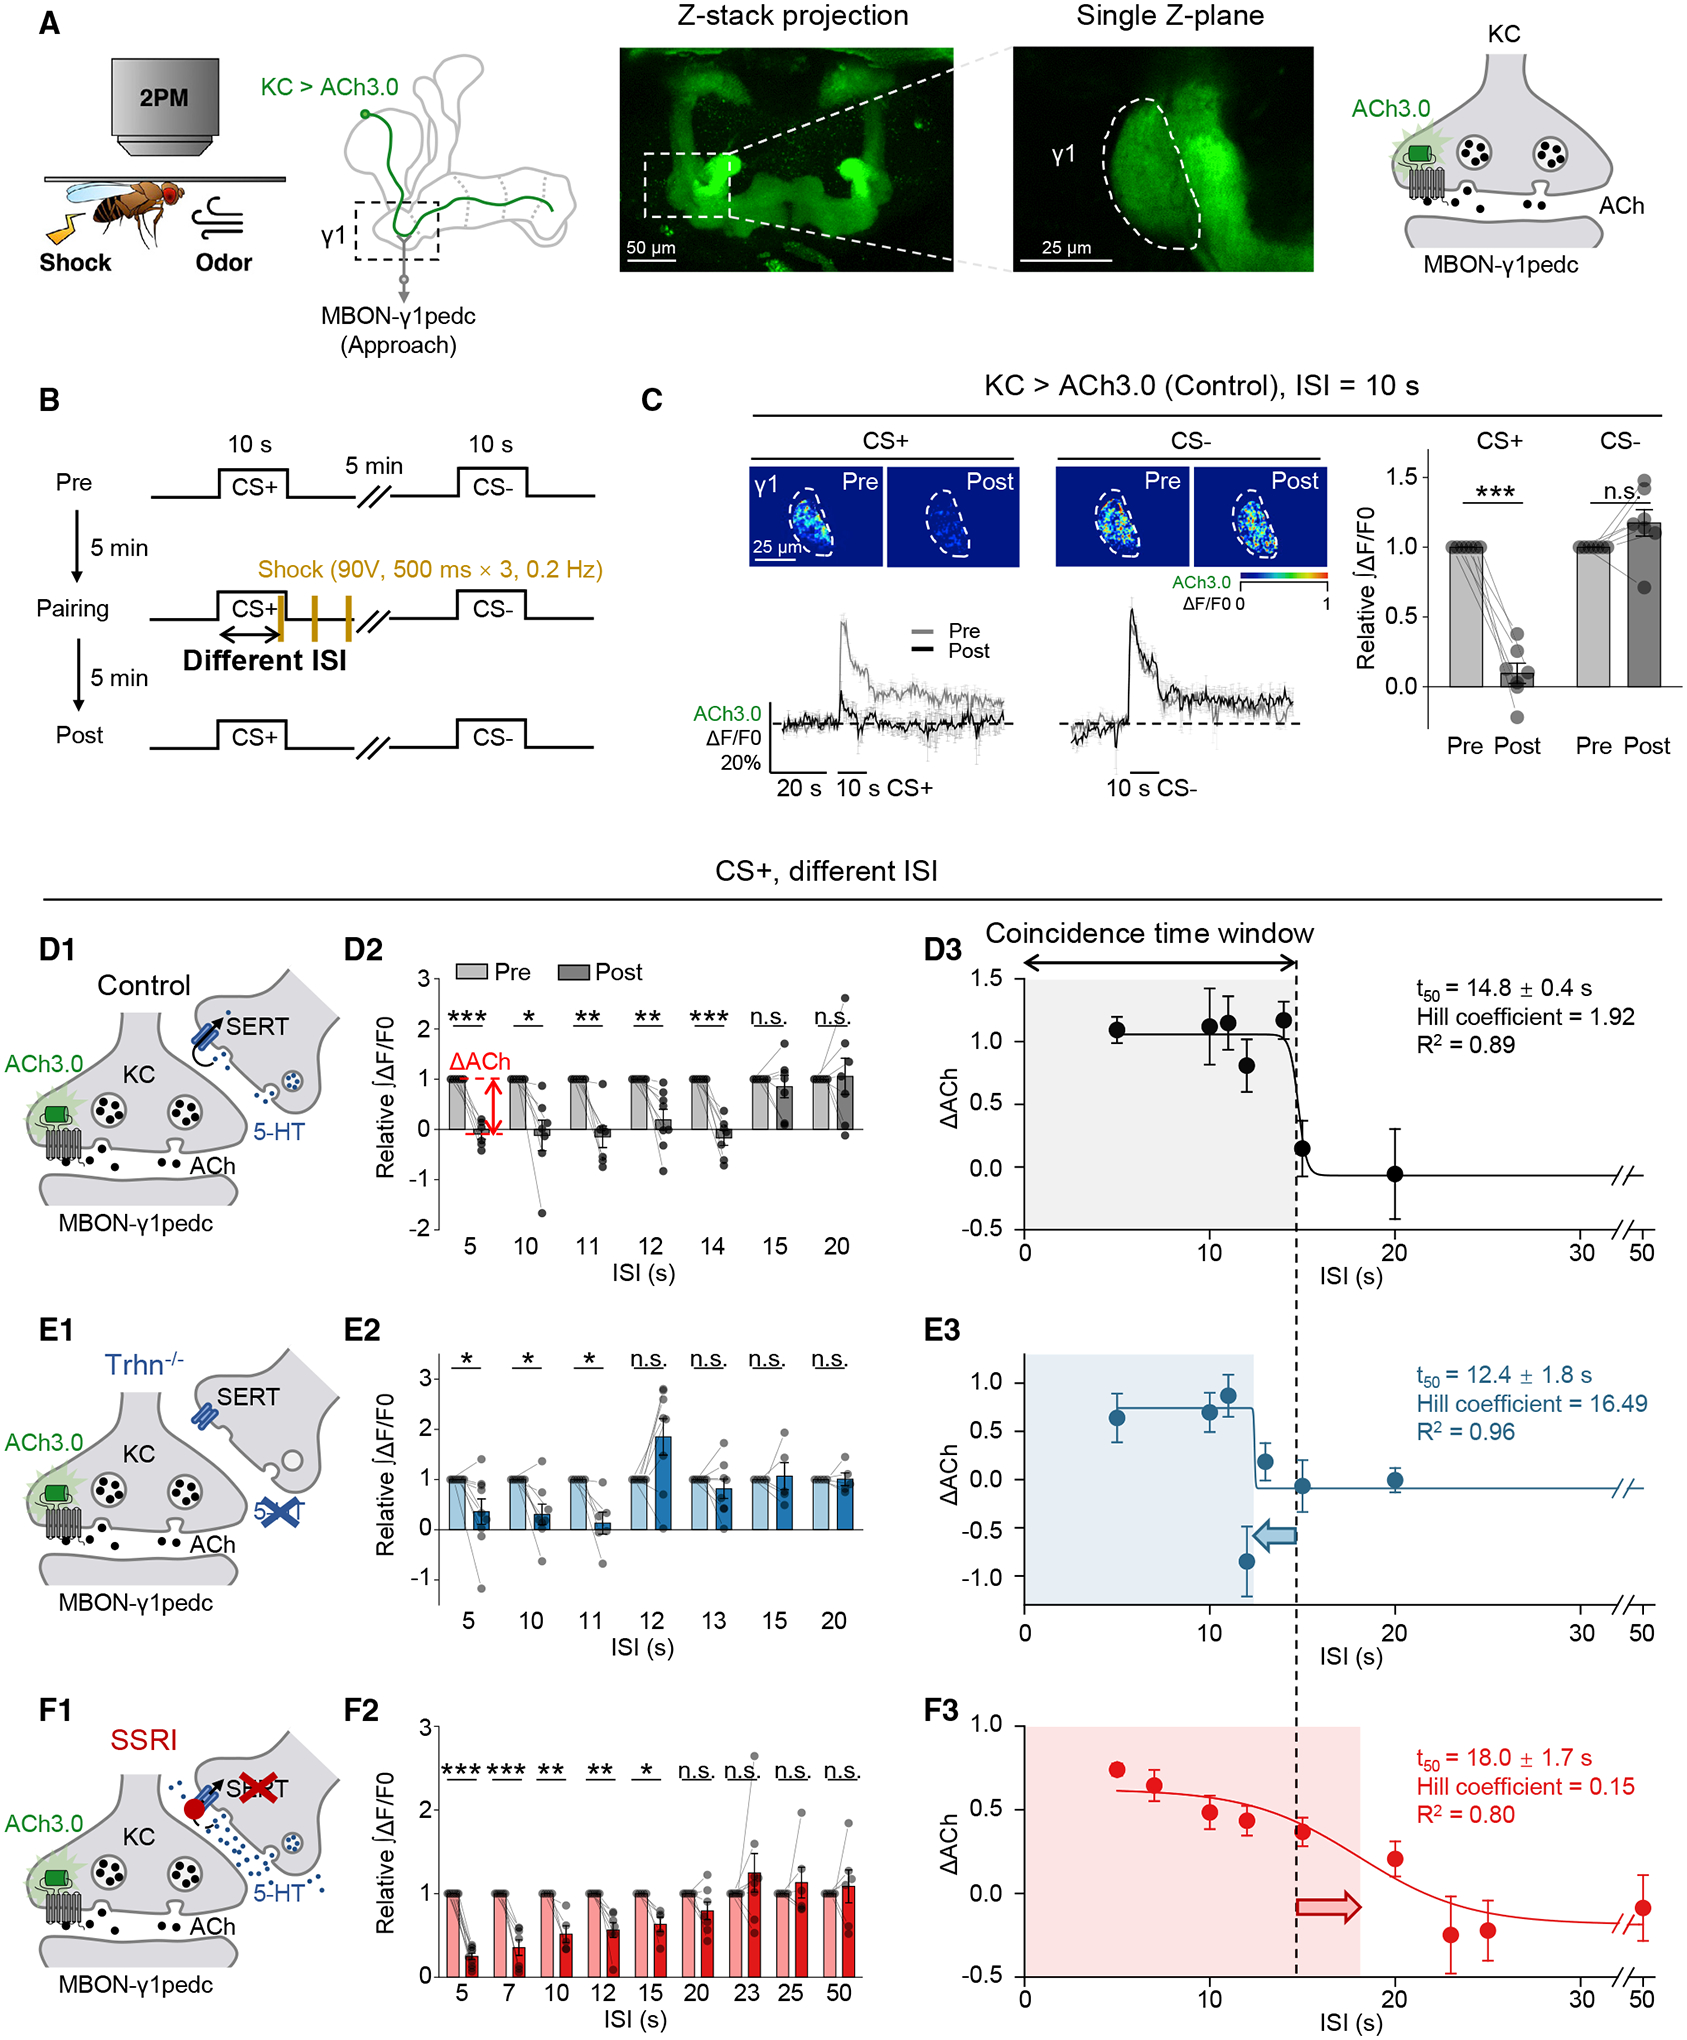
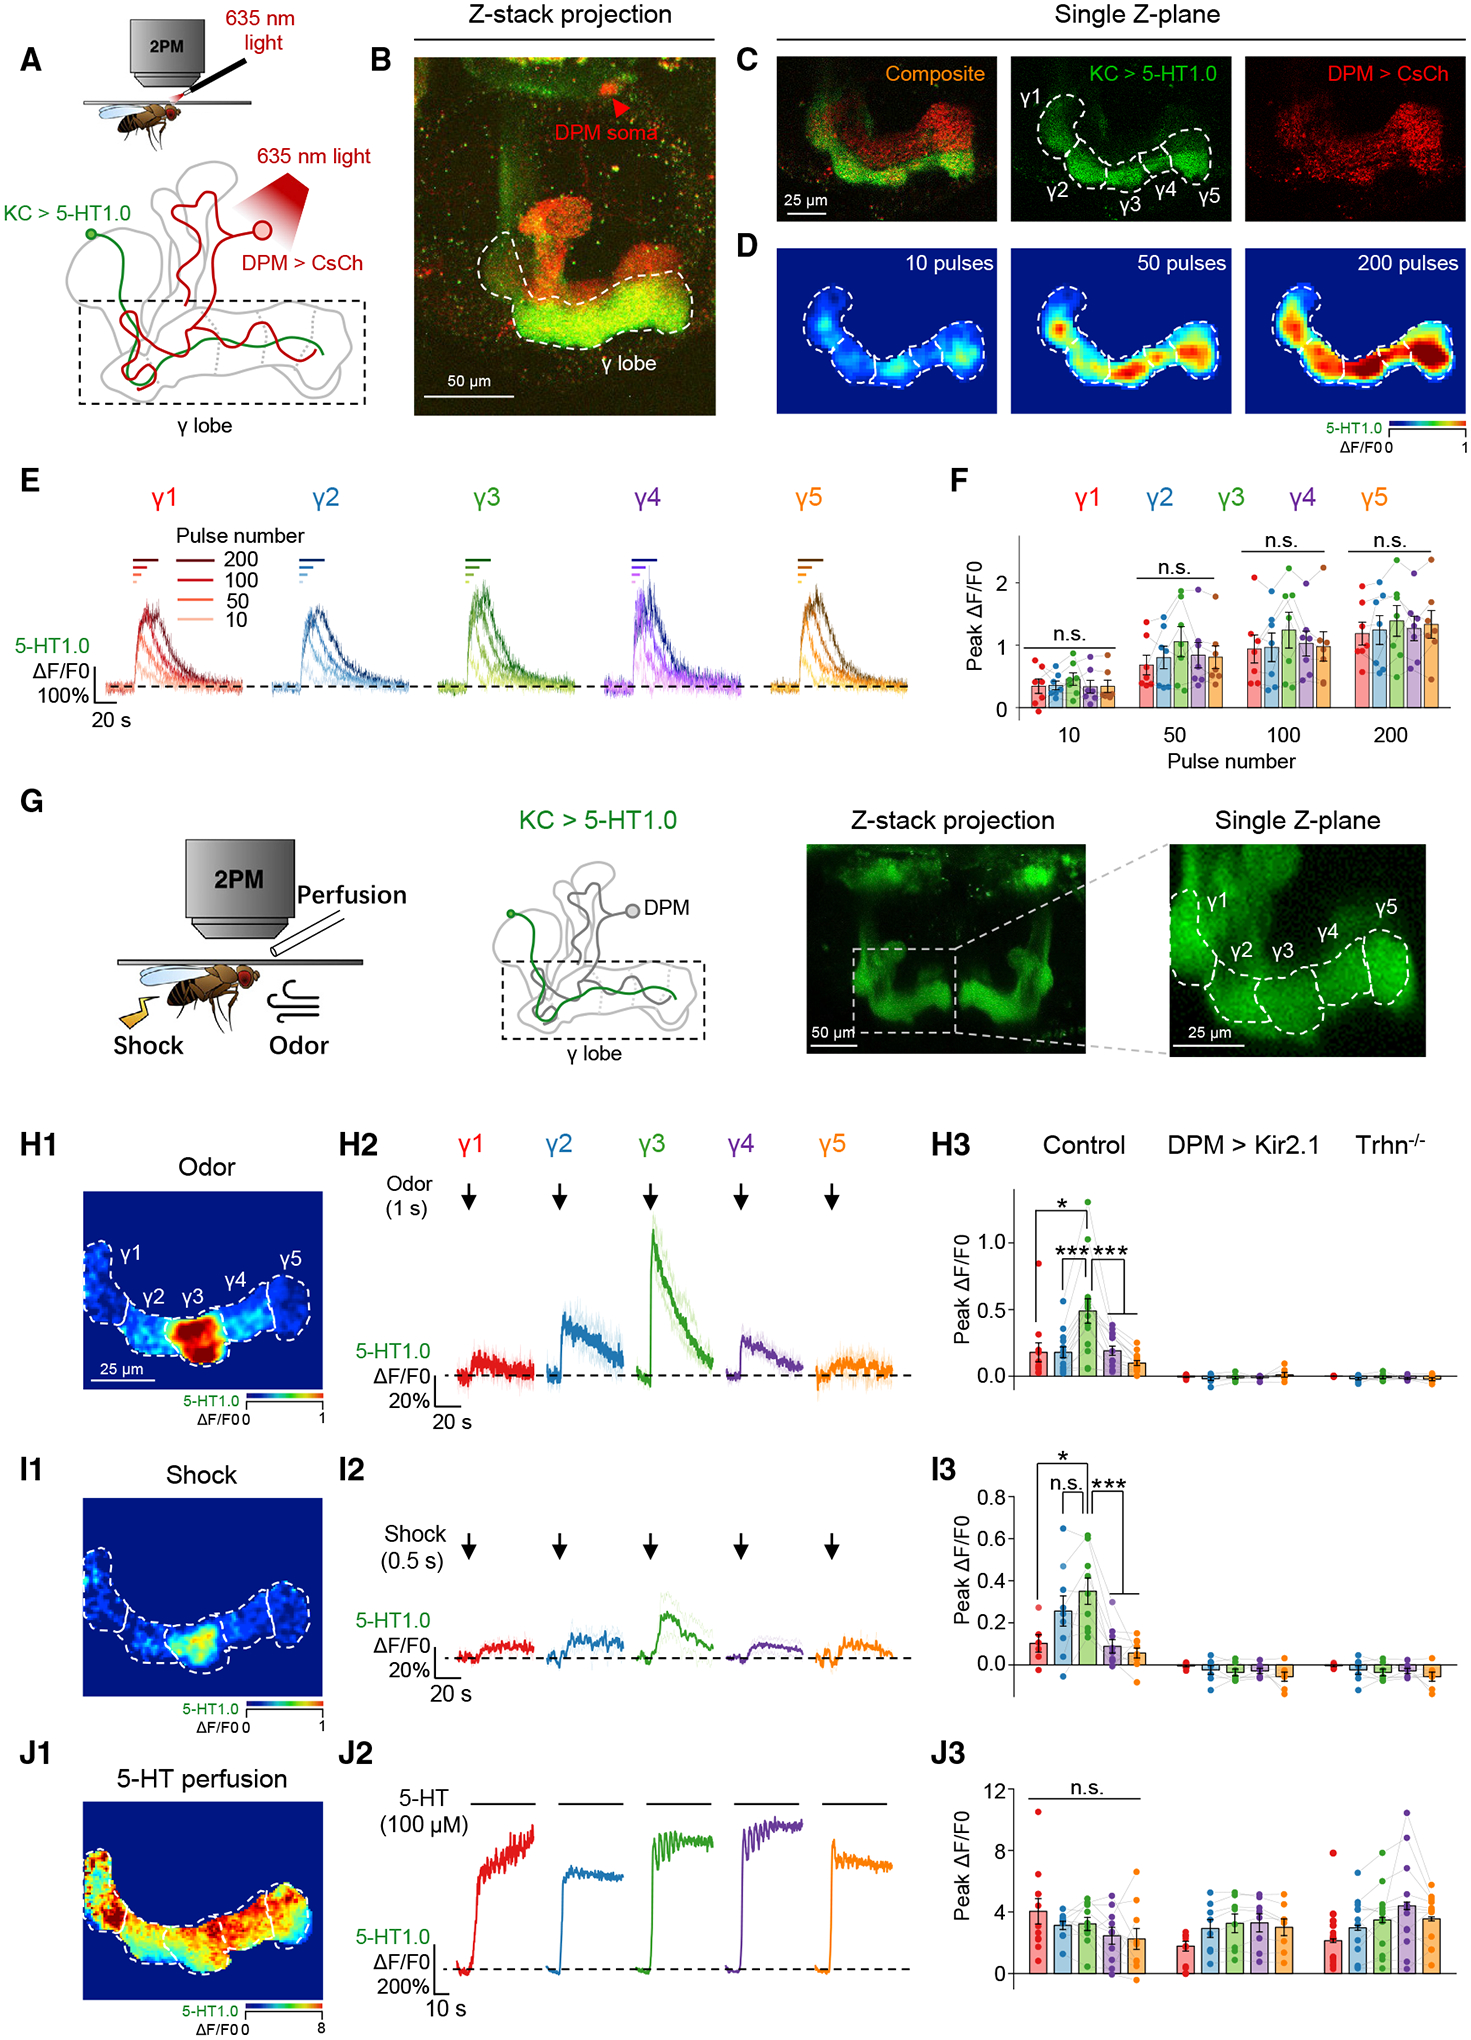
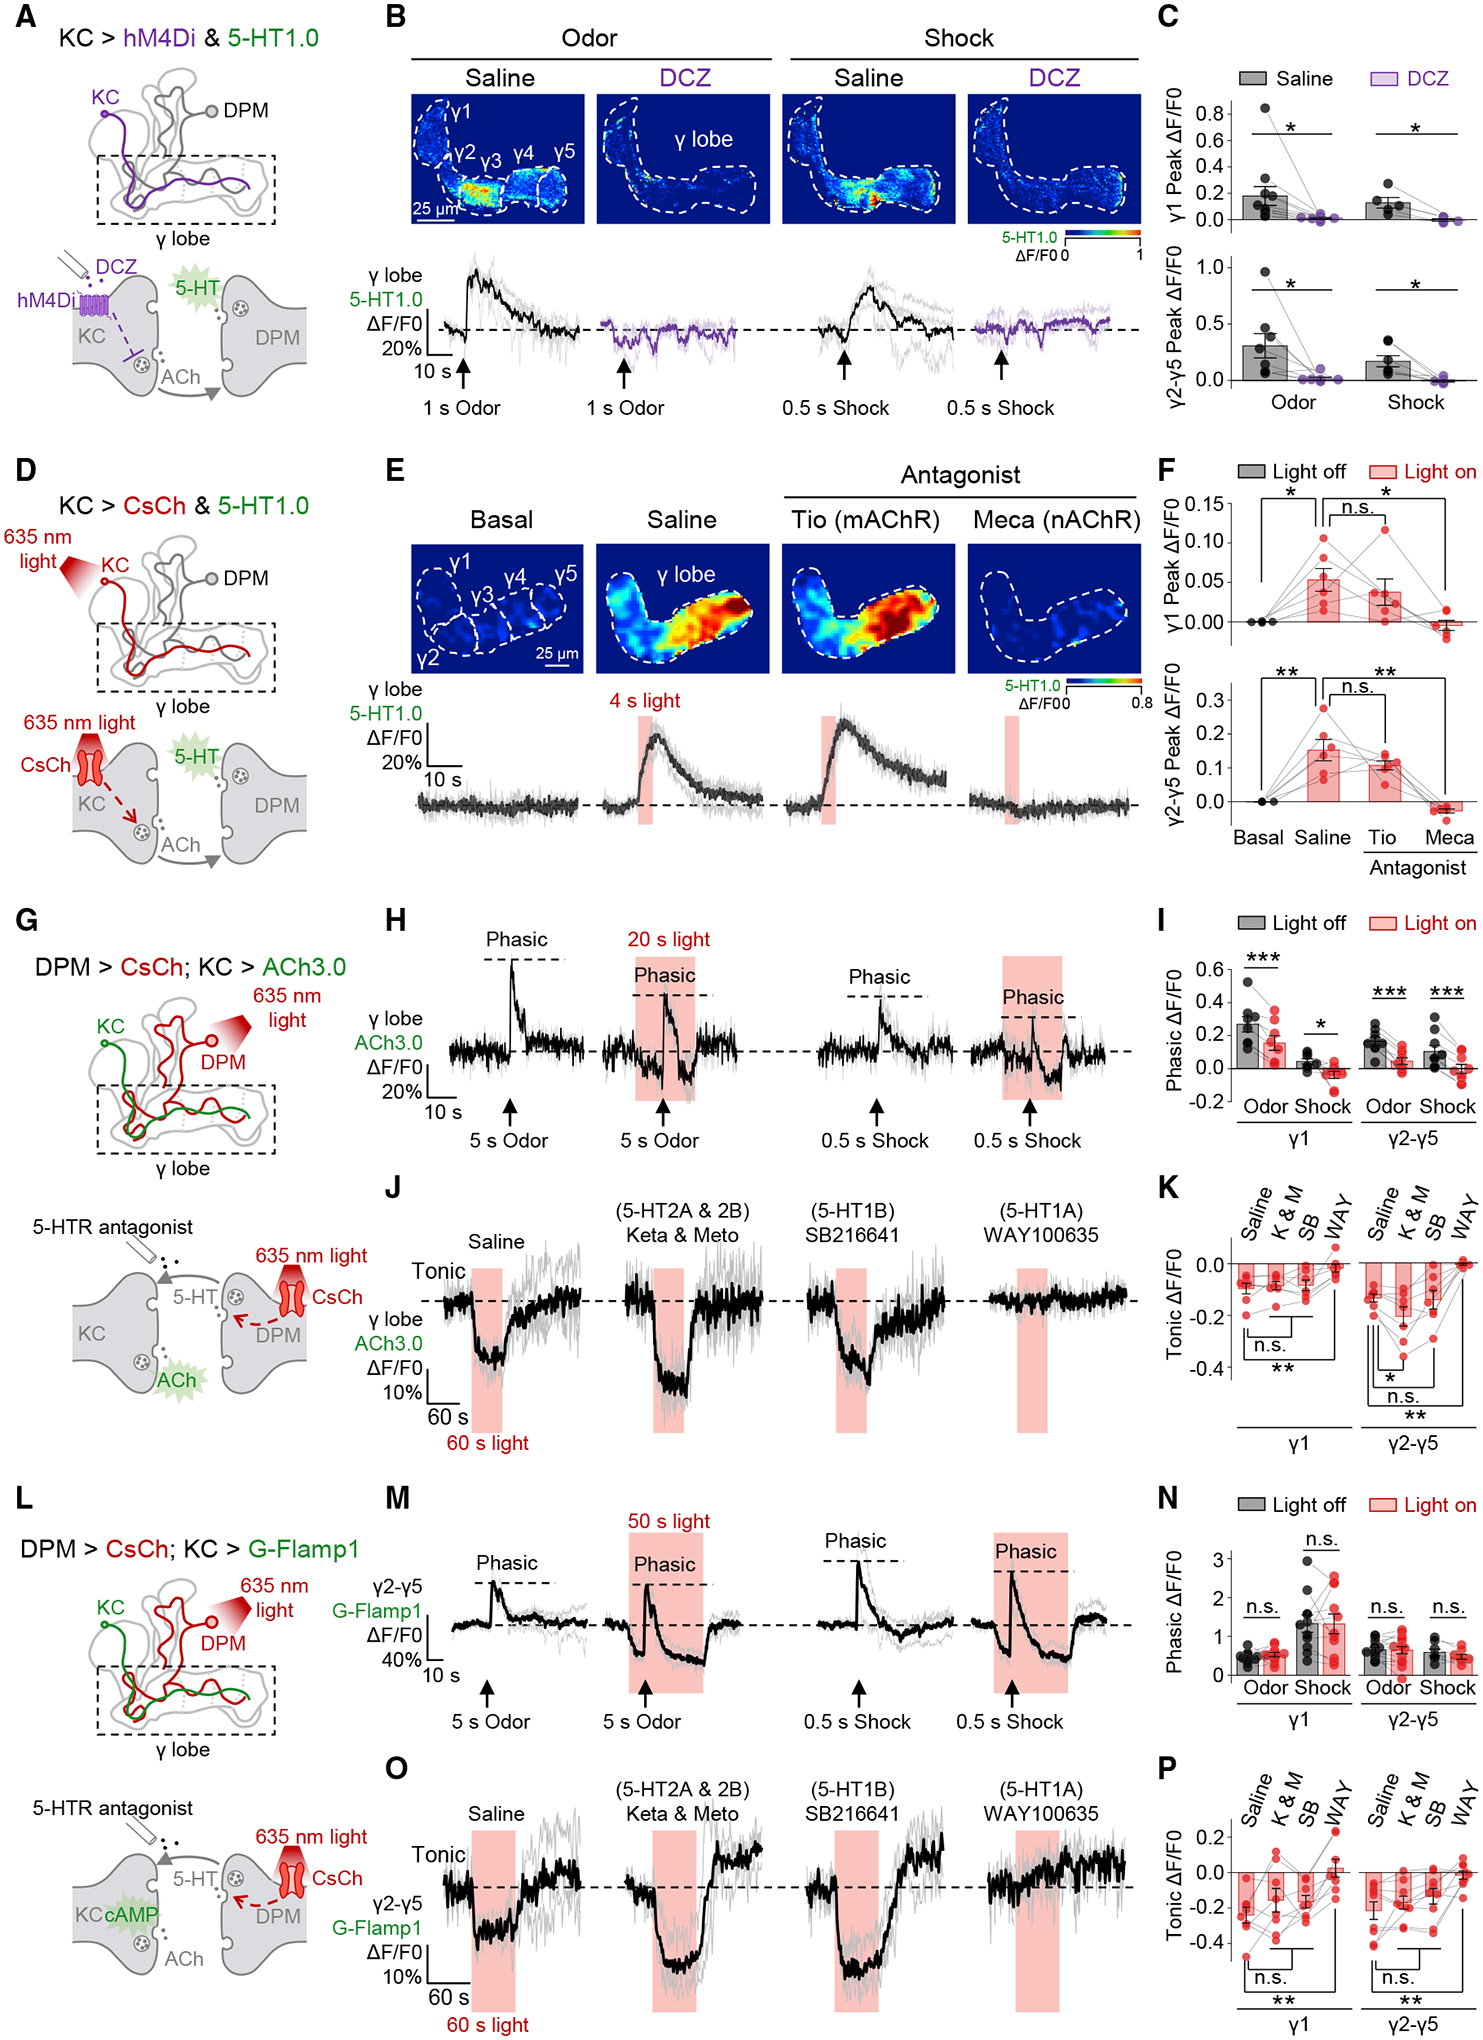
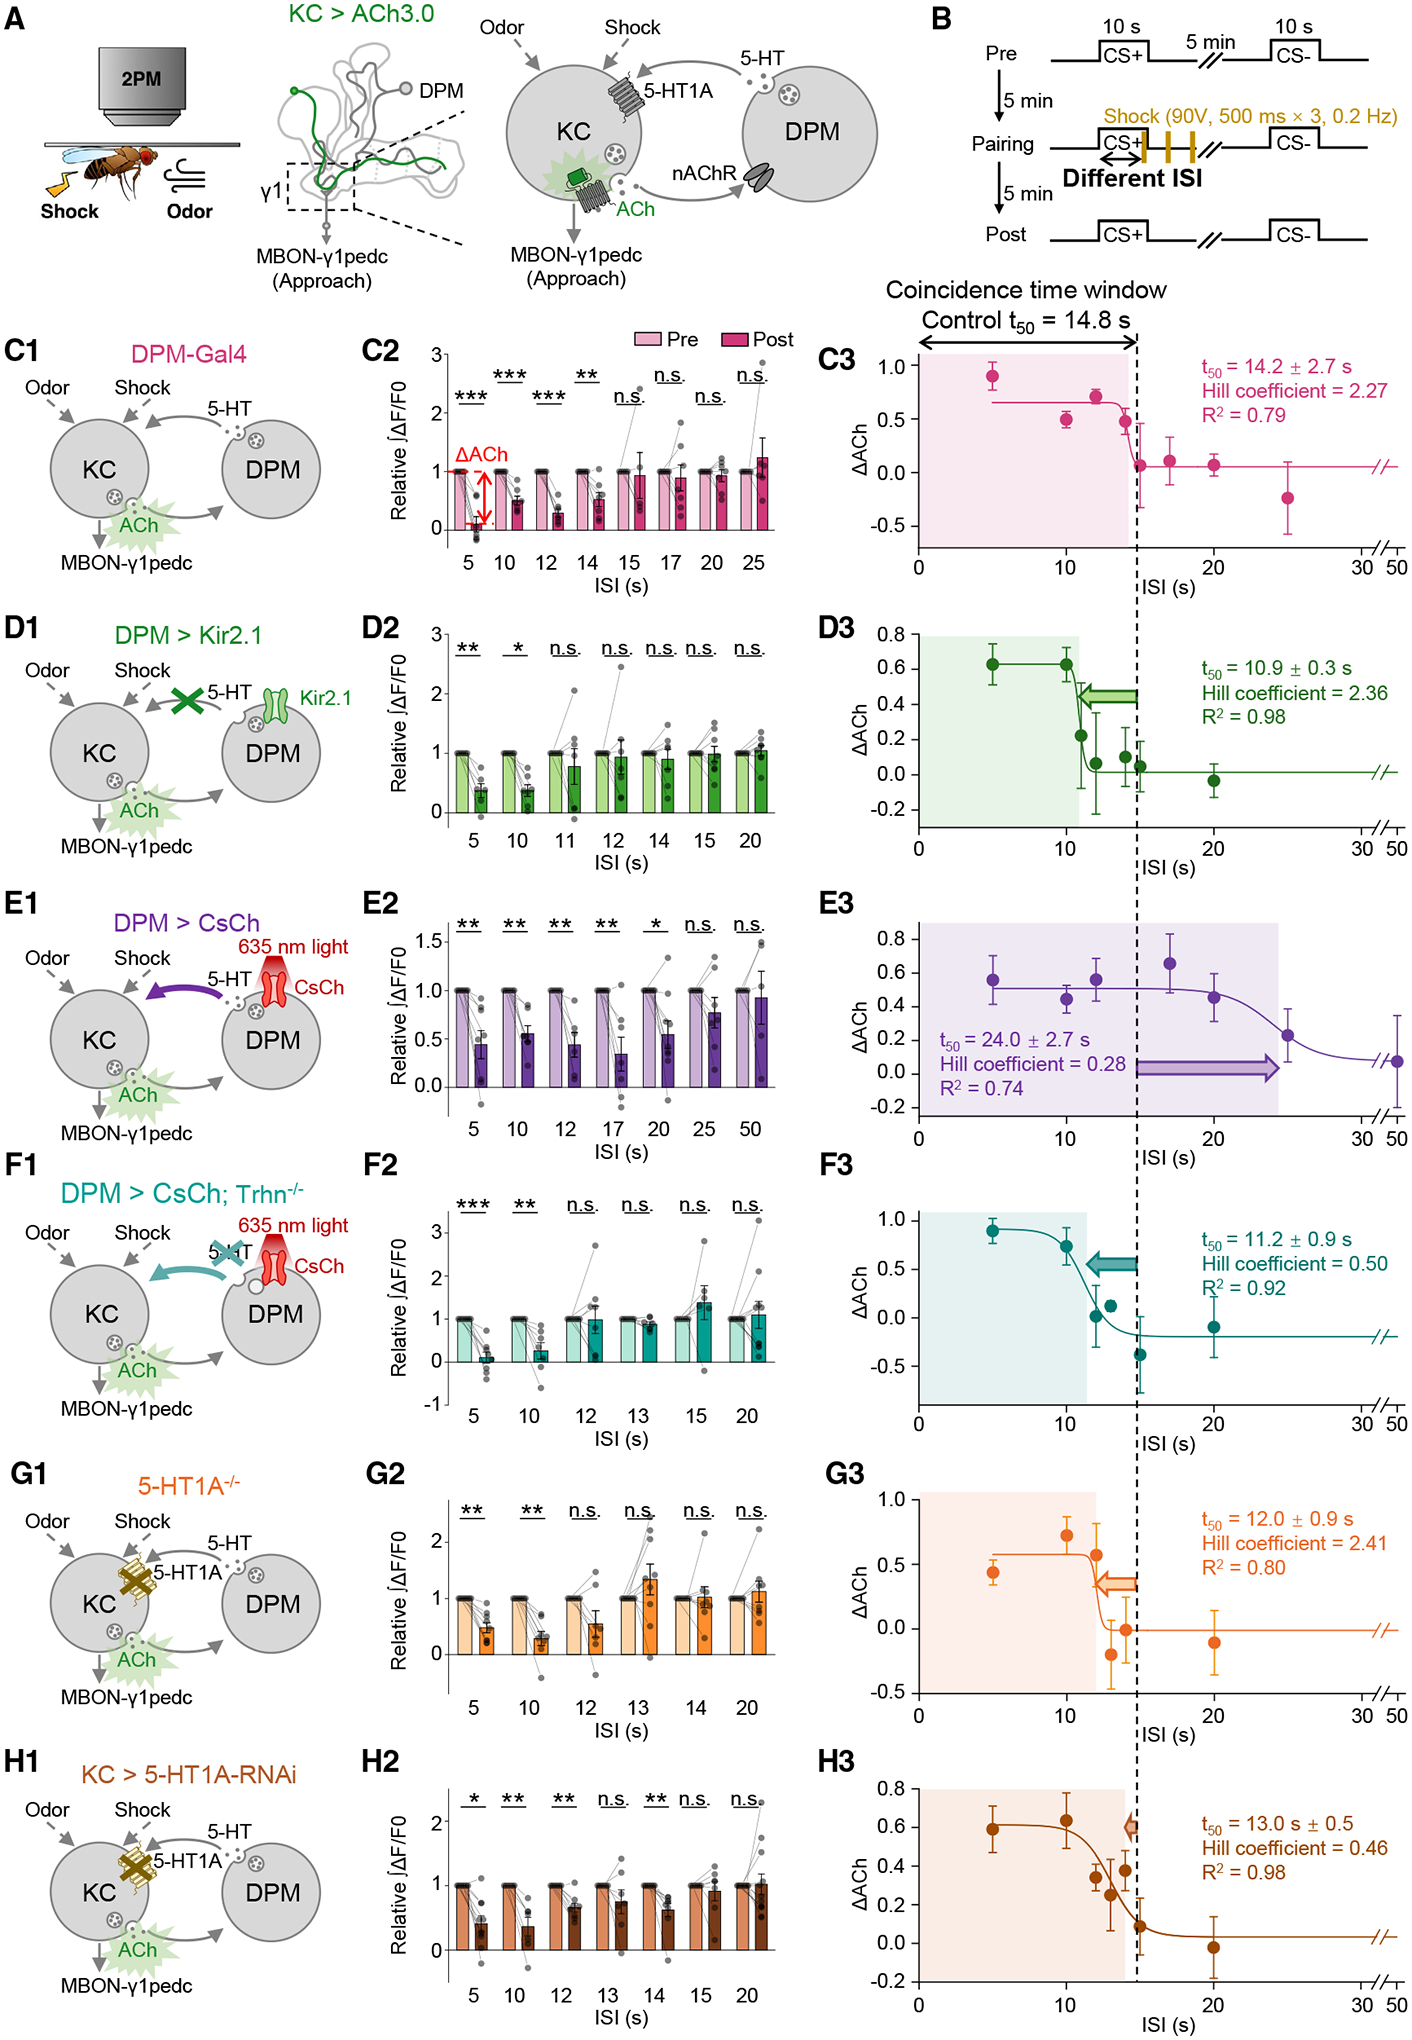
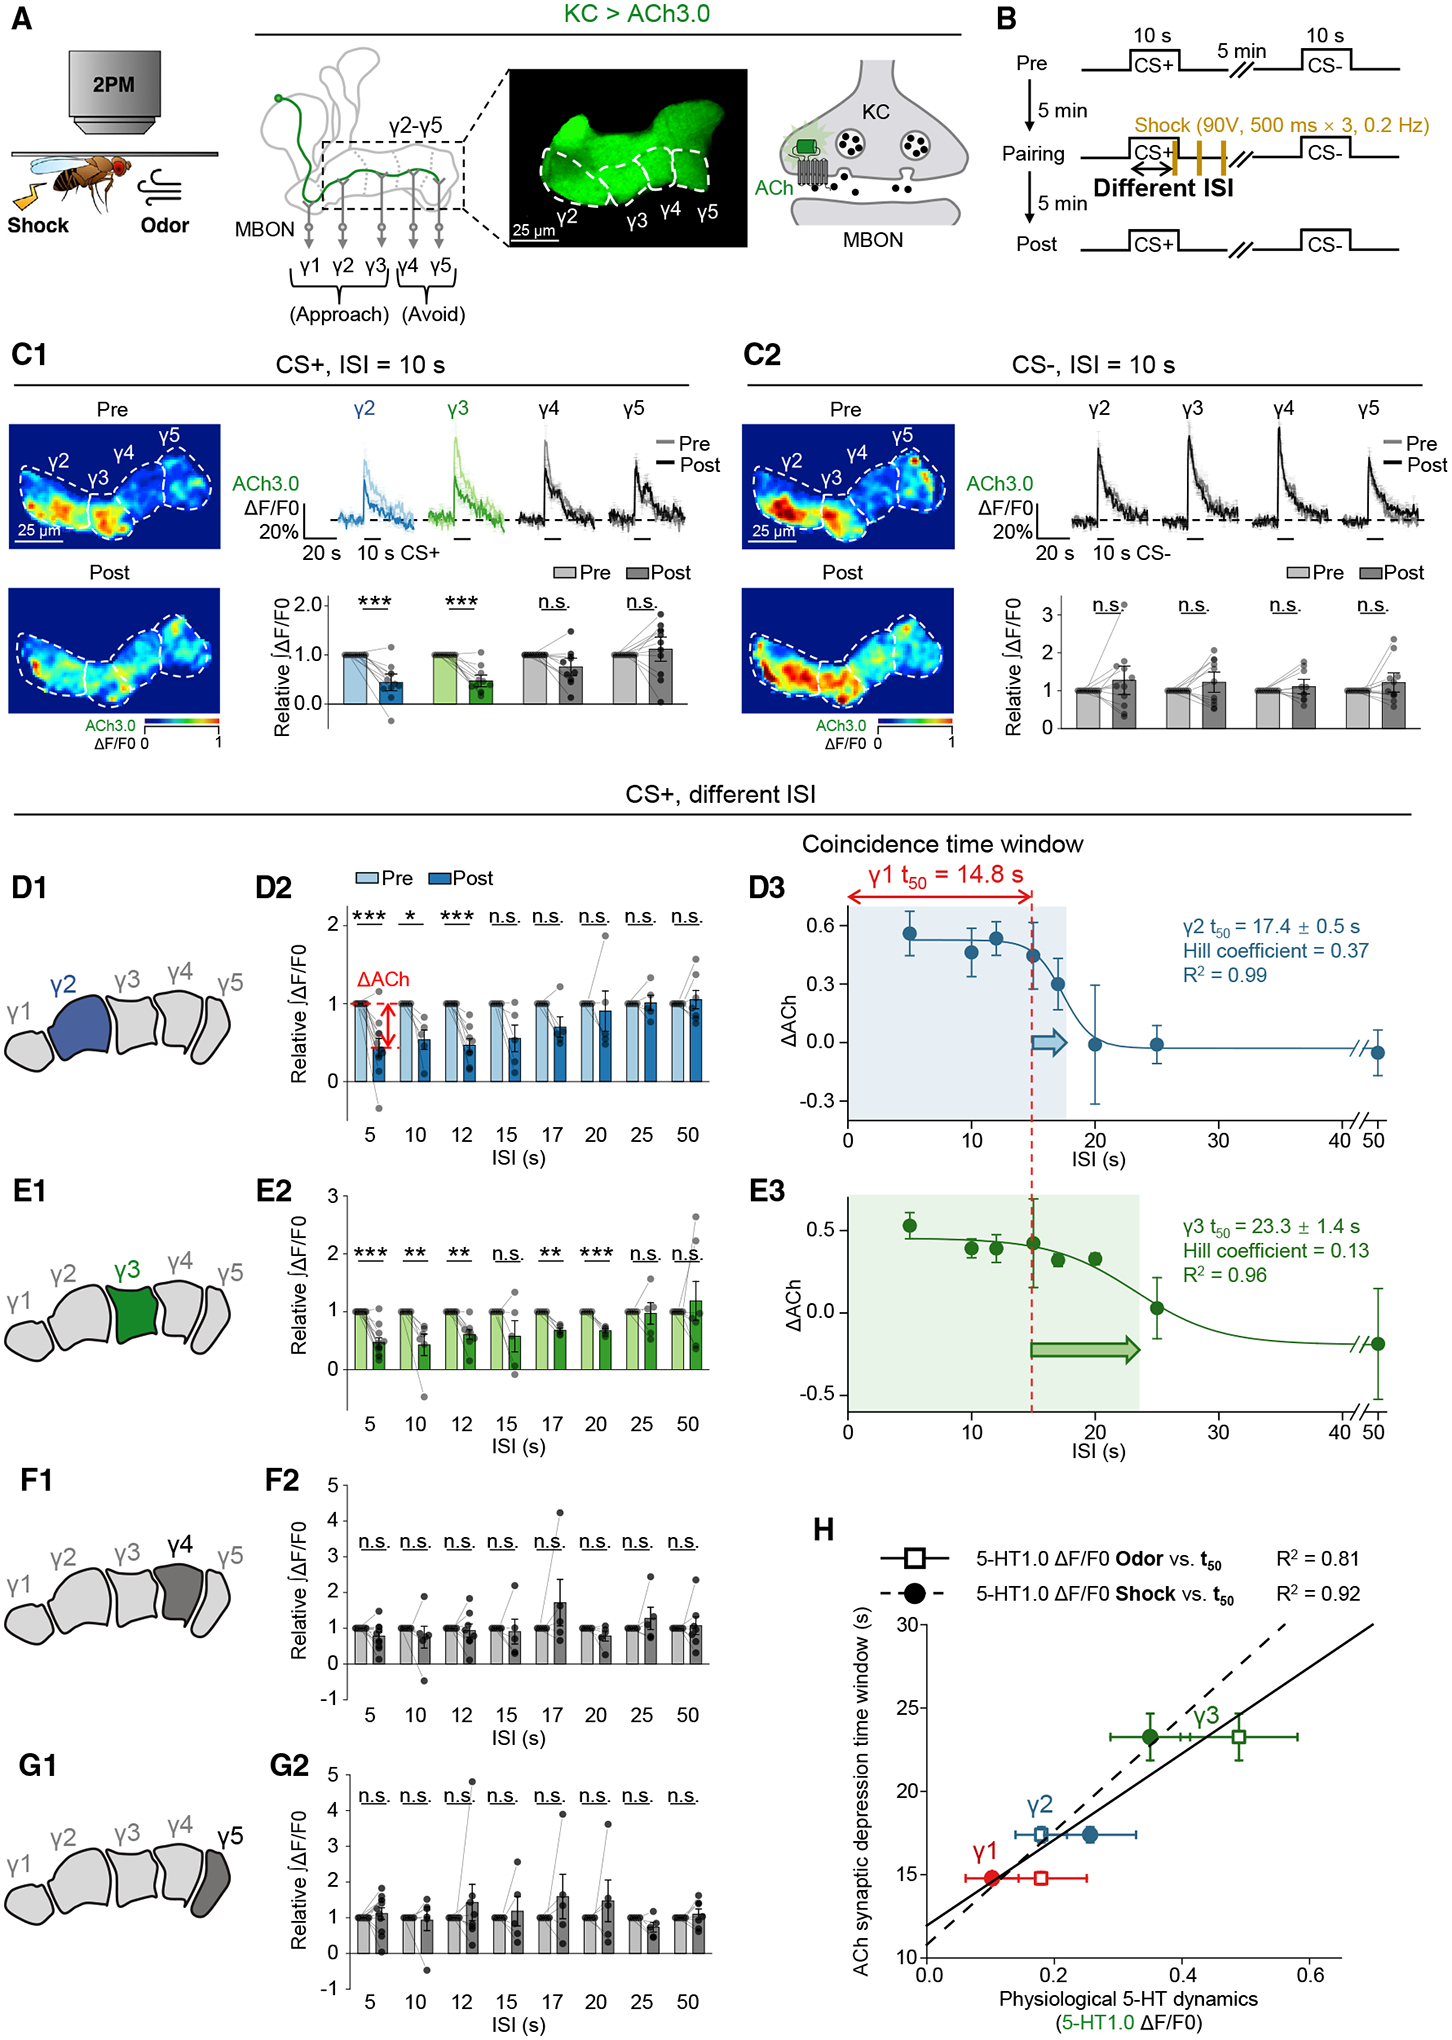
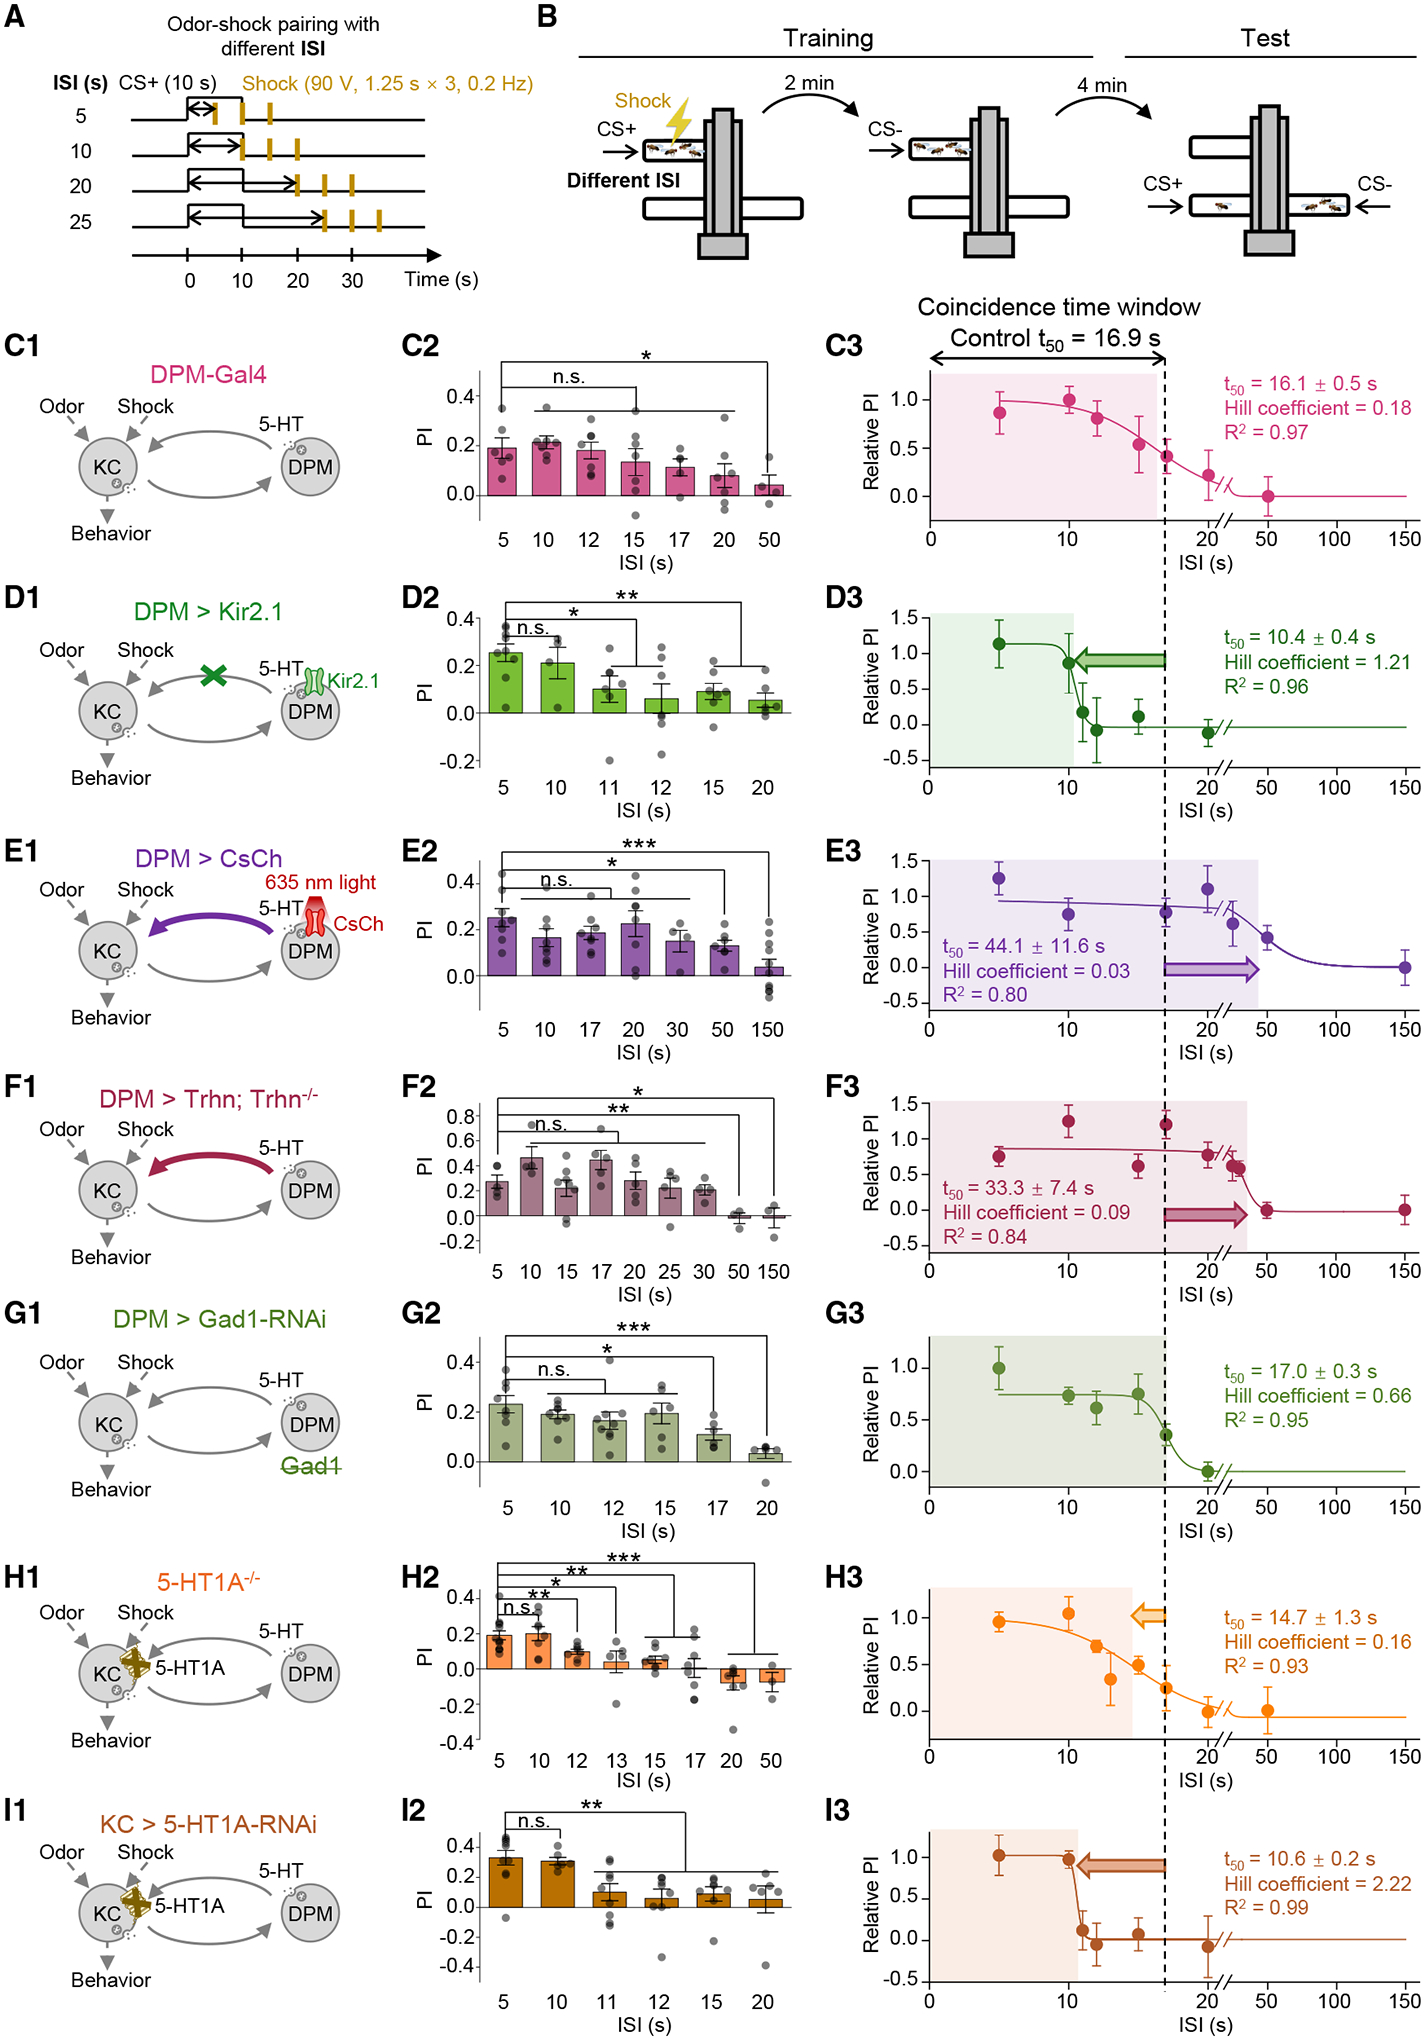
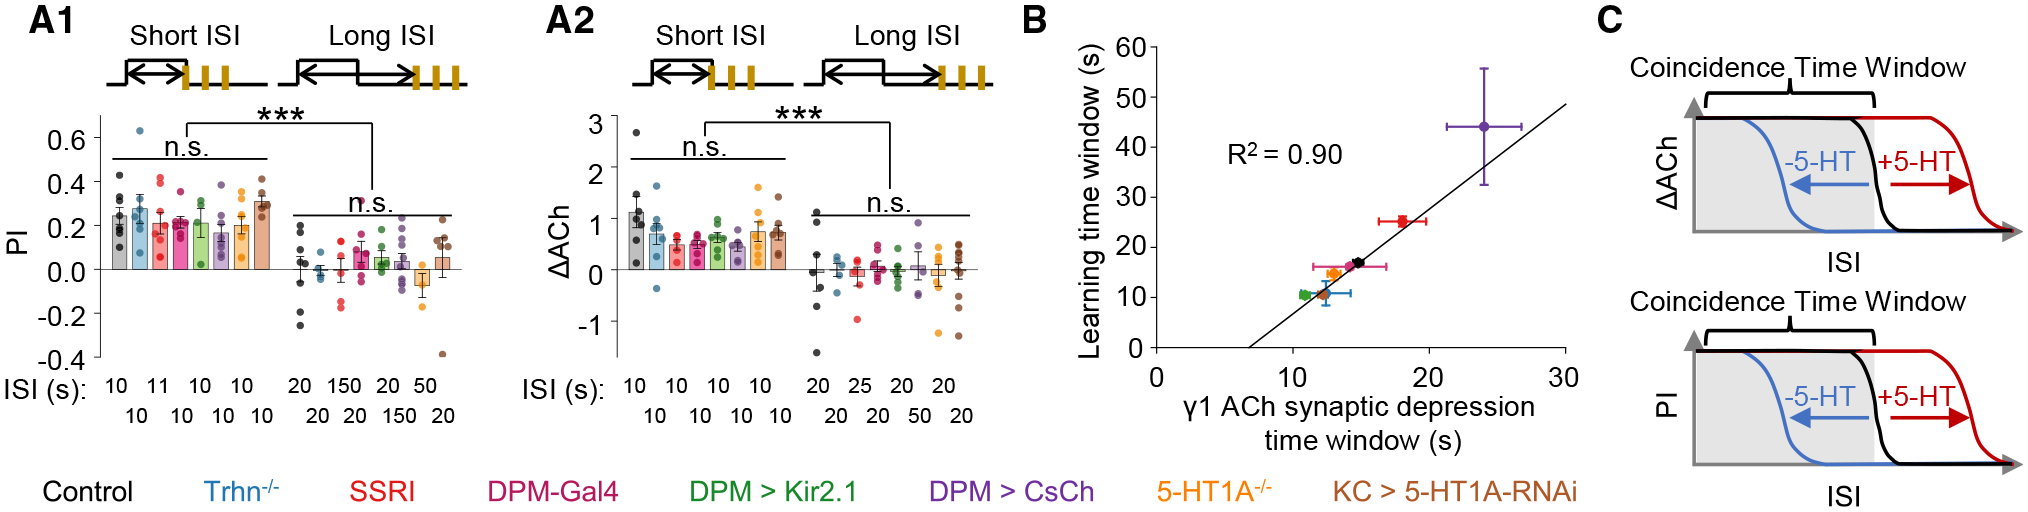
The coincidence between conditioned stimulus (CS) and unconditioned stimulus (US) is essential for associative learning; however, the mechanism regulating the duration of this temporal window remains unclear. Here, we found that serotonin (5-HT) bi-directionally regulates the coincidence time window of olfactory learning in Drosophila and affects synaptic plasticity of Kenyon cells (KCs) in the mushroom body (MB). Utilizing GPCR-activation-based (GRAB) neurotransmitter sensors, we found that KC-released acetylcholine (ACh) activates a serotonergic dorsal paired medial (DPM) neuron, which in turn provides inhibitory feedback to KCs. Physiological stimuli induce spatially heterogeneous 5-HT signals, which proportionally gate the intrinsic coincidence time windows of different MB compartments. Artificially reducing or increasing the DPM neuron-released 5-HT shortens or prolongs the coincidence window, respectively. In a sequential trace conditioning paradigm, this serotonergic neuromodulation helps to bridge the CS-US temporal gap. Altogether, we report a model circuitry for perceiving the temporal coincidence and determining the causal relationship between environmental events.

Keywords: GRAB sensor; associative learning; coincidence time window; olfaction; serotonin; synaptic plasticity.


Conflict of interest statement

Declaration of interests The authors declare no competing interests.

Figures

Figure 1.
Figure 1.. 5-HT bi-directionally regulates the coincidence time window of olfactory learning
(A and B) Schematics depicting the protocol for odor-shock pairing with varying ISIs (A) and the T-maze assay for measuring the olfactory memory (B). (C–E) (C1–E1) Schematics depicting the control flies, Trhn−/− flies, and the SSRI-fed flies (10 mM fluoxetine). (C2–E2) Summary of the PI measured with the indicated ISI; n = 5–11 for each group. (C3–E3) The relative PI-ISI profile fitted with a sigmoid function; the t50 ± standard error, Hill coefficient, and R2 are shown. The coincidence time window is defined as the t50 and indicated by the shaded area. The dashed vertical line at 16.9 s represents the coincidence time window of control flies. In this and subsequent figures, all summary data are presented as the mean ± SEM, superimposed with individual data. *p < 0.05; **p < 0.01; ***p < 0.001; and n.s., not significant (unpaired Student’s t test).
Figure 2.
Figure 2.. 5-HT regulates the coincidence time window for inducing synaptic depression
(A and B) Schematics depicting the in vivo two-photon imaging setup, fluorescence images (A), and the experimental protocol (B), in which odor-induced ACh signals in the γ1 compartment pre- and post-pairing were measured with ACh3.0 expressed in KCs. (C) Representative pseudocolor images (top left), average (± SEM) traces (bottom left), and summary of the relative change (right) of odor-induced ACh signals pre- and post-pairing. (D–F) (D1–F1) Schematics depicting ACh3.0 imaging experiments in the control flies, Trhn−/− flies, and SSRI-fed flies (10 mM fluoxetine). (D2–F2) Summary of the relative change of the integrated ACh3.0 fluorescence in response to CS+ with the indicated ISI; n = 5–9 flies/group. ΔACh indicates the difference between pre- and post-responses. (D3–F3) The ΔACh-ISI profile fitted with a sigmoid function; the t50 ± standard error, Hill coefficient, and R2 are shown. The coincidence time window for inducing synaptic depression is defined as the t50 and indicated by the shaded area. The dashed vertical line at 14.8 s represents the coincidence time window of control flies. *p < 0.05; **p < 0.01; ***p < 0.001; and n.s., not significant (paired Student’s t test). See also Figures S1 and S2.
Figure 3.
Figure 3.. The GRAB5-HT1.0 sensor reveals physiological stimuli-evoked heterogeneous 5-HT signals from the DPM neuron
(A–F) Optogenetically activating the DPM neuron induces homogeneous release of 5-HT in the γ lobe. Shown are schematics (A) and fluorescence images (B and C) depicting the in vivo imaging setup, in which the CsCh (short for CsChrimson)-expressing DPM neuron was activated with light pulses (1 ms/pulse, 635 nm, 10 Hz), and 5-HT was measured using 5-HT1.0 expressed in the KCs. Also shown are representative pseudocolor images (D), average traces (E), and summary (F) of the change in 5-HT1.0 fluorescence in response to the indicated number of light pulses; n = 7 flies/group. The nAChR antagonist Meca (100 μM) was applied to avoid indirect activation. (G–J) Physiological stimuli induce heterogeneous 5-HT signals in the γ lobe. Shown are schematics and fluorescence images (G) depicting the in vivo imaging setup, in which 5-HT was measured using 5-HT1.0 expressed in the KCs. Also shown are pseudocolor images (H1–J1), average and individual traces (H2–J2), and summary (H3–J3) of the change in 5-HT1.0 fluorescence in response to odor (1 s), electric shock (0.5 s, 90 V), and 5-HT perfusion (100 μM) in control flies, DPM > Kir2.1 flies, and Trhn−/− flies; n = 6–14 flies/group. *p < 0.05; ***p < 0.001; and n.s., not significant (paired or unpaired Student’s t test). See also Figures S1 and S3.
Figure 4.
Figure 4.. 5-HT release from the DPM neuron is activated by ACh from KCs, and the 5-HT signal provides inhibitory feedback on KCs
(A–C) Silencing KCs abolishes stimuli-evoked 5-HT release in the γ lobe. Shown are schematics (A) depicting the in vivo imaging setup in which hM4Di-expressing KCs were silenced by DCZ (30 nM), and 5-HT was measured using 5-HT1.0 expressed in KCs. Also shown are representative pseudocolor images (B, top), average and individual traces (B, bottom), and summary (C) of the change in 5-HT1.0 fluorescence in response to odor (1 s) or electric shock (0.5 s, 90 V) in flies with or without DCZ; n = 5–11 flies/group. In each fly, the experiment was divided into saline and DCZ sessions, and in each session, the odor and/or shock stimuli were applied for 1–3 trials, in random order. (D–F) Activating KCs induces 5-HT release in the γ lobe. Shown are schematics (D) depicting the in vivo imaging setup in which CsChrimson-expressing KCs were activated by light pulses (1 ms/pulse, 635 nm, 10 Hz), and 5-HT was measured using 5-HT1.0 expressed in KCs. Also shown are representative pseudocolor images (E, top), average and individual traces (E, bottom), and summary (F) of the change in 5-HT1.0 fluorescence in response to optogenetic stimulation in saline or in the presence of either the mAChR antagonist Tio (100 μM) or the nAChR antagonist Meca (100 μM); n = 6 flies/group. For each fly, the experiment was divided into three sessions, and in each session the light was applied for 3 trials. (G–K) Activating the DPM neuron inhibits both stimuli-evoked (phasic) and spontaneous (tonic) ACh release in the γ lobe. Shown are schematics (G) depicting the in vivo imaging setup in which the CsChrimson-expressing DPM neuron was activated by light pulses (5 ms/pulse, 635 nm, 4 Hz), and ACh was measured using ACh3.0 expressed in KCs. Also shown are average and individual traces (H and J), and summary (I and K) of the change in ACh3.0 fluorescence in response to odor (5-s application) and electric shock (0.5 s, 90 V) with or without light stimulation, or to 60-s light stimulation with or without 5-HT receptors’ antagonists (20 μM); n = 7–9 flies/group. When measuring phasic signals, a fly received 2–8 pairs of odor and/or shock stimuli, and in each pair the light-on and light-off trials were performed in random order. When measuring tonic signals, each fly was tested in 4 sessions, and in each session the light were applied for 3 trials. The gap junction blocker CBX (100 μM) was present throughout the experiment. (L–P) Activating the DPM neuron selectively inhibits spontaneous (tonic) but does not influence stimuli-evoked (phasic) cAMP dynamics in the γ lobe. Shown are similar to (G)–(K) except that cAMP was measured using G-Flamp1 expressed in KCs; n = 8–15 flies/group. *p < 0.05; **p < 0.01; ***p < 0.001; and n.s., not significant (paired Student’s t test). See also Figures S3–S6.
Figure 5.
Figure 5.. 5-HT signal from the DPM neuron bi-directionally modulates the coincidence time window for synaptic depression in the γ1 compartment
(A and B) Schematics depicting the in vivo imaging setup (A, left), the inhibitory feedback loop of the DPM neuron and KCs (A, right), and the experimental protocol (B). (C–H) (C1–H1) Schematics depicting the measurement of synaptic depression in the γ1 compartment, using ACh3.0 expressed in KCs, with the indicated genetic perturbations affecting the serotonergic DPM-to-KCs signaling. In (E), the CsChrimson-expressing DPM neuron was activated by continuous 635-nm light from the start of the odor application to 4.5 s after the last electric shock being applied. (F) was similar to (E), except that Trhn−/− flies were used. (C2–H2) Summary of the relative change of the integrated ACh3.0 fluorescence in response to the CS+ in pre- and post-pairing sessions with the indicated ISI. ΔACh indicates the difference between pre- and post-responses; n = 5–10 flies/group. (C3–H3) The ΔACh-ISI profile was fitted to a sigmoid function; the t50 ± standard error, Hill coefficient, and R2 are shown. The dashed vertical line at 14.8 s represents the coincidence time window of synaptic depression in control flies. *p < 0.05; **p < 0.01; ***p < 0.001; and n.s., not significant (paired Student’s t test). See also Figure S2.
Figure 6.
Figure 6.. Heterogeneous 5-HT signals gate the lengths of coincidence time windows for inducing synaptic depression in the γ1–γ3 compartments
(A and B) Schematics depicting the in vivo imaging setup (A) and experimental protocol (B) for measuring changes in synaptic plasticity in the γ2–γ5 compartments, using ACh3.0 expressed in KCs. (C) Flies were trained with odor-shock pairing with 10-s ISI, and changes in ACh3.0 fluorescence were compared between the pre- and post-pairing sessions, in response to the CS+ (C1) and CS− (C2). Shown are representative pseudocolor images (left), average (± SEM) traces (top right), and the summary (bottom right) of the ACh3.0 fluorescence; n = 11 flies/group. (D–G) (D1–G1) Schematics depicting the measurement of synaptic depression in different γ lobe compartments, using ACh3.0 expressed in KCs. (D2–G2) Summary of the relative change of the integrated ACh3.0 fluorescence in response to the CS+ in pre- and post-pairing sessions with the indicated ISI. ΔACh indicates the difference between pre- and post-responses; n = 4–10 flies/group. (D3–E3) The ΔACh-ISI profile was fitted to a sigmoid function; the t50 ± standard error, Hill coefficient, and R2 are shown. The dashed vertical line at 14.8 s represents the coincidence time window measured for the γ1 compartment. (H) Correlation analysis of coincidence time windows (y axis: t50 ± standard error) for inducing synaptic depression and the odor- or shock-evoked 5-HT dynamics (x axis: ΔF/F0 ± standard error) in γ1–γ3 compartments. Each set of data was fit to a linear function, and the R2 is shown. *p < 0.05; **p < 0.01; ***p < 0.001; and n.s., not significant (paired Student’s t test). See also Figure S2.
Figure 7.
Figure 7.. 5-HT from the DPM neuron bi-directionally modulates the coincidence time window of olfactory learning
(A and B) Schematics depicting the protocol for odor-shock pairing with varying ISIs (A) and the T-maze assay for measuring the olfactory memory (B). (C–I) (C1–I1): schematics depicting the genetic perturbations affecting the serotonergic DPM-to-KC signaling. In (E), the CsChrimson-expressing DPM neuron was activated by continuous 635-nm light applied from the start of the odorant application to 3.75 s after the last electric shock being applied. (C2–I2) Summary of the PI measured with the indicated ISI; n = 3–10 for each group. (C3–I3): the relative PI-ISI profile was fitted to a sigmoid function; the t50 ± standard error, Hill coefficient, and R2 are shown. The dashed vertical line at 16.9 s represents the coincidence time window of olfactory learning measured in control flies. *p < 0.05; **p < 0.01; ***p < 0.001; and n.s., not significant (unpaired Student’s t test). See also Figure S3.
Figure 8.
Figure 8.. 5-HT from the DPM neuron serves as a specialized regulator of the coincidence time window
(A) Summary of the PI (A1) and ΔACh (A2) measured in the indicated flies with short and long ISIs; n = 3–10 for each group. (B) Correlation analysis of coincidence time windows (y axis: t50 ± standard error) measured in olfactory learning and that for inducing synaptic depression in the γ1 compartment (x axis: t50 ± standard error) of the indicated flies. The data were fit to a linear function, and the R2 is shown. (C) Schematics depicting the working model that the increase or decrease of 5-HT signal from the DPM neuron prolongs or shortens, respectively, the coincidence time window for inducing synaptic depression of ACh release from KCs, and it ultimately affects the olfactory learning behavior. ***p < 0.001 and n.s., not significant (unpaired Student’s t test). See also Figures S7 and S8

Similar articles

Cited by

References

    1. Pavlov IP (1927). Conditioned Reflexes: an Investigation of the Physiological Activity of the Cerebral Cortex (Oxford University Press; ). - PMC - PubMed
    1. Bernstein AL (1934). Temporal factors in the formation of conditioned eyelid reactions in human subjects. J. Gen. Psychol 10, 173–197.
    1. McAllister WR (1953). Eyelid conditioning as a function of the CS-US interval. J. Exp. Psychol 45, 417–422. 10.1037/h0059534. - DOI - PubMed
    1. Hawkins RD, Carew TJ, and Kandel ER (1986). Effects of interstimulus interval and contingency on classical conditioning of the Aplysia siphon withdrawal reflex. J. Neurosci 6, 1695–1701. - PMC - PubMed
    1. Carew TJ, Walters ET, and Kandel ER (1981). Classical conditioning in a simple withdrawal reflex in Aplysia californica. J. Neurosci 1, 1426–1437. - PMC - PubMed

Publication types

LinkOut - more resources