. 2023 Feb 13;41(2):356-372.e10.
doi: 10.1016/j.ccell.2023.01.002. Epub 2023 Jan 26.

Neutrophil-activating therapy for the treatment of cancer

Affiliations

Neutrophil-activating therapy for the treatment of cancer

Ian L Linde et al. Cancer Cell. .

Abstract

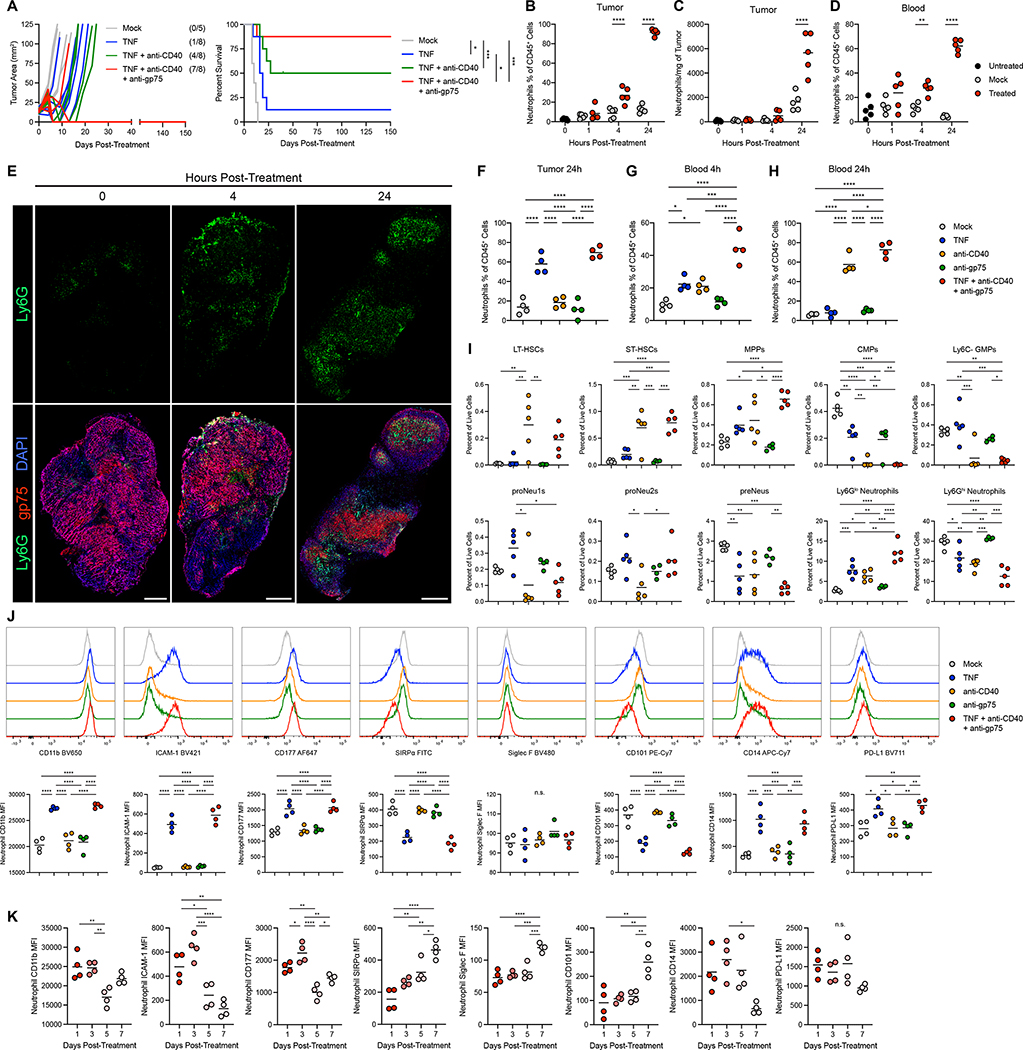
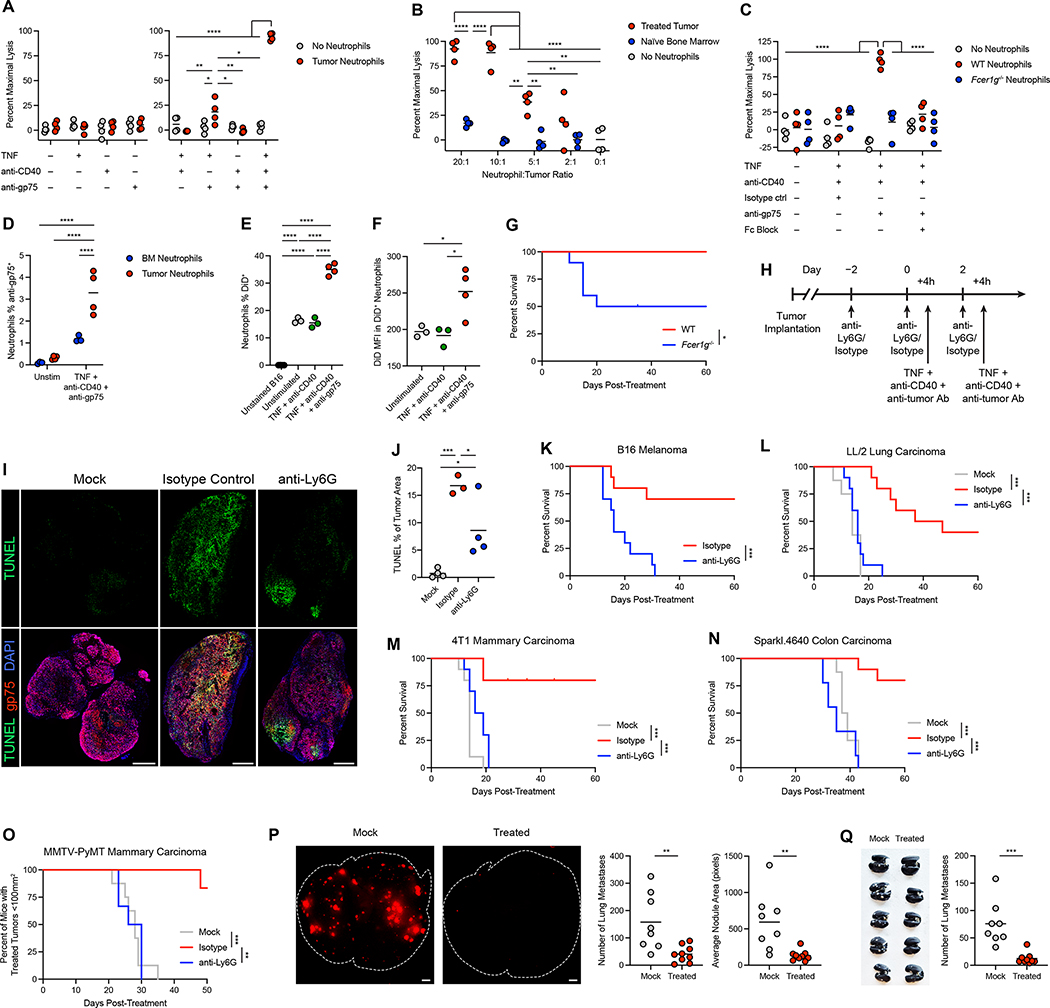
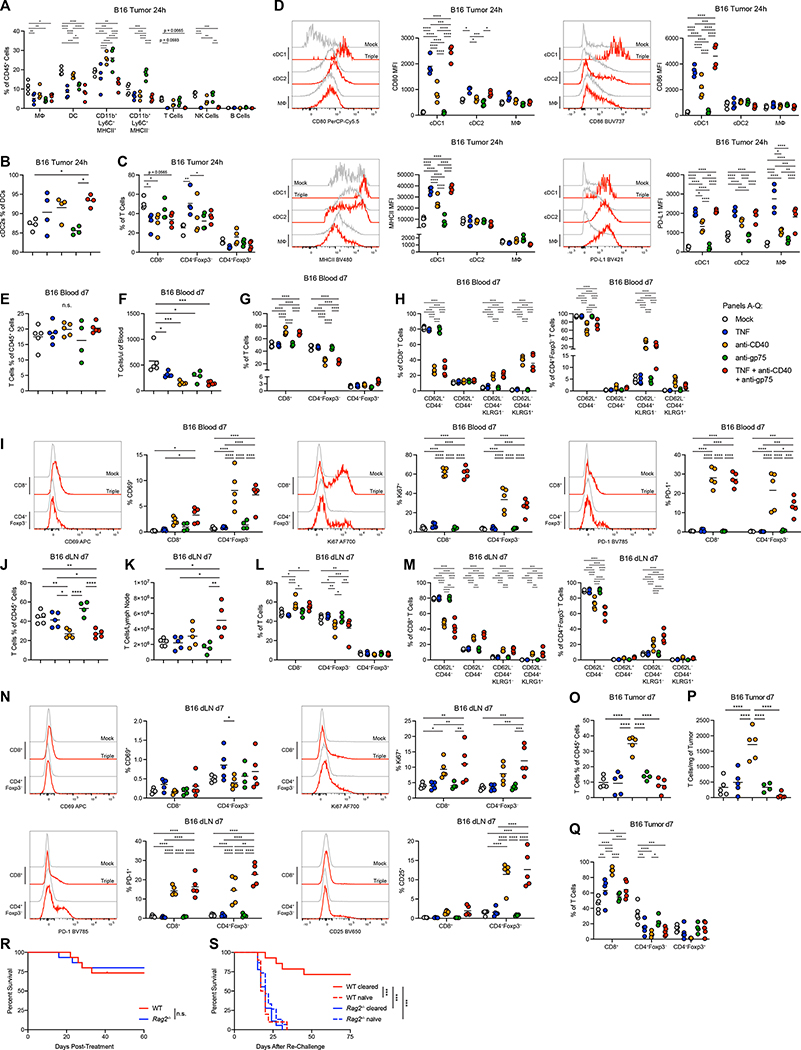
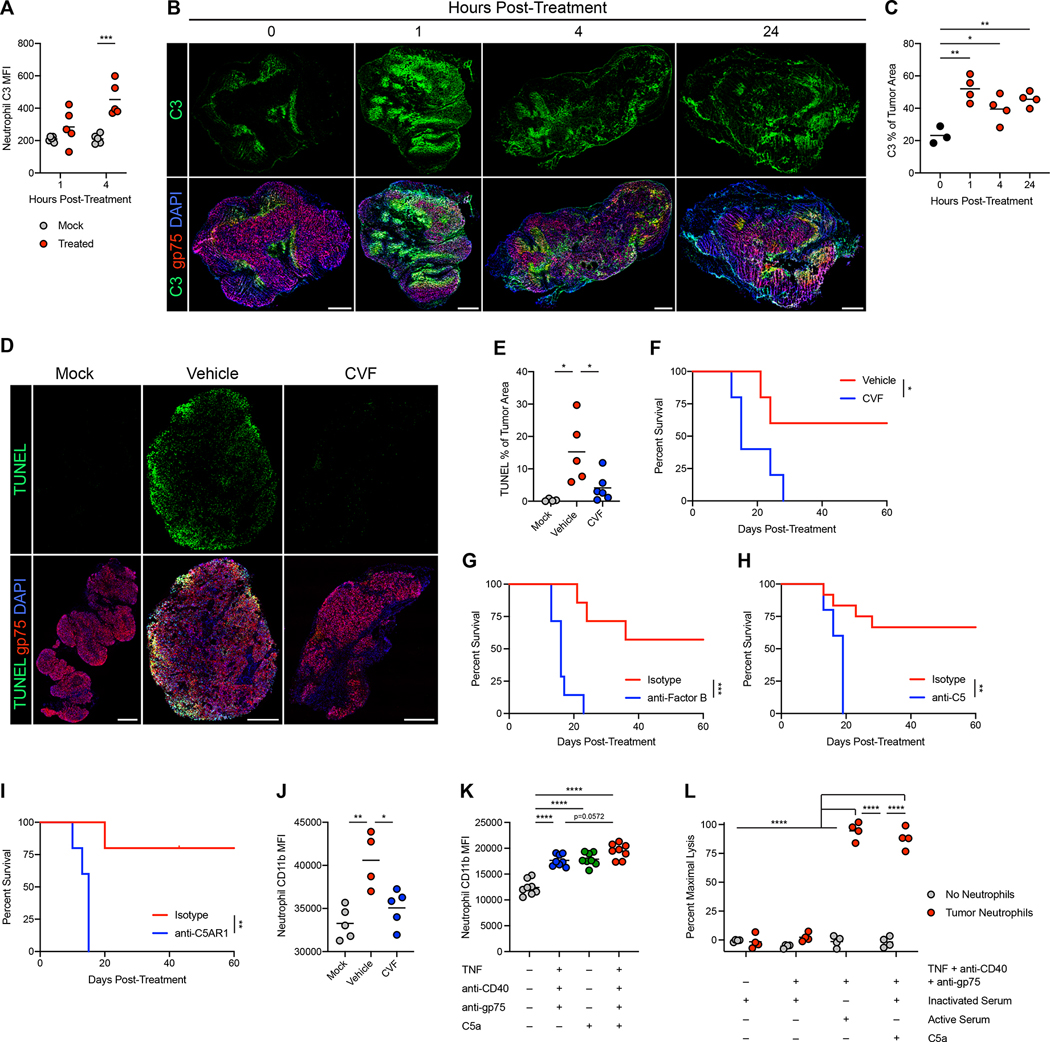
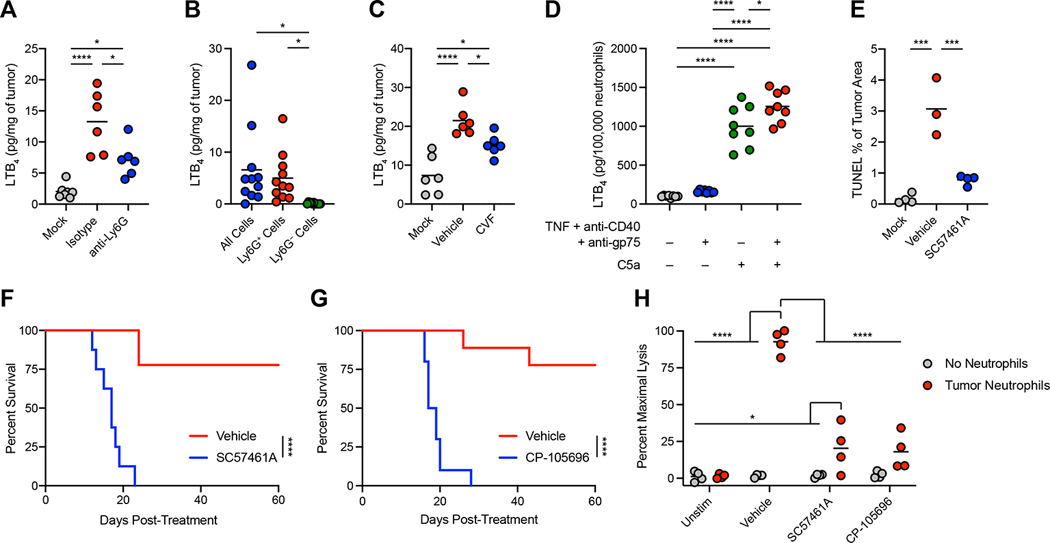
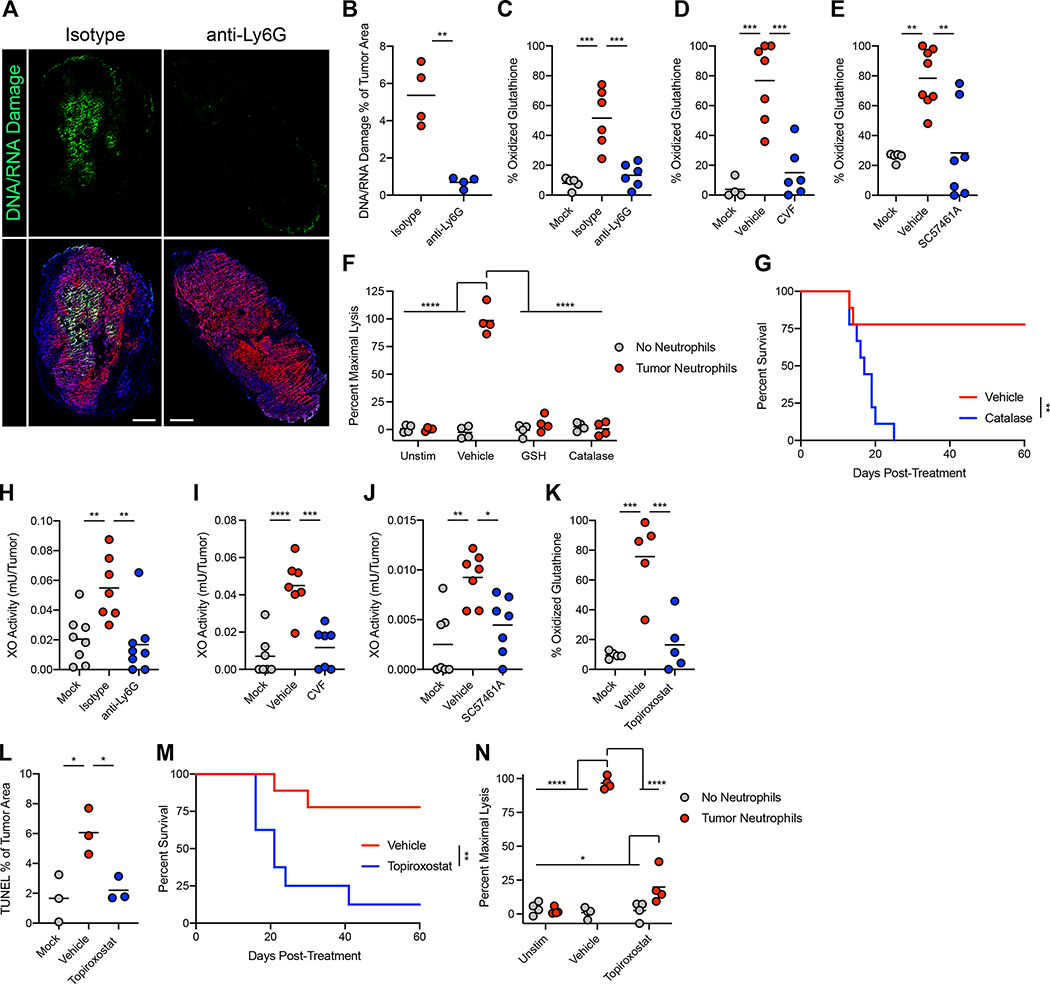
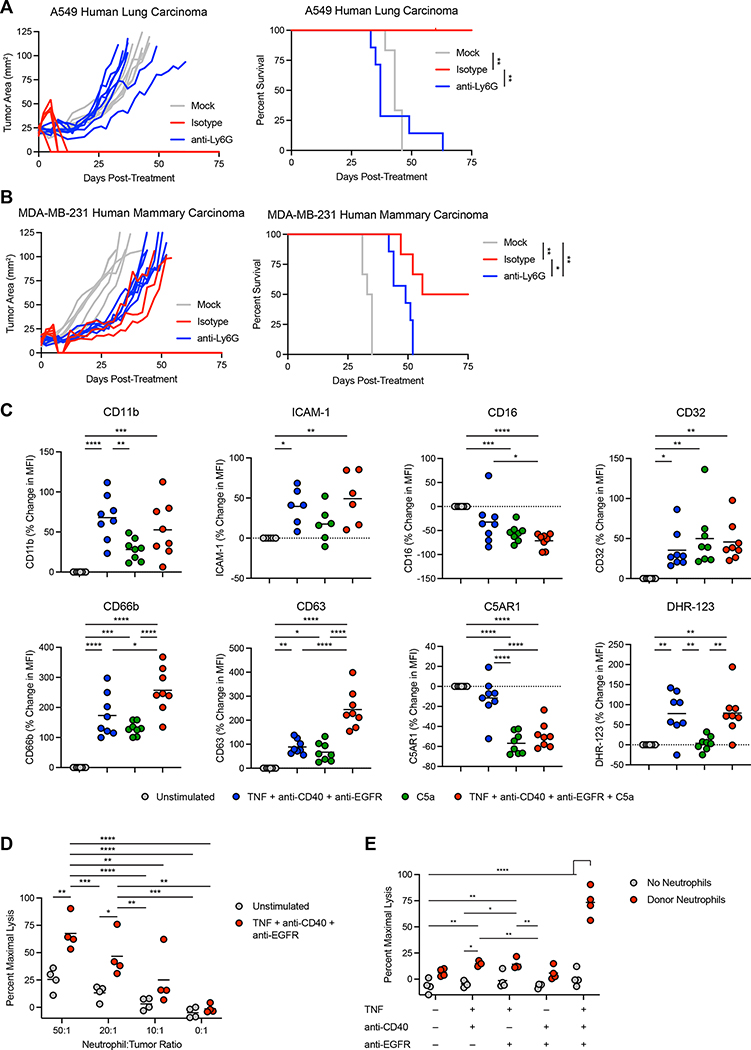
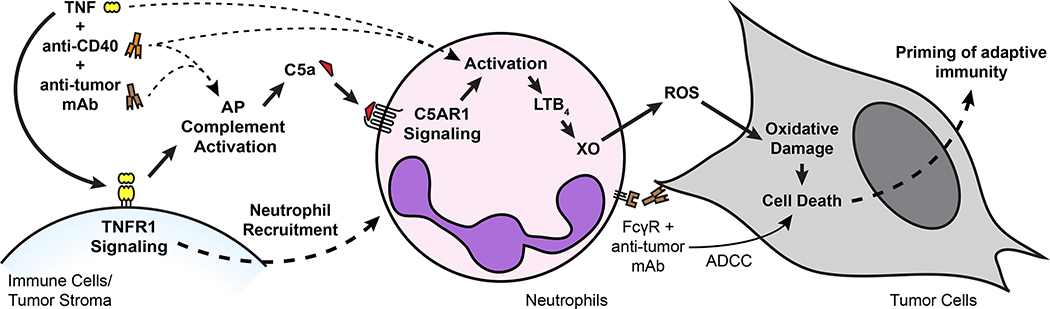
Despite their cytotoxic capacity, neutrophils are often co-opted by cancers to promote immunosuppression, tumor growth, and metastasis. Consequently, these cells have received little attention as potential cancer immunotherapeutic agents. Here, we demonstrate in mouse models that neutrophils can be harnessed to induce eradication of tumors and reduce metastatic seeding through the combined actions of tumor necrosis factor, CD40 agonist, and tumor-binding antibody. The same combination activates human neutrophils in vitro, enabling their lysis of human tumor cells. Mechanistically, this therapy induces rapid mobilization and tumor infiltration of neutrophils along with complement activation in tumors. Complement component C5a activates neutrophils to produce leukotriene B4, which stimulates reactive oxygen species production via xanthine oxidase, resulting in oxidative damage and T cell-independent clearance of multiple tumor types. These data establish neutrophils as potent anti-tumor immune mediators and define an inflammatory pathway that can be harnessed to drive neutrophil-mediated eradication of cancer.

Keywords: C5a; CD40; cancer immunotherapy; complement; leukotriene B4; neutrophil; reactive oxygen species; tumor immunology; tumor necrosis factor; xanthine oxidase.


Conflict of interest statement

Declaration of interests I.L.L., T.R.P., and E.G.E. are co-inventors on a patent application filed by Stanford University related to this work. W.-C.S. owns equity in, receives a consultant fee and research grant from, and is an inventor of patents licensed to Kira Pharmaceuticals and Aevitas Therapeutics. The other authors declare no competing interests.

Figures

Figure 1:
Figure 1:. Neutrophil-activating therapy recruits activated neutrophils to the tumor.
(A) (Left) Tumor growth in B16-bearing mice following treatment with the indicated components, indicating mice with undetectable tumors at the conclusion of the study in parentheses. (Right) Survival of the mice shown in the left panel. Mice were euthanized when tumors exceeded 100mm2. (B-C) Neutrophil frequency (B) and numbers (C) in B16 tumors following treatment with TNF + anti-CD40 + anti-gp75. (n=5) (D) Neutrophil frequency in peripheral blood following treatment with this neutrophil-activating therapy. (n=5) (E) Immunofluorescence of neutrophil infiltration in B16 tumors following treatment with neutrophil-activating therapy. Scale bars = 500 μm. (F-H) Neutrophil frequency in the tumor (F) and blood (G-H) 4 hours (G) or 24 hours (F, H) after treatment with the indicated components. (n=4) (I) Frequencies of HSCs and progenitors in the bone marrow 24 hours after treatment with neutrophil-activating therapy. (anti-gp75 n=4, other groups n=5) (J) Representative histograms (top) and median fluorescent intensity (MFI) (bottom) of surface markers on neutrophils infiltrating B16 tumors 4 hours after treatment with the indicated components. (n=4) (K) Surface marker expression on B16 tumor-infiltrating neutrophils following treatment with the full neutrophil-activating therapy. (n=4). Statistics: Log-rank test with Bonferroni correction (A), One-way ANOVA with Tukey’s multiple comparisons test (B-D, F-K). For all dot plots, the line indicates the mean. Data are representative of 2 (B-E) or 3 (F-H) independent experiments or pooled from 2 experiments (A). See also Figures S1, S2.
Figure 2:
Figure 2:. Therapeutically activated neutrophils eradicate multiple tumor types and reduce metastatic seeding.
(A) Lysis of B16 cells co-cultured with neutrophils isolated from treated tumors and stimulated in vitro with the indicated components. (n=4) (B) Lysis of B16 cells co-cultured with neutrophils isolated from treated tumors or tumor-naïve bone marrow, stimulated in vitro with TNF + anti-CD40 + anti-gp75. (n=4) (C) Lysis of B16 cells co-cultured with neutrophils isolated from treated tumors in WT or Fcer1g−/− mice, stimulated in vitro with TNF + anti-CD40 + anti-gp75 or isotype control, with or without anti-CD16/CD32 to block FcγRs. (n=4) (D) Signal from anti-gp75-AlexaFluor 647 in neutrophils isolated from treated tumors or naïve bone marrow and cultured in vitro with B16 cells together with TNF + anti-CD40 + anti-gp75-AlexaFluor 647 or no stimulation. (BM n=3, Tumor n=4) (E-F) Percent DiD+ neutrophils (E) and DiD MFI in DiD+ neutrophils (F) following co-culture of treated tumor neutrophils with DiD-labeled B16 and stimulation in vitro with the indicated components. (Unstained/triple n=4, Unstimulated/double n=3) (G) Survival of B16-bearing WT or Fcer1g−/− mice following treatment with neutrophil-activating therapy. (n=10) (H) Regimen for neutrophil depletion and therapy. Treatment was performed 4 hours after administration of anti-Ly6G or isotype control on days 0 and 2. (I-J) Representative TUNEL immunofluorescence (I) and quantification (J) in B16 tumors 24 hours after treatment with neutrophil-activating therapy, following neutrophil depletion with anti-Ly6G or isotype control. Scale bars = 500 μm. (Isotype n=3, others n=4) (K) Survival of B16-bearing mice administered anti-Ly6G or isotype control prior to neutrophil-activating therapy. (n=10) (L-N) Survival of mice bearing LL/2 (L) (mock n=8, others n=10), 4T1 (M) (n=10), and Sparkl.4640 (N) (mock n=8, isotype n=10, anti-Ly6G n=9) tumors administered anti-Ly6G or isotype control prior to neutrophil-activating therapy. (O) Percent of MMTV-PyMT mice with treated tumors below the threshold of 100 mm2 following treatment of one tumor per mouse in the context of anti-Ly6G or isotype control (mock n=8, others n=6). (P) Representative images of B16-tdTomato fluorescence in the lung (left) and quantification of the number and average area of tdTomato+ lung metastases (right) in mice bearing s.c. B16 tumors that were injected intravenously through the tail vein with B16-tdTomato one week after tumor implantation. Ten hours after tail vein injection, s.c. tumors were treated with mock or neutrophil-activating therapy, and the lungs were harvested and imaged 9 days after the tail vein injection. Lung borders are outlined in white. Scale bars = 1 mm. (mock n=8, treated n=9) (Q) Representative image of India ink-stained lungs (left) and number of lung metastases (right) 30 days after orthotopic implantation of 4T1, in mice receiving neutrophil-activating therapy or mock treatment (mock n=8, treated n=9). Statistics: Two-way ANOVA with Tukey’s multiple comparisons test (A-D), One-way ANOVA with Tukey’s multiple comparisons test (E-F, J), Log-rank test (F, K), Log-rank test with Bonferroni correction (L-O), unpaired two-tailed t test (P-Q). For all dot plots, the line indicates the mean. Data are representative of 2 (A-J, P) or 3 (K) independent experiments or pooled from 2 (Q), 3 (L-N), or 6 (O) experiments. See also Figure S3.
Figure 3:
Figure 3:. Therapy activates antigen-presenting cells and primes T cell memory.
(A) Frequency of immune cell subsets in B16 tumors 24 hours after treatment (n=4). (B) Percent of cDC2s out of total DCs in B16 tumors 24 hours after treatment (n=4). (C) Percent of T cell subsets out of total T cells in B16 tumors 24 hours after treatment (n=4). (D) Representative histograms and MFIs for markers expressed on APC populations in B16 tumors 24 hours after treatment (n=4). (E-F) Frequencies (E) and numbers (F) of T cells in the blood 7 days after treatment of B16 (anti-gp75 n=4, others n=5). (G) Percent of T cell subsets out of total T cells in the blood 7 days after treatment of B16 (anti-gp75 n=4, others n=5). (H) Memory and effector phenotypes of T cell subsets in the blood 7 days after treatment of B16 (anti-gp75 n=4, others n=5). (I) Representative histograms and MFIs for markers expressed on T cell subsets in the blood 7 days after treatment (anti-gp75 n=4, others n=5). (J-K) Frequencies (J) and numbers (K) of T cells in the dLN 7 days after treatment of B16 (anti-gp75 n=4, others n=5). (L) Percent of T cell subsets out of total T cells in the dLN 7 days after treatment of B16 (anti-gp75 n=4, others n=5). (M) Memory and effector phenotypes of T cell subsets in the dLN 7 days after treatment of B16 (anti-gp75 n=4, others n=5). (N) Representative histograms and MFIs for markers expressed on T cell subsets in the dLN 7 days after treatment (anti-gp75 n=4, others n=5). (O-P) Frequencies (O) and numbers (P) of T cells in the tumor 7 days after treatment of B16 (anti-gp75 n=4, others n=5). (Q) Percent of T cell subsets out of total T cells in the tumor 7 days after treatment of B16 (anti-gp75 n=4, others n=5). (R) Survival of B16-bearing WT or Rag2−/− mice treated with neutrophil-activating therapy (n=15). (S) Survival of WT or Rag2−/− mice following implantation of B16 in tumor-naïve or B16-cleared mice 50 days after initial treatment with neutrophil-activating therapy (WT cleared n=14, Rag2−/− cleared n=18, WT naïve n=10, Rag2−/− naïve n=15). Statistics: Two-way ANOVA with Tukey’s multiple comparisons test (A, E-I, L-N, Q), One-way ANOVA with Tukey’s multiple comparisons test (B-D, J-K, O-P), Log-rank test (R), Log-rank test with Bonferroni correction (S). For all dot plots, the line indicates the mean. Data are representative of 2 (A-Q, S) or 3 (R) independent experiments. See also Figures S4, S5.
Figure 4:
Figure 4:. Complement activates tumor-infiltrating neutrophils through C5AR1.
(A) Deposition of C3 on B16 tumor-infiltrating neutrophils following treatment with neutrophil-activating therapy (n=5). (B-C) Representative immunofluorescence (B) and quantification (C) of C3 staining in B16 tumors after treatment. Scale bars = 500 μm. (0h n=3, others n=4) (D-E) Representative immunofluorescence (D) and quantification (E) of TUNEL staining in B16 tumors 24 hours after treatment of mice that had received CVF or vehicle prior to treatment. Scale bars = 500 μm. (mock n=4, vehicle n=5, CVF n=6) (F) Survival of B16-bearing mice administered CVF prior to treatment with neutrophil-activating therapy. (n=5) (G-I) Survival of B16-bearing mice administered anti-Factor B (G) (n=7), anti-C5 (H) (isotype n=12, anti-C5 n=5), and anti-C5AR1 (I) (n=5) blocking antibodies prior to treatment. (J) Expression of CD11b on B16 tumor-infiltrating neutrophils 4 hours after treatment following CVF or vehicle administration (vehicle n=4, others n=5). (K) Expression of CD11b on naïve neutrophils following stimulation in vitro with the indicated factors (n=8). (L) Lysis of B16 cells co-cultured with neutrophils isolated from treated tumors and stimulated in vitro with the indicated factors (n=4). Statistics: Two-way ANOVA with Tukey’s multiple comparisons test (A, L), One-way ANOVA with Tukey’s multiple comparisons test (C, E, J-K), Log-rank test (F-I). For all dot plots, the line indicates the mean. Data are representative of 2 (A-C, F-G, I-L) or 3 (D-E) independent experiments or pooled from 2 experiments (H). See also Figures S6, S7.
Figure 5:
Figure 5:. Secretion of leukotriene B4 by C5a-activated neutrophils drives tumor clearance.
(A) LTB4 levels in B16 tumors 24 hours after treatment with neutrophil-activating therapy following neutrophil depletion by anti-Ly6G (mock n=7, others n=6). (B) LTB4 produced ex vivo by cells harvested from B16 tumors 12 hours after treatment (n=11). (C) LTB4 levels in B16 tumors 24 hours after treatment following administration of CVF (n=6). (D) LTB4 production by naïve neutrophils following stimulation in vitro with the indicated factors (n=8). (E) Quantification of TUNEL staining in B16 tumors 24 hours after treatment with neutrophil-activating therapy following administration of SC57461A (vehicle n=3, others n=4). (F-G) Survival of B16-bearing mice after treatment following administration of SC57461A (F) (vehicle n=9, SC57461A n=8) or CP-105696 (G) (vehicle=9, CP-105696 n=10). (H) Lysis of B16 cells co-cultured with neutrophils isolated from treated tumors and stimulated in vitro with neutrophil-activating therapy together with the indicated inhibitors (n=4). Statistics: One-way ANOVA with Tukey’s multiple comparisons test (A, C-E), Repeated measures one-way ANOVA with Tukey’s multiple comparisons test (B), Log-rank test (F-G), Two-way ANOVA with Tukey’s multiple comparisons test (H). For all dot plots, the line indicates the mean. Data are representative of 2 (A, C-D, H) or 1 (E) independent experiments or pooled from 2 experiments (B, F-G). See also Figure S8.
Figure 6:
Figure 6:. LTB4-dependent induction of xanthine oxidase induces oxidative damage and tumor clearance.
(A-B) Representative immunofluorescence (A) and quantification (B) of DNA/RNA oxidative damage in B16 tumors 24 hours post-treatment with neutrophil-activating therapy. Scale bars = 500 μm. (n=4) (C-E) Percent oxidized glutathione in B16 lysates 24 hours after treatment with neutrophil-activating therapy following administration of anti-Ly6G (C) (mock n=5, others n=6), CVF (D) (mock n=4, vehicle n=7, CVF n=6), or SC57461A (E) (mock n=5, vehicle n=8, SC57461A n=7). (F) Lysis of B16 cells co-cultured with neutrophils isolated from treated tumors and stimulated in vitro with neutrophil-activating therapy together with the indicated inhibitors (n=4). (G) Survival of B16-bearing mice treated with neutrophil-activating therapy following administration of catalase (n=9). (H-J) XO activity in the tumor 24 hours after treatment of B16 with neutrophil-activating therapy following administration of anti-Ly6G (H) (isotype n=7, others n=8), CVF (I) (n=7), or SC57461A (J) (n=7). (K) Percent oxidized glutathione in B16 lysates 24 hours after treatment following administration of topiroxostat (n=5). (L) Quantification of TUNEL staining in B16 tumors 24 hours after treatment with neutrophil-activating therapy following administration of topiroxostat (n=3). (M) Survival of B16-bearing mice treated with neutrophil-activating therapy following administration of topiroxostat (vehicle n=9, topiroxostat n=8). (N) Lysis of B16 cells co-cultured with neutrophils isolated from treated tumors and stimulated in vitro with neutrophil-activating therapy in the presence of topiroxostat (n=4). Statistics: One-way ANOVA with Tukey’s multiple comparisons test (B-E, H-L), Two-way ANOVA with Tukey’s multiple comparisons test (F, N), Log-rank test (G, M). For all dot plots, the line indicates the mean. Data are representative of 2 (F, I-K, M-N) or 1 (A-B, L) independent experiments or pooled from 2 experiments (C-E, G-H). See also Figure S8.
Figure 7:
Figure 7:. Neutrophil-activating therapy activates human neutrophils to kill tumors.
(A-B) Survival of Rag2−/− Il2rg−/− mice bearing subcutaneous A549 (A) (anti-Ly6G n=7, others n=6) or orthotopic MDA-MB-231 (B) (anti-Ly6G n=7, others n=6) treated with neutrophil-activating therapy following anti-Ly6G administration. (C) Cell surface markers on neutrophils from the peripheral blood of healthy human donors following stimulation with the indicated components for 30 minutes (ICAM-1 n=6, others n=8). (D-E) Lysis of A549 cells co-cultured with neutrophils isolated from healthy donor peripheral blood and stimulated in vitro with the indicated components (n=4). Statistics: Log-rank test with Bonferroni correction (A-B), One-way ANOVA with Tukey’s multiple comparisons test (C), Two-way ANOVA with Tukey’s multiple comparisons test (D-E). For all dot plots, the line indicates the mean. Data are representative of 2 independent experiments (D-E) or pooled from 2 (B-C) or 3 (A) experiments.
Figure 8:
Figure 8:. Proposed mechanism of neutrophil-dependent tumor eradication.
Treatment with neutrophil-activating therapy recruits neutrophils to the tumor through TNFR1 signaling and activates the complement AP, generating C5a. C5a signals through C5AR1 in neutrophils and induces neutrophil activation and production of LTB4, which drives XO activity in the tumor environment. ROS produced by XO induce oxidative damage and death in tumor cells, driving tumor clearance. Tumor-binding antibody contributes to neutrophil killing of tumor cells by inducing ADCC, possibly involving trogocytosis. While not dependent on adaptive immunity, this process is capable of priming protective immune memory.

Comment in

References

    1. Coffelt SB, Wellenstein MD, and de Visser KE (2016). Neutrophils in cancer: neutral no more. Nature reviews. Cancer 16, 431–446. 10.1038/nrc.2016.52. - DOI - PubMed
    1. Jaillon S, Ponzetta A, Di Mitri D, Santoni A, Bonecchi R, and Mantovani A (2020). Neutrophil diversity and plasticity in tumour progression and therapy. Nature Reviews Cancer 20, 485–503. 10.1038/s41568-020-0281-y. - DOI - PubMed
    1. Mantovani A, Cassatella MA, Costantini C, and Jaillon S (2011). Neutrophils in the activation and regulation of innate and adaptive immunity. Nature Reviews Immunology 11, 519–531. 10.1038/nri3024. - DOI - PubMed
    1. Gentles AJ, Newman AM, Liu CL, Bratman SV, Feng W, Kim D, Nair VS, Xu Y, Khuong A, Hoang CD, et al. (2015). The prognostic landscape of genes and infiltrating immune cells across human cancers. Nature Medicine 21, 938–945. 10.1038/nm.3909. - DOI - PMC - PubMed
    1. Shaul ME, and Fridlender ZG (2019). Tumour-associated neutrophils in patients with cancer. Nature reviews. Clinical oncology 16, 601–620. 10.1038/s41571-019-0222-4. - DOI - PubMed

Publication types