

Spatial, temporal and evolutionary insight into seasonal epidemic Influenza A virus strains near the equatorial line: The case of Ecuador
- PMID: 36706806
- PMCID: PMC10194173
- DOI: 10.1016/j.virusres.2023.199051
Spatial, temporal and evolutionary insight into seasonal epidemic Influenza A virus strains near the equatorial line: The case of Ecuador
Abstract
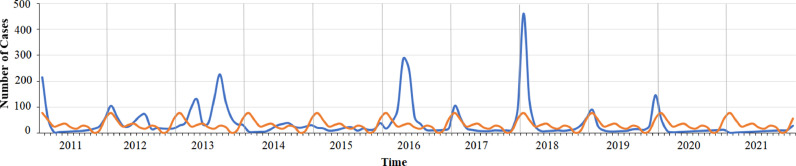
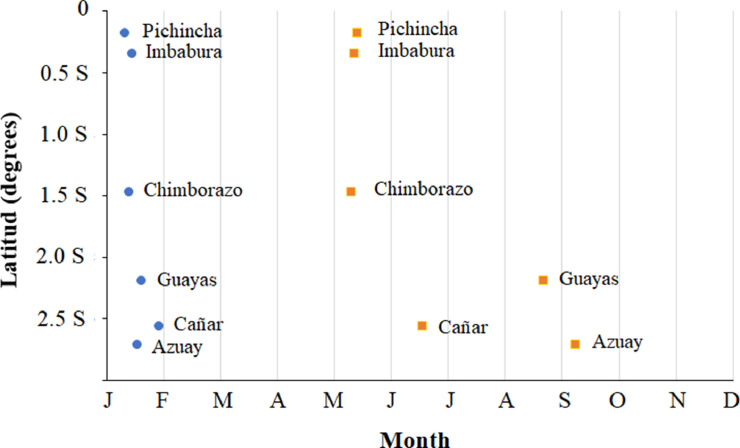
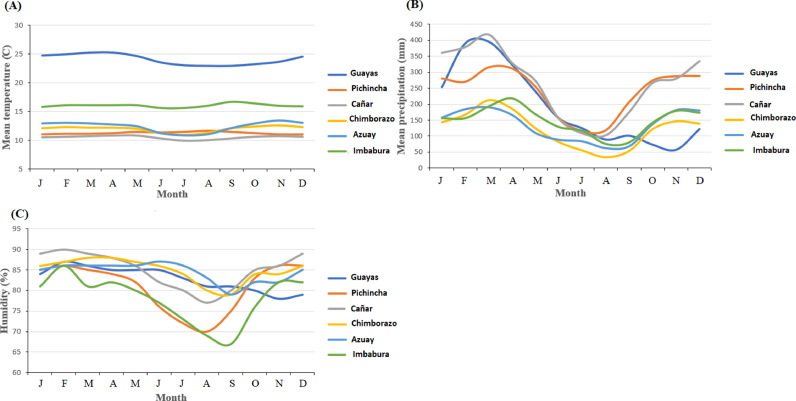
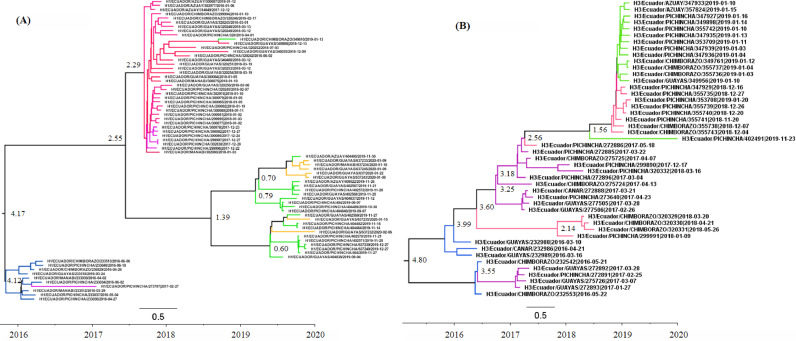
To study the spatial and temporal patterns of Influenza A virus (IAV) is essential for an efficient control of the disease caused by IAV and efficient vaccination programs. However, spatiotemporal patterns of spread as well as genetic lineage circulation of IAV on a countrywide scale have not been clearly determined for many tropical regions of the world. In order to gain insight into these matters, the spatial and temporal patterns of IAV in six different geographic regions of Ecuador, from 2011 to 2021, were determined and the timing and magnitude of IAV outbreaks in these localities investigated. The results of these studies revealed that although Ecuador is a South American country situated in the Equator line, its IAV epidemiology resembles that of temperate Northern Hemisphere countries. Phylogenetic analysis of H1N1pdm09 and H3N2 IAV strains isolated in five different localities of Ecuador revealed that provinces in the south of this country have the largest effective population size by comparison with provinces in the north, suggesting that the southern provinces may be acting as a source of IAV. Co-circulation of different H1N1pdm09 and H3N2 genetic lineages was observed in different geographic regions of Ecuador.
Keywords: Bayesian; Ecuador; Evolution; Influenza A virus; Time series.
Copyright © 2023. Published by Elsevier B.V.
Conflict of interest statement
Declaration of Competing Interest The authors declare that they have no known competing financial interests or personal relationships that could have appeared to influence the work reported in this paper.
Figures
Similar articles
-
Influenza A Viruses of Swine (IAV-S) in Vietnam from 2010 to 2015: Multiple Introductions of A(H1N1)pdm09 Viruses into the Pig Population and Diversifying Genetic Constellations of Enzootic IAV-S.J Virol. 2016 Dec 16;91(1):e01490-16. doi: 10.1128/JVI.01490-16. Print 2017 Jan 1. J Virol. 2016. PMID: 27795418 Free PMC article.
-
Genetic and Antigenic Characterization of an Expanding H3 Influenza A Virus Clade in U.S. Swine Visualized by Nextstrain.mSphere. 2022 Jun 29;7(3):e0099421. doi: 10.1128/msphere.00994-21. Epub 2022 May 9. mSphere. 2022. PMID: 35766502 Free PMC article.
-
Human influenza A viruses isolated in South America: genetic relations, adamantane resistance and vaccine strain match.Infect Genet Evol. 2009 Mar;9(2):229-34. doi: 10.1016/j.meegid.2008.11.004. Epub 2008 Nov 27. Infect Genet Evol. 2009. PMID: 19095085
-
Swine Influenza A Viruses and the Tangled Relationship with Humans.Cold Spring Harb Perspect Med. 2021 Mar 1;11(3):a038737. doi: 10.1101/cshperspect.a038737. Cold Spring Harb Perspect Med. 2021. PMID: 31988203 Free PMC article. Review.
-
[Swine influenza virus: evolution mechanism and epidemic characterization--a review].Wei Sheng Wu Xue Bao. 2009 Sep;49(9):1138-45. Wei Sheng Wu Xue Bao. 2009. PMID: 20030049 Review. Chinese.
References
Publication types
MeSH terms
LinkOut - more resources
Full Text Sources
Medical
