. 2023;15(5):1085-1104.
doi: 10.1016/j.jcmgh.2023.01.002. Epub 2023 Jan 25.

Targeting Notch1-YAP Circuit Reprograms Macrophage Polarization and Alleviates Acute Liver Injury in Mice

Affiliations

Targeting Notch1-YAP Circuit Reprograms Macrophage Polarization and Alleviates Acute Liver Injury in Mice

Yan Yang et al. Cell Mol Gastroenterol Hepatol. 2023.

Abstract

Background & aims: Hepatic immune system disorder plays a critical role in the pathogenesis of acute liver injury. The intrinsic signaling mechanisms responsible for dampening excessive activation of liver macrophages are not completely understood. The Notch and Hippo-YAP signaling pathways have been implicated in immune homeostasis. In this study, we investigated the interactive cell signaling networks of Notch1/YAP pathway during acute liver injury.

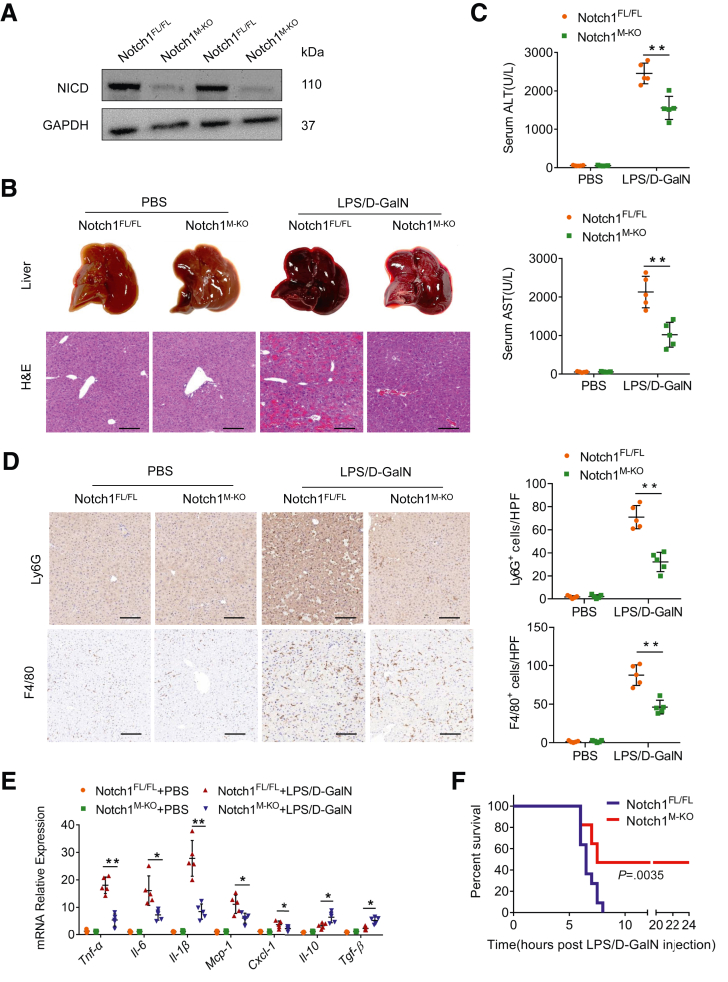
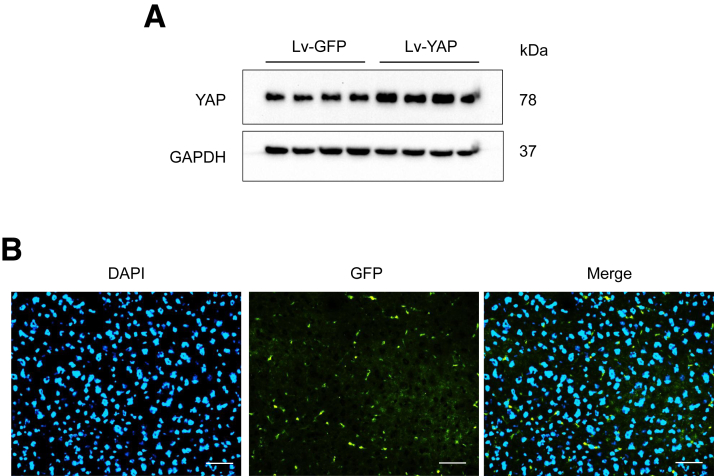
Methods: Myeloid-specific Notch1 knockout (Notch1M-KO) mice and the floxed Notch1 (Notch1FL/FL) mice were subjected to lipopolysaccharide/D-galactosamine toxicity. Some mice were injected via the tail vein with bone marrow-derived macrophages transfected with lentivirus-expressing YAP. Some mice were injected with YAP siRNA using an in vivo mannose-mediated delivery system.

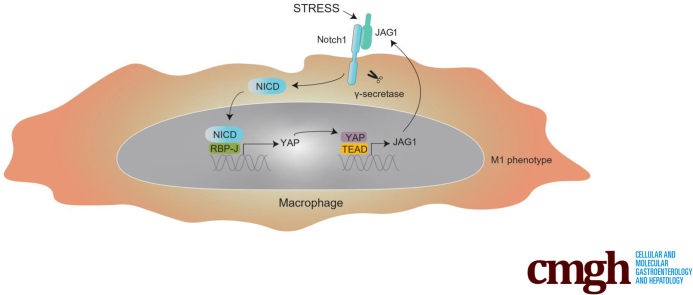
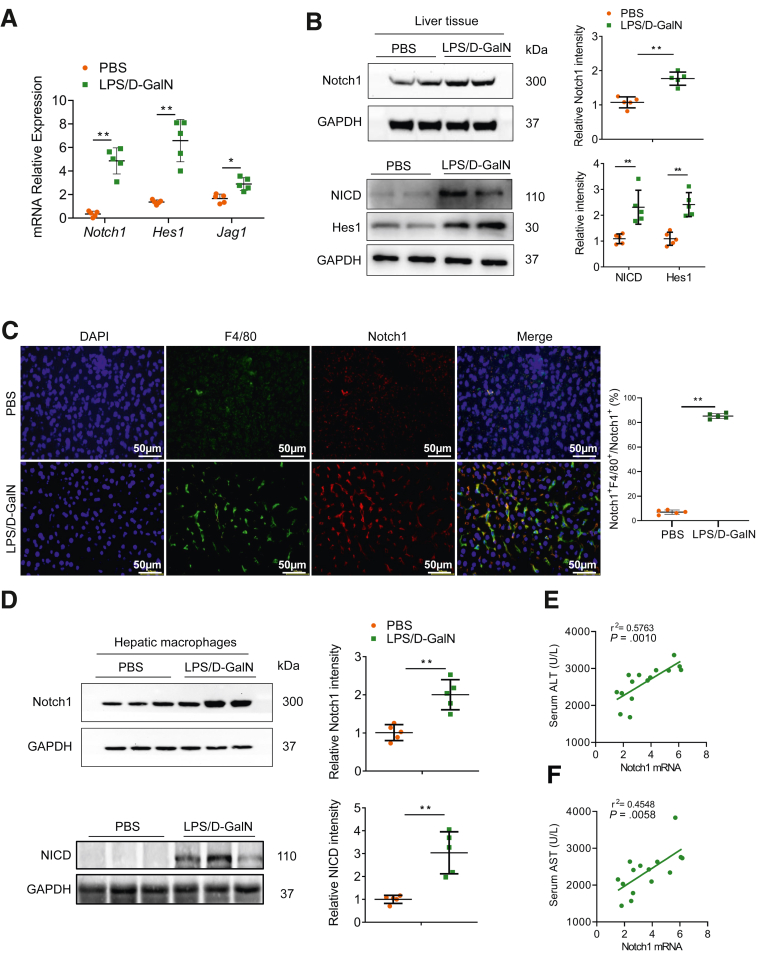
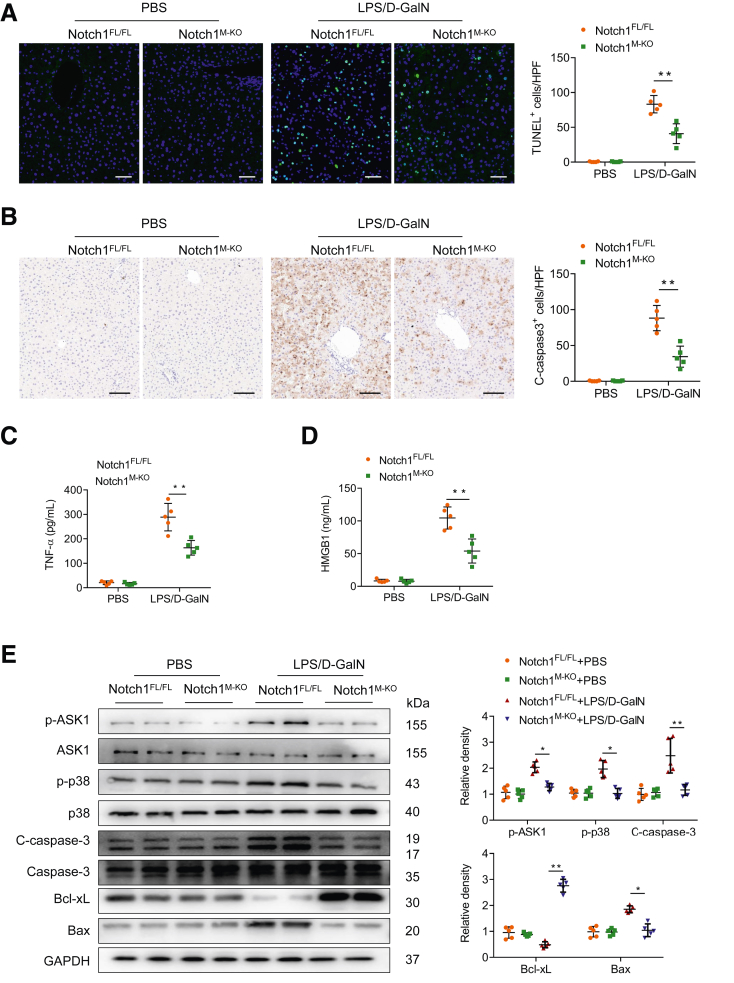
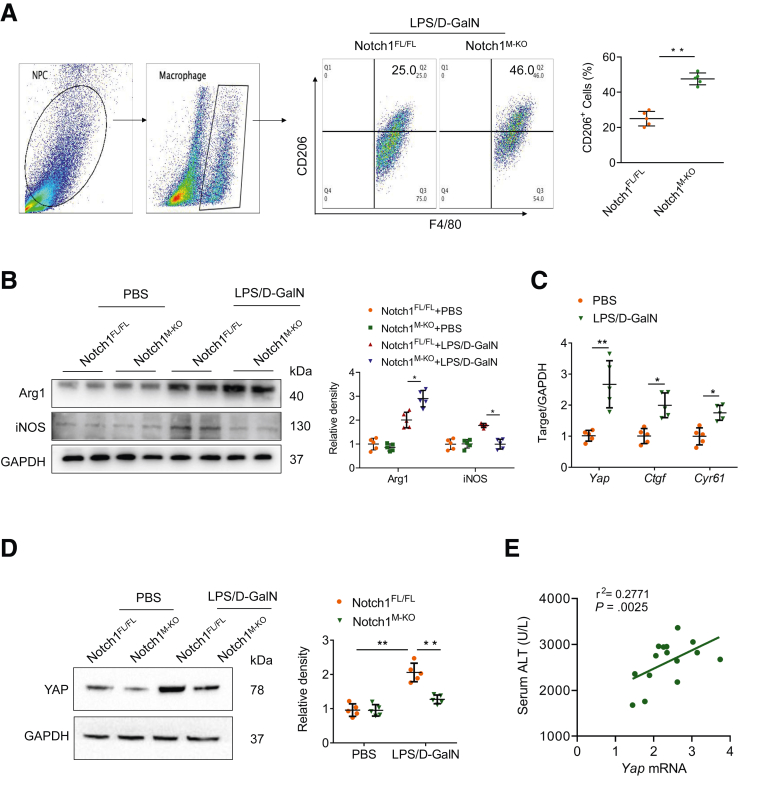
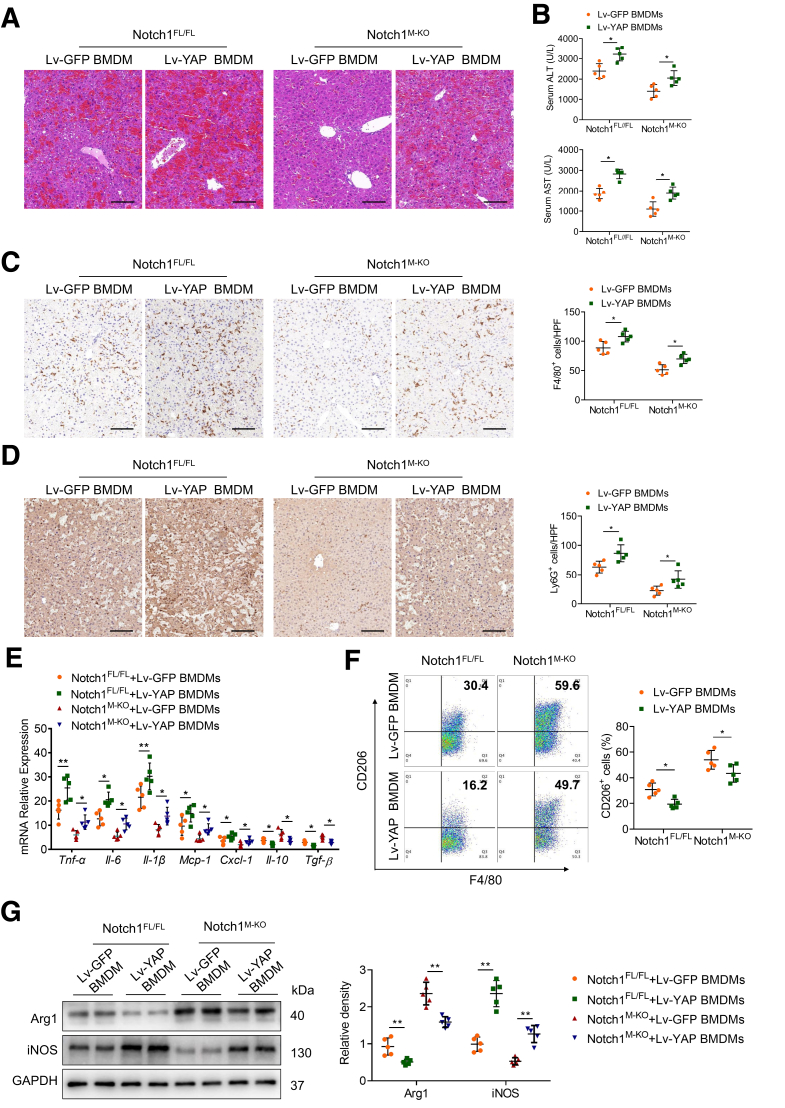
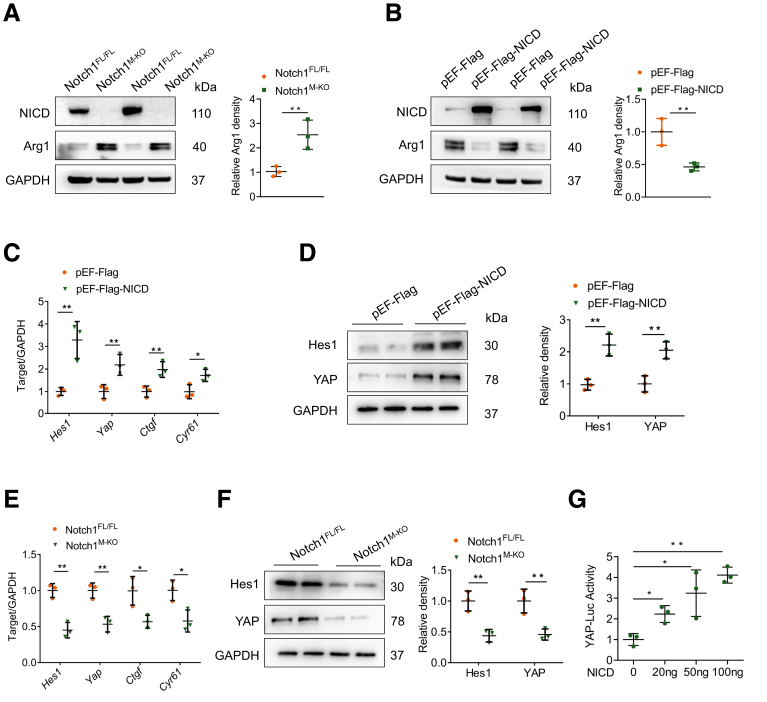
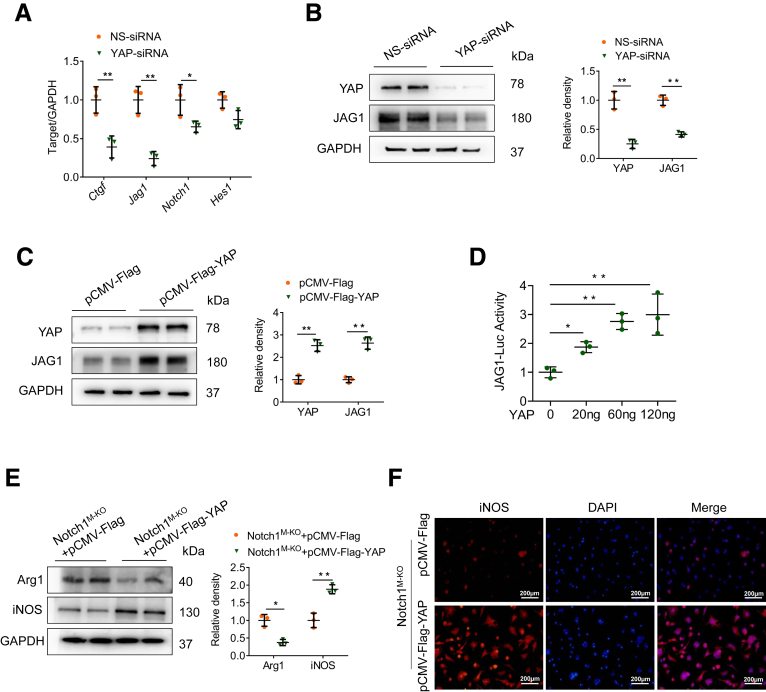
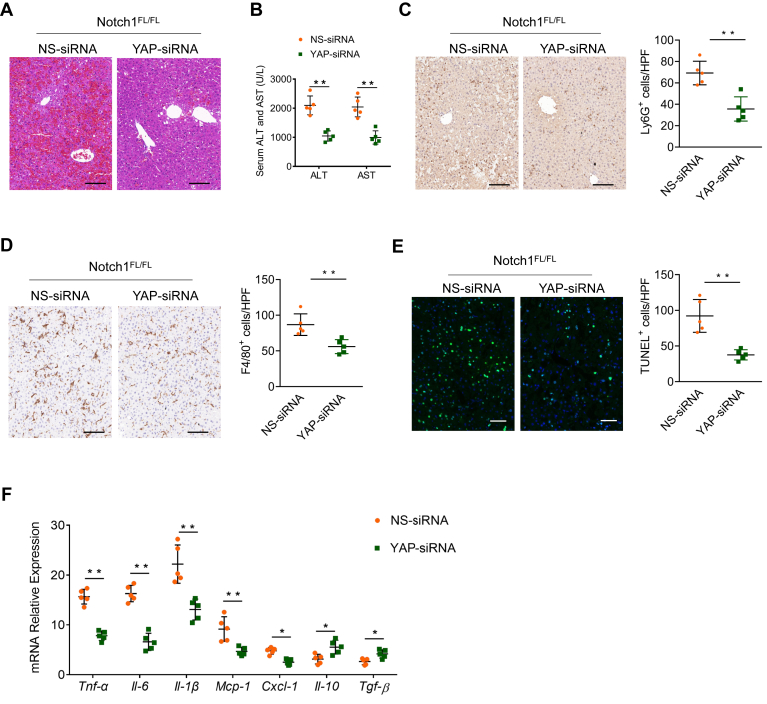
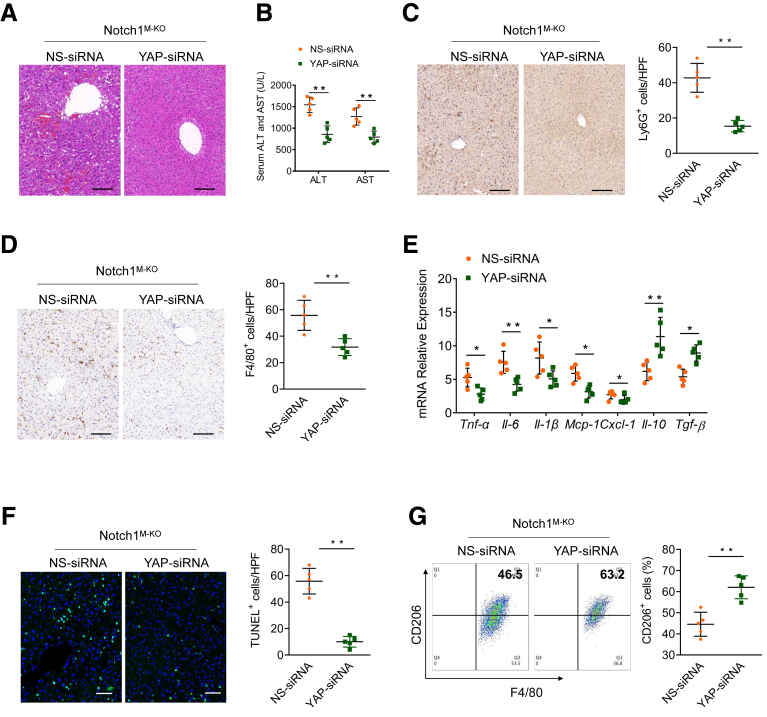
Results: We found that the activated Notch1 and YAP signaling in liver macrophages were closely related to lipopolysaccharide/D-galactosamine-induced acute liver injury. Macrophage/neutrophil infiltration, proinflammatory mediators, and hepatocellular apoptosis were markedly ameliorated in Notch1M-KO mice. Importantly, myeloid Notch1 deficiency depressed YAP signaling and facilitated M2 macrophage polarization in the injured liver. Furthermore, YAP overexpression in Notch1M-KO livers exacerbated liver damage and shifted macrophage polarization toward the M1 phenotype. Mechanistically, macrophage Notch1 signaling could transcriptionally activate YAP gene expression. Reciprocally, YAP transcriptionally upregulated the Notch ligand Jagged1 gene expression and was essential for Notch1-mediated macrophage polarization. Finally, dual inhibition of Notch1 and YAP in macrophages further promoted M2 polarization and alleviated liver damage.

Conclusions: Our findings underscore a novel molecular insight into the Notch1-YAP circuit for controlling macrophage polarization in acute liver injury, raising the possibility of targeting macrophage Notch1-YAP circuit as an effective strategy for liver inflammation-related diseases.

Keywords: Acute Liver Injury; Liver Inflammation; Macrophage Polarization; Notch Signaling; YAP.


Figures

None
Graphical abstract
Figure 1
Figure 1
Myeloid Notch1 signaling is closely related to LPS/D-GalN-induced liver injury. (A) The expressions of Notch1, Hes1, and Jag1 in the liver tissue of wild-type mice subjected to PBS or LPS (50 μg/kg) combined with D-GalN (700 mg/kg) for 5 hours (n = 5 mice/group). (B) Western blot analysis of Notch1 and NICD expression in liver tissue from wild-type mice treated with PBS or LPS/D-GalN injection (n = 5 mice/group). (C) Immunofluorescence images of staining with antibodies against F4/80 (green) and Notch1 (red). Nuclei were labeled with DAPI (blue). n = 5 mice/group. Scale bar, 50 μm. (D) Hepatic macrophages were isolated from mice after PBS or LPS/D-GalN injection. Notch1 and NICD expression was examined by immunoblotting. The correlation between serum ALT (E) or AST levels (F) and Notch1 expression in hepatic macrophages after LPS/D-GalN injection (n = 15 mice). The correlation coefficient was calculated by the Pearson correlation test. Data are presented as the mean ± standard deviation. ∗P < .05, ∗∗P < .01.
Figure 2
Figure 2
Myeloid-specific deletion of Notch1 alleviates LPS/D-GalN-induced liver inflammation. (A) The NICD expression was detected by Western blot assay in hepatic macrophages from the Notch1FL/FL and Notch1M-KO livers. (B) The representative gross appearance of the collected livers and histologic staining (H&E) of liver sections from Notch1FL/FL and Notch1M-KO mice after PBS or LPS/D-GalN injection (n = 5 mice/group). Scale bars, 100 μm. (C) Liver function in serum samples was evaluated by serum ALT and AST levels (IU/L) (n = 5 samples/group). (D) Immunohistochemistry staining and quantification of Ly6G+ neutrophils and F4/80+ macrophages in liver sections (n = 5 mice/group). Scale bars, 40 μm. (E) Quantitative reverse-transcriptase polymerase chain reaction–assisted detection of proinflammatory cytokines (Tnf-α, Il-6, and Il-1β), chemokines (Mcp-1 and Cxcl-1), and anti-inflammatory cytokines (Il-10 and Tgf-β) in liver tissues (n = 5 samples/group). (F) Kaplan-Meier survival curve comparing percent survival of Notch1FL/FL and Notch1M-KO mice treated with LPS (50 μg/kg) and D-GalN (700 mg/kg) (n = 9–11 mice/group). Data are presented as the mean ± standard deviation. ∗P < .05, ∗∗P < .01.
Figure 3
Figure 3
Myeloid-specific deletion of Notch1 alleviates LPS/D-GalN-induced hepatocellular apoptosis. (A) Representative TUNEL staining images and quantification of TUNEL+ cells in liver sections from the Notch1FL/FL and Notch1M-KO mice treated with PBS or LPS/D-GalN injection (n = 5 mice/group). Scale bars, 20 μm. (B) Immunohistochemistry staining and quantification of cleaved caspase-3 (C-caspase-3) positive cells in liver sections (n = 5 mice/group). Scale bars, 40 μm. ELISA analysis of serum TNF-α (C) and HMGB1 (D) levels in the Notch1FL/FL and Notch1M-KO mice (n = 5 samples/group). (E) Western blot analysis and relative density ratio of p-ASK1, ASK1, p-p38, p38, C-caspase-3, caspase-3, Bcl-xL, and Bax in the Notch1FL/FL and Notch1M-KO livers. Data are presented as the mean ± standard deviation. ∗P < .05, ∗∗P < .01.
Figure 4
Figure 4
Myeloid Notch1 deficiency depresses YAP signaling and reprograms macrophage polarization. (A) Flow cytometry analysis of liver macrophages isolated from Notch1FL/FL and Notch1M-KO mice (n = 5 mice/group). (B) The Arg1 and iNOS expression were detected by Western blot assay in liver macrophages from Notch1FL/FL and Notch1M-KO mice treated with PBS or LPS/D-GalN injection. (C) Quantitative reverse-transcriptase polymerase chain reaction analysis of Yap, Ctgf, and Cyr61 in liver macrophages (n = 5 samples/group). (D) The expression of YAP in liver macrophages from Notch1M-KO and Notch1FL/FL mice, as measured by Western blot analysis. (E) The correlation between serum ALT levels and Yap mRNA expression in liver macrophages after LPS/D-GalN injection (n = 15 mice). The correlation coefficient was calculated by the Pearson correlation test. Data are presented as the mean ± standard deviation. ∗P < .05, ∗∗P < .01.
Figure 5
Figure 5
BMDMs were transfected with lentivirus expressing YAP (Lv-YAP) or GFP control (Lv-GFP) and adoptively transferred into mice. (A) Western blots of YAP expression in BMDMs after Lv-YAP transduction. (B) Representative immunofluorescence staining images of the infused Lv-GFP-transfected BMDMs in the liver after the LPS/D-GalN challenge. Scale bars, 20 μm.
Figure 6
Figure 6
YAP is required for Notch1-mediated macrophage polarization and liver inflammation. BMDMs from Notch1FL/FL and Notch1M-KO mice were transfected with lentivirus expressing YAP (Lv-YAP) or GFP control (Lv-GFP) and adoptively transferred into Notch1FL/FL and Notch1M-KO mice, respectively. (A) Representative H&E staining of liver sections (n = 5 mice/group). Scale bars, 100 μm. (B) The serum ALT and AST levels from the indicated groups. (C, D) Representative immunohistochemistry staining and quantification of F4/80+ macrophages and Ly6G+ neutrophils in liver sections (n = 5 mice/group). Scale bars, 40 μm. (E) Quantitative reverse-transcriptase polymerase chain reaction–assisted detection of proinflammatory cytokines (Tnf-α, Il-6, and Il-1β), chemokines (Mcp-1 and Cxcl-1), and anti-inflammatory cytokines (Il-10 and Tgf-β) in liver tissues (n = 5 samples/group). (F) Flow cytometry analysis of liver macrophages isolated from Notch1FL/FL and Notch1M-KO mice (n = 5 mice/group). (G) The expression of Arg1 and iNOS in liver macrophages from Notch1FL/FL and Notch1M-KO mice, as measured by Western blot analysis. Data are presented as the mean ± standard deviation. ∗P < .05, ∗∗P < .01.
Figure 7
Figure 7
Notch1 activation upregulates YAP signaling in macrophages. (A) BMDMs were isolated from Notch1M-KO and Notch1FL/FL mice and stimulated with LPS (100 ng/mL)/IFN-γ (10 ng/mL) for 12 hours. Western blot analysis of NICD and Arg1 expression in BMDMs. (B-D) BMDMs were transfected with pEF-Flag-NICD plasmid or control vector. After 48 hours, cells were supplemented with LPS (100 ng/mL)/IFN-γ (10 ng/mL) for an additional 12 hours. (B) Western blot analysis of NICD and Arg1 expression in indicated BMDMs. (C) Quantitative reverse-transcriptase polymerase chain reaction–assisted detection of Hes1, Yap, Ctgf, and Cyr61 in indicated BMDMs. (D) Western blot analysis of Hes1 and YAP in indicated BMDMs. (E) Quantitative reverse-transcriptase polymerase chain reaction–assisted detection of Hes1, Yap, Ctgf, and Cyr61 in BMDMs from Notch1M-KO and Notch1FL/FL mice. (F) Western blot analysis of Hes1 and YAP expression in BMDMs from Notch1M-KO and Notch1FL/FL mice. (G) BMDMs were cotransfected with YAP-luciferase and pEF-Flag-NICD vectors, and the luciferase activity was measured after 48 hours. Data are presented as the mean ± standard deviation. ∗P < .05, ∗∗P < .01.
Figure 8
Figure 8
YAP activation upregulates JAG1 in macrophages and contributes to Notch1-mediated macrophage polarization in vitro. (A, B) BMDMs were transfected with YAP-siRNA or NS-siRNA and stimulated with LPS (100 ng/mL)/IFN-γ (10 ng/mL) for 12 hours. (A) Quantitative reverse-transcriptase polymerase chain reaction–assisted detection of Ctgf, JAG1, Notch1, and Hes1. (B) Western blot analysis of YAP and JAG1 expression. (C) The expression of YAP and JAG1 in BMDMs transfected with pCMV-Flag-YAP plasmid or control vector, as measured by Western blot analysis. (D) BMDMs were cotransfected with JAG1-luciferase and pCMV-Flag-YAP vectors, and the luciferase activity was measured after 48 hours. (E, F) Notch1M-KO BMDMs were transfected with pCMV-Flag-YAP plasmid or control vector followed by LPS/IFN-γ stimulation. (E) Western blot analysis of Arg1 and iNOS expression in BMDMs. (F) Representative immunofluorescence staining of iNOS in BMDMs. Scale bars, 200 μm. Data are presented as the mean ± standard deviation. ∗P < .05, ∗∗P < .01.
Figure 9
Figure 9
Inhibition of YAP in macrophages attenuates LPS/D-GalN-induced liver injury. Notch1FL/FL mice were injected by the tail vein with YAP-siRNA or NS control siRNA mixed with mannose-conjugated polymers at 6 hours before LPS/D-GalN treatment (n = 5 mice/group). (A) Representative H&E staining of liver sections. (B) Serum ALT and AST levels (U/L). (C, D) Immunohistochemical staining and quantification of Ly6G+ neutrophils and F4/80+ macrophages in liver sections. Scale bars, 40 μm. (E) Representative TUNEL-staining images and quantification of TUNEL+ cells in liver sections. Scale bars, 20 μm. (F) Quantitative reverse-transcriptase polymerase chain reaction–assisted detection of proinflammatory cytokines (Tnf-α, Il-6, and Il-1β), chemokines (Mcp-1 and Cxcl-1), and anti-inflammatory cytokines (Il-10 and Tgf-β) in liver tissues. Data are presented as the mean ± standard deviation. ∗P < .05, ∗∗P < .01.
Figure 10
Figure 10
Dual inhibition of Notch1-YAP circuit attenuates LPS/D-GalN-induced liver inflammation and damage. Notch1M-KO mice were injected by the tail vein with YAP-siRNA or NS control siRNA mixed with mannose-conjugated polymers at 6 hours before LPS/D-GalN treatment. (A) Representative H&E staining of liver tissue. (B) The hepatocellular function was evaluated by serum ALT and AST levels (U/L). (C, D) Immunohistochemical staining and quantification of Ly6G+ neutrophils and F4/80+ macrophages in liver sections (n = 5 mice/group). Scale bars, 40 μm. (E) Quantitative reverse-transcriptase polymerase chain reaction–assisted detection of proinflammatory cytokines (Tnf-α, Il-6, and Il-1β), chemokines (Mcp-1 and Cxcl-1), and anti-inflammatory cytokines (Il-10 and Tgf-β) in liver tissues (n = 5 samples/group). (F) Representative TUNEL-staining images and quantification of TUNEL+ cells in liver sections (n = 5 mice/group). Scale bars, 20 μm. (G) Flow cytometry analysis of liver macrophages isolated from Notch1M-KO mice with YAP-siRNA or NS-siRNA treatment (n = 5 mice/group). Data are presented as the mean ± standard deviation. ∗P < .05, ∗∗P < .01.

Similar articles

Cited by

References

    1. Bernal W., Lee W.M., Wendon J., et al. Acute liver failure: a curable disease by 2024? J Hepatol. 2015;62(Suppl 1):S112–S120. - PubMed
    1. Possamai L.A., Thursz M.R., Wendon J.A., et al. Modulation of monocyte/macrophage function: a therapeutic strategy in the treatment of acute liver failure. J Hepatol. 2014;61:439–445. - PubMed
    1. Bernal W., Auzinger G., Dhawan A., et al. Acute liver failure. Lancet. 2010;376:190–201. - PubMed
    1. Zhou D., Huang C., Lin Z., et al. Macrophage polarization and function with emphasis on the evolving roles of coordinated regulation of cellular signaling pathways. Cell Signal. 2014;26:192–197. - PubMed
    1. Strnad P., Tacke F., Koch A., et al. Liver: guardian, modifier and target of sepsis. Nat Rev Gastroenterol Hepatol. 2017;14:55–66. - PubMed

Publication types