. 2023;15(5):1255-1275.
doi: 10.1016/j.jcmgh.2023.01.004. Epub 2023 Jan 25.

Gut Microbiota-Derived Glutamine Attenuates Liver Ischemia/Reperfusion Injury via Macrophage Metabolic Reprogramming

Affiliations

Gut Microbiota-Derived Glutamine Attenuates Liver Ischemia/Reperfusion Injury via Macrophage Metabolic Reprogramming

Tianfei Lu et al. Cell Mol Gastroenterol Hepatol. 2023.

Abstract

Background & aims: Many studies have revealed crucial roles of the gut microbiota and its metabolites in liver disease progression. However, the mechanism underlying their effects on liver ischemia/reperfusion (I/R) injury remain largely unknown. Here, we investigate the function of gut microbiota and its metabolites in liver I/R injury.

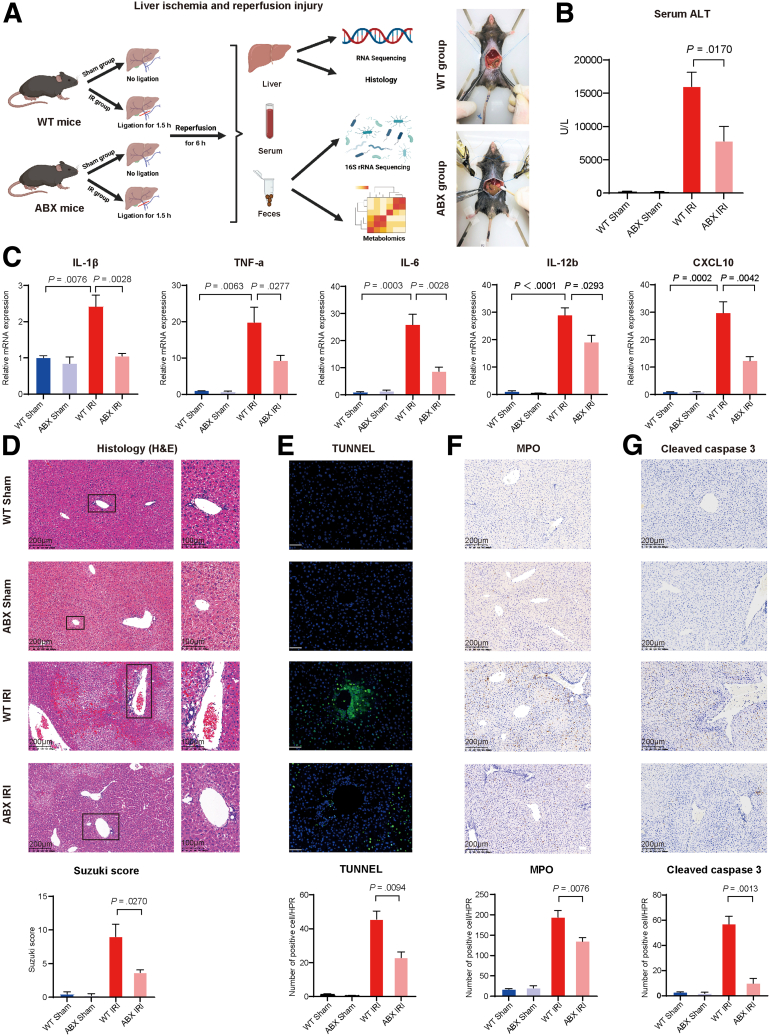
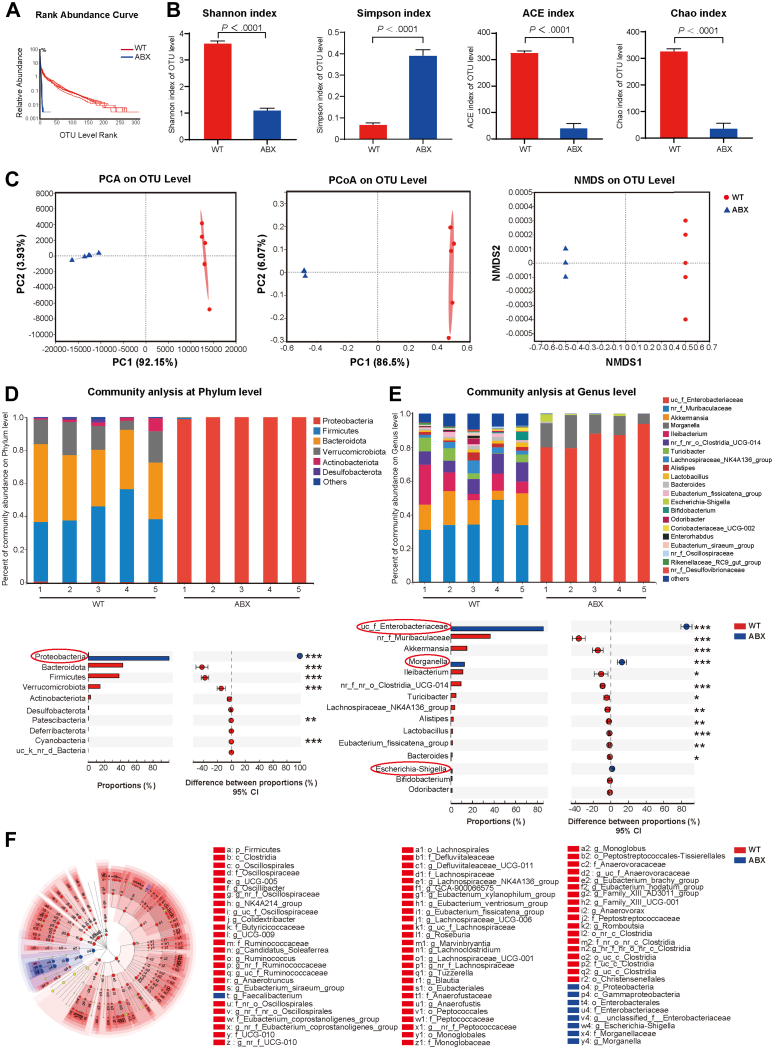
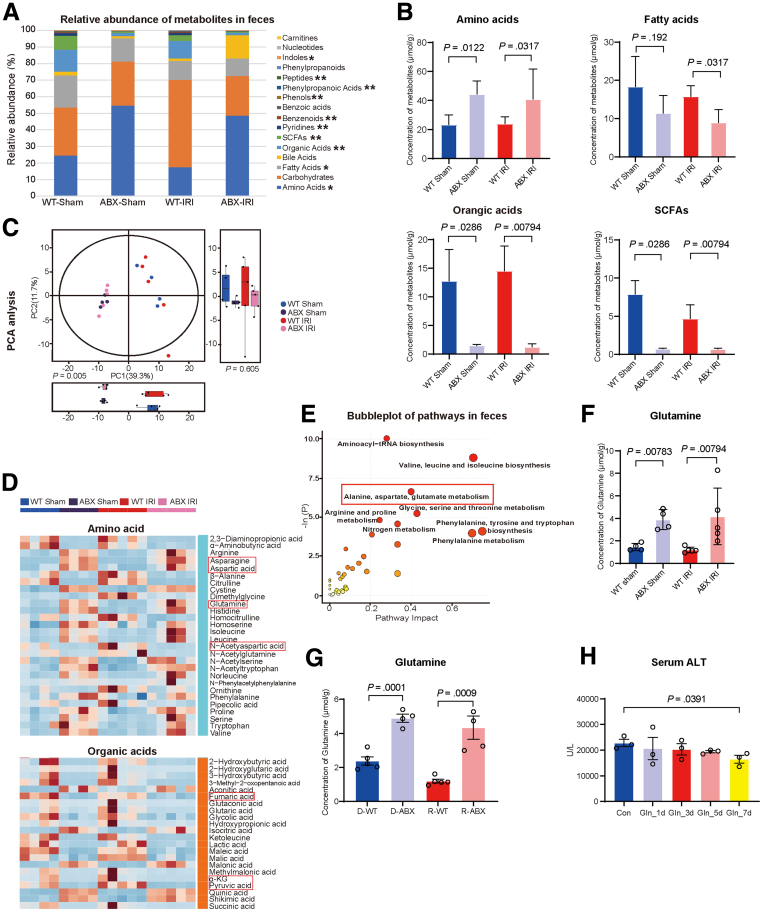
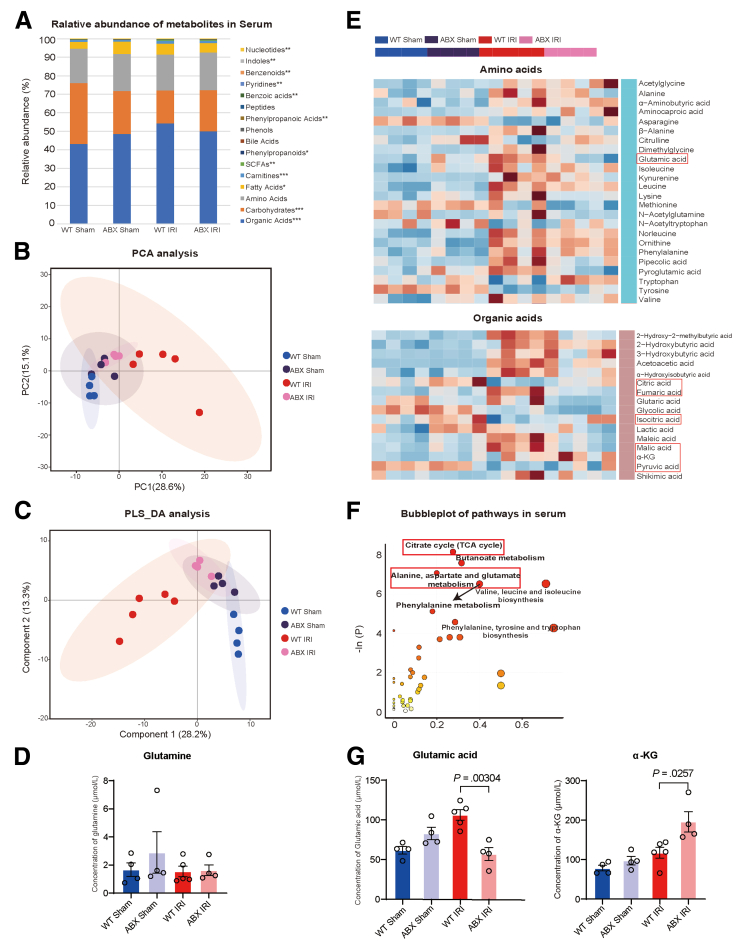
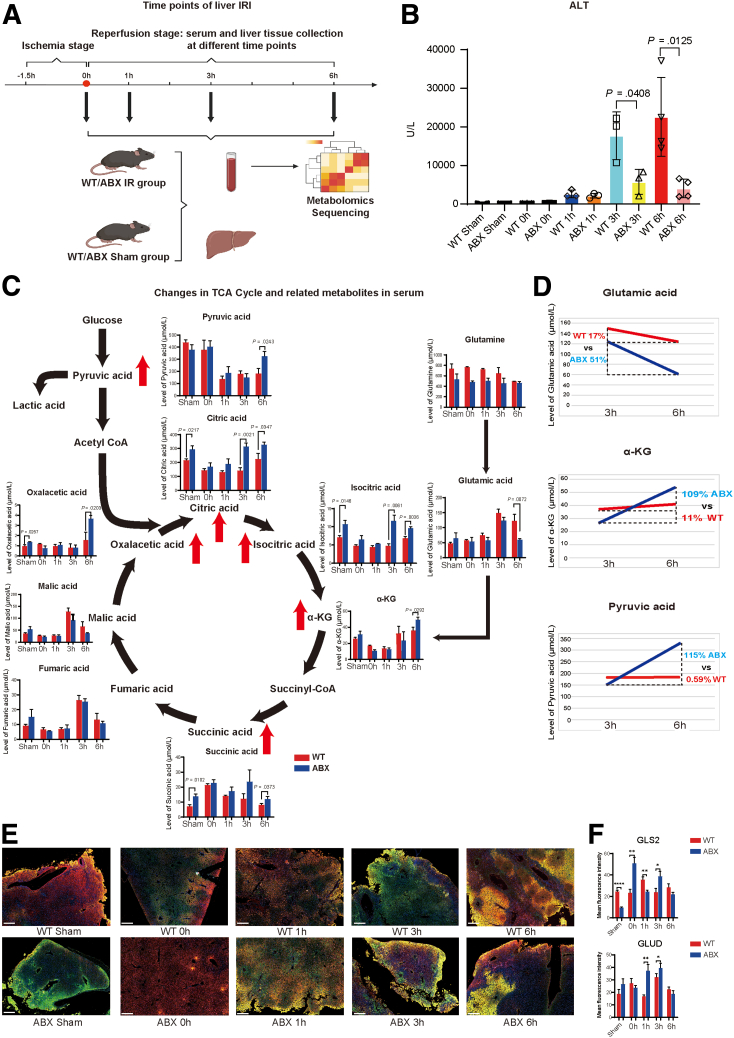
Methods: C57BL/6 mice was pretreated with an antibiotic cocktail. Then, we used multi-omics detection methods including 16s rRNA sequencing, ultra-performance liquid chromatography coupled to tandem mass spectrometry (UPLC-MS/MS) to explore the changes of gut microbiota and metabolites in both feces and portal blood to reveal the mechanism of their protective effect in liver I/R injury.

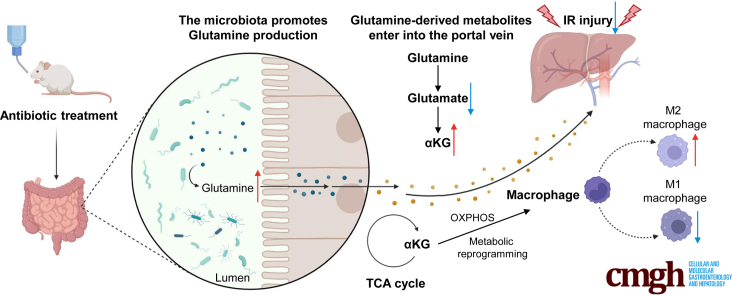
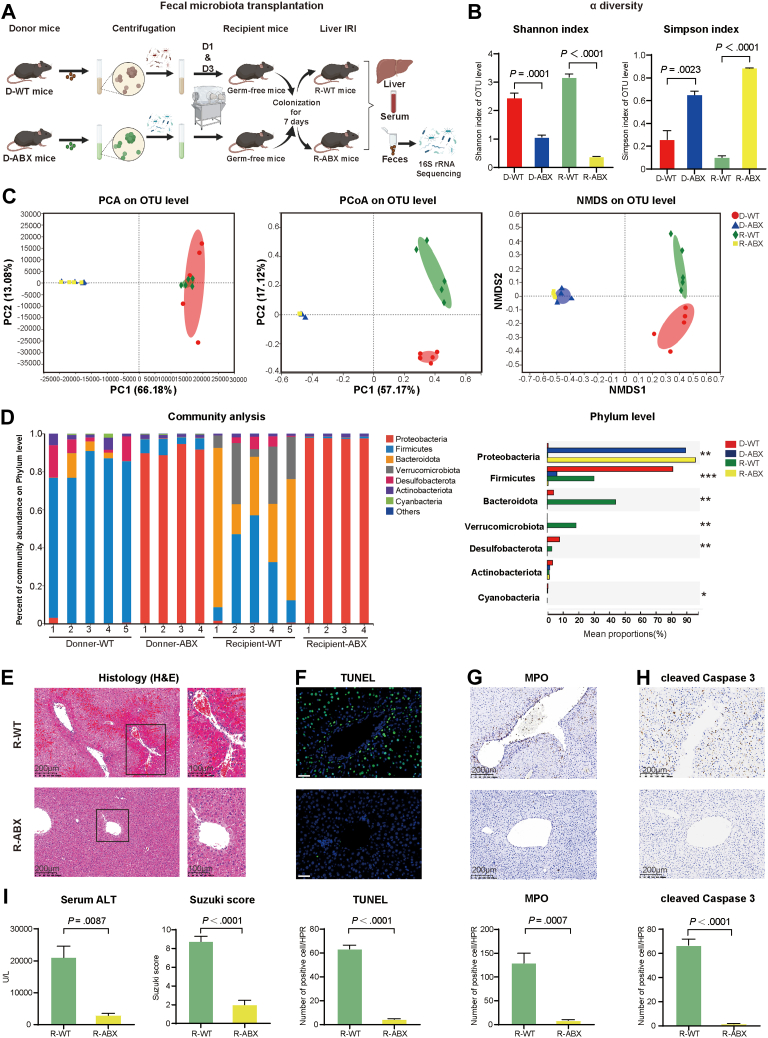
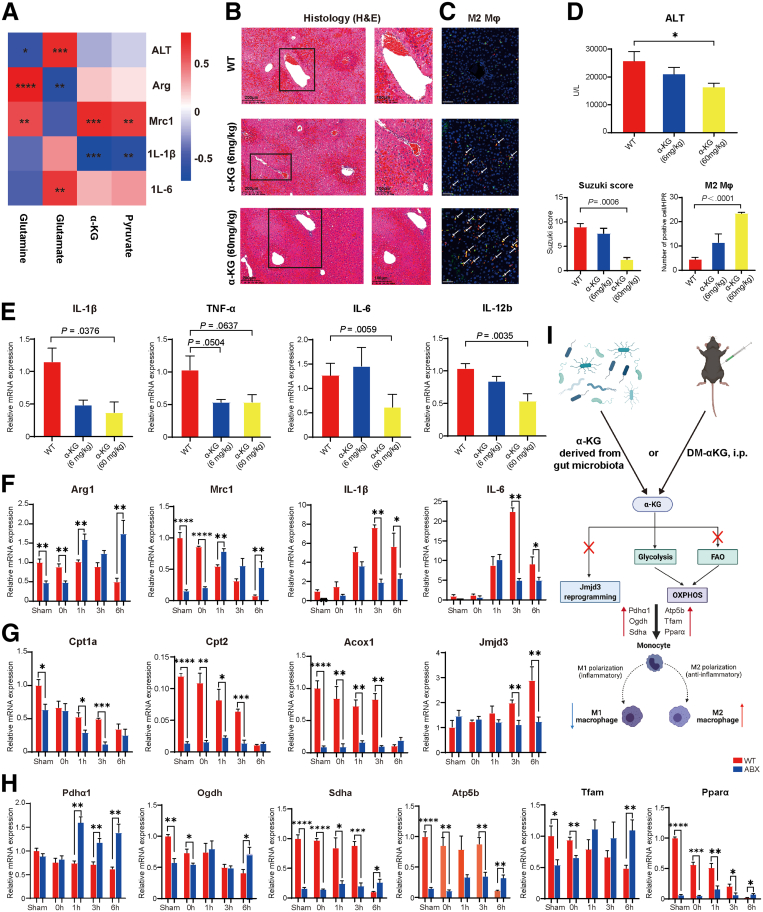
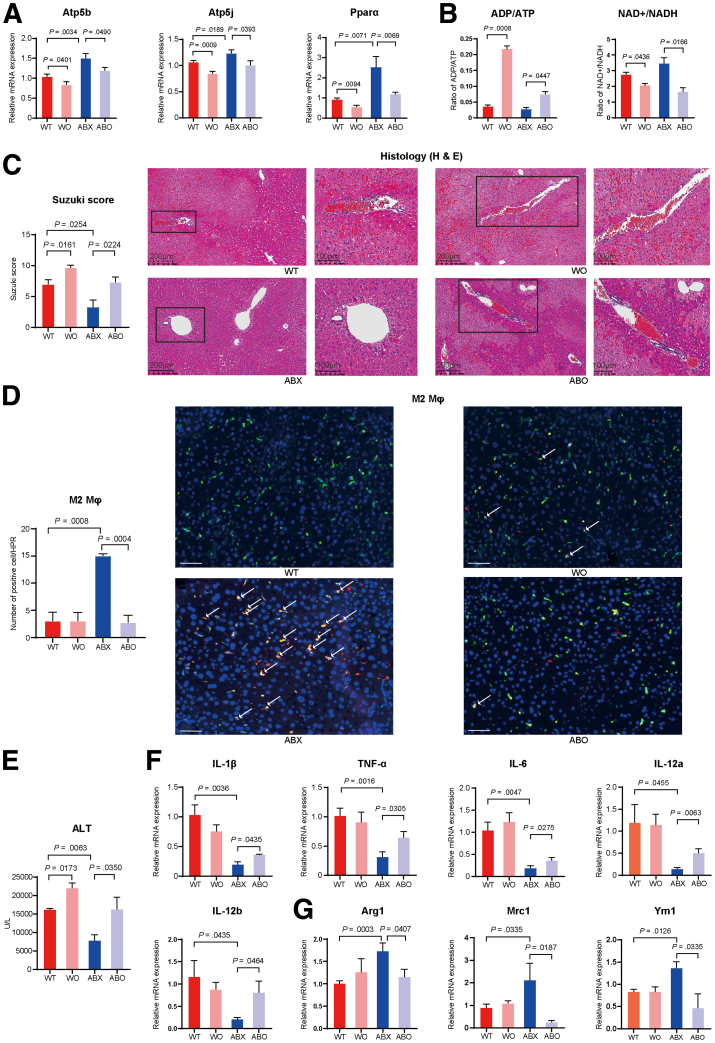
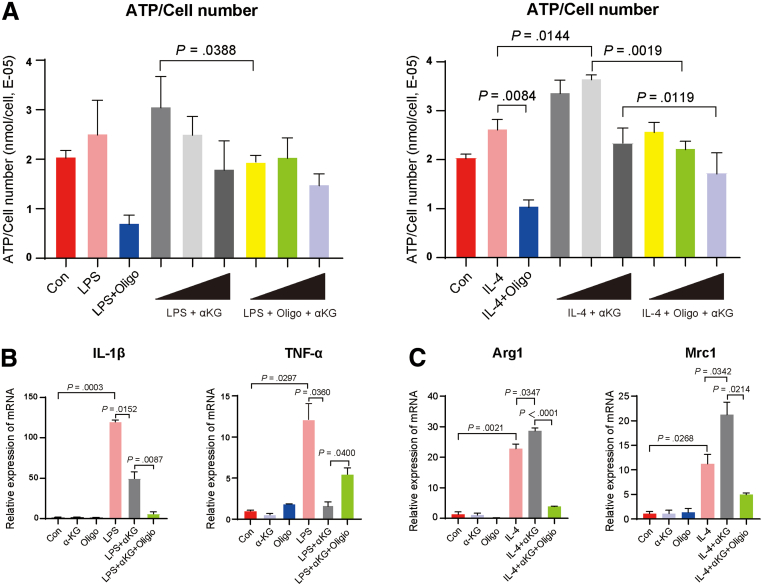
Results: We found that antibiotic pretreatment (ABX) could significantly reduce the severity of I/R-induced hepatic injury, and this effect could be transferred to germ-free mice by fecal microbiota transplantation (FMT), suggesting a protective role of the gut microbiota depletion. During I/R, the rates of serum α-ketoglutarate (αKG) production and glutamate reduction, downstream products of gut microbiota-derived glutamine, were more significant in the ABX mice. Then, we showed that αKG could promote alternative (M2) macrophage activation through oxidative phosphorylation, and oligomycin A could inhibit M2 macrophage polarization and reversed this protective effect.

Conclusions: These findings show that the gut microbiota and its metabolites play critical roles in hepatic I/R injury by modulating macrophage metabolic reprogramming. Potential therapies that target macrophage metabolism, including antibiotic therapies and novel immunometabolism modulators, can be exploited for the treatment of liver I/R injury.

Keywords: Glutamine; Immunometabolism; Liver Ischemia/Reperfusion Injury; Macrophage Reprogramming; Microbiota; a-ketoglutarate.


Figures

None
Graphical abstract
Figure 1
Figure 1
Antibiotic pretreatment could protect the liver from I/R injury. (A) Pattern diagram and intraoperative photos of hepatic I/R injury. WT mice or ABX mice were randomly divided into 2 groups. One group was the sham group (WT Sham, n = 4; ABX Sham, n = 4), and the other group was subjected to liver I/R surgery (WT IRI, n = 10; ABX IRI, n= 10). (B) Serum ALT levels of the 4 groups. (C) Relative mRNA expression of inflammatory cytokines Il1β, Tnfα, Il6, Il12b, and Cxcl10. (D) H&E staining and Suzuki’s quantitative score. (E) TUNEL staining and semiquantitative analysis. Scale bars, 100 μm. (F) Immunochemical staining of MPO and semiquantitative analysis. (G) Immunochemical staining of cleaved caspase 3 and semiquantitative analysis. For all data, statistical comparisons were carried out by Student t test. P < .05 indicates significant differences.
Figure 2
Figure 2
Antibiotic pretreatment could reduce the abundance, diversity, and richness of the gut microbiota and change its composition. (A) Rank abundance curve of WT and ABX mice. (B) α diversity comparison: Shannon index, Simpson index, ACE index, and Chao index of WT and ABX mice. (C) β diversity of clustering analysis: PCA, PCoA, and NMDS analysis of WT and ABX mice at the operational taxonomic unit (OTU) level. (D and E) Comparison of composition of gut microbiota at the phylum level (D) and at the genus level (E) between WT and ABX mice. (F) Linear discriminant analysis (LDA) effect size (LEfSe) analysis with | LDA | ≥2. Fecal samples from WT (n = 5) and ABX (n = 5) mice were analyzed by 16S rRNA sequencing. Statistical comparisons were carried out by Student t test and ANOSIM analysis except LEfSe analysis using the nonparametric Kruskal–Wallis sum-rank test and Wilcoxon rank-sum test. P < .05 indicates significant differences.
Figure 3
Figure 3
Protective effect of antibiotics on hepatic I/R injury could be transferred to GF mice in FMT experiments. (A) Pattern diagram and protocol of FMT experiment. We transferred the fecal microbiota of WT (D-WT, n = 5) and ABX (D-ABX, n = 4) mice to GF mice (R-WT, n = 5; R-ABX, n = 4). One mouse in each of the D-ABX and R-ABX groups died unexpectedly. (B) α diversity comparison: Shannon index and Simpson index of the 4 groups. (C) β diversity of clustering analysis: PCA, PCoA, and NMDS analysis of the 4 groups at the OTU level. (D) Comparison of composition of gut microbiota at phylum level in the 4 groups. (E) H&E staining and Suzuki’s quantitative score of the R-WT and R-ABX groups. (F) TUNEL staining and semiquantitative analysis of R-WT and R-ABX groups. Scale bars, 100 μm. (G and H) Immunochemical staining of MPO (G) and cleaved caspase 3 (H) in the R-WT and R-ABX groups. (I) Serum ALT levels of R-WT and R-ABX groups. For all data, statistical comparisons between 2 groups were carried out by Student t test. For comparisons among 4 groups, the Kruskal–Wallis H test was used. P < .05 indicates significant differences.
Figure 4
Figure 4
Altered gut microbiota could lead to changes in fecal metabolites, especially the concentration of glutamine. (A) Relative abundance of metabolites in the feces of the 4 groups. Samples from WT Sham (n = 4), ABX Sham (n = 4), WT IRI (n = 5), and ABX IRI (n = 5) groups were sequenced for fecal metabolomics. (B) Concentrations of amino acids, fatty acids, organic acids, and short-chain fatty acids (SCFAs) in the feces of the 4 groups. (C) PCA of the 4 groups. (D) Heatmap of comparison of concentrations of fecal amino acids and organic acids in the 4 groups. (E) Bubble chart of cluster analysis of metabolic pathways in feces. (F) Fecal concentration of glutamine in the 4 groups. (G) Fecal concentration of glutamine in 4 groups of FMT (D-WT, D-ABX, R-WT, and R-ABX). (H) Serum ALT of Con and glutamine gavage pretreatment groups for different time durations (n = 3). For all data, statistical comparisons between 2 groups were carried out by Student t test. P < .05 indicates significant differences.
Figure 5
Figure 5
Fecal glutamine could increase the serum concentration of αKG. (A) Relative abundance of metabolites in the serum of the 4 groups. Samples from the WT Sham (n = 4), ABX Sham (n = 4), WT IRI (n = 5), and ABX IRI (n = 5) groups were sequenced to assess serum metabolites, but one sample from the ABX IRI group was removed from the analysis because of high heterogeneity. (B and C) PCA (B) and partial least squares-discriminant analysis (PLS_DA) (C) analysis of the 4 groups. (D) Concentrations of serum glutamine in 4 groups. (E) Heatmap of comparison of serum concentrations of amino acids and organic acids in the 4 groups. (F) Bubble chart of cluster analysis of metabolic pathways in blood. (G) Concentration of serum glutamate and αKG in the 4 groups. For all data, statistical comparisons between 2 groups were carried out by Student t test. P < .05 indicates significant differences.
Figure 6
Figure 6
Kinetics of αKG and TCA cycle-related metabolites were altered by antibiotic pretreatment. (A) Pattern diagram and protocol of the kinetics experiments after liver I/R surgery. Liver and blood specimens from the sham and I/R groups were collected at different time points in the reperfusion phase (for each group, n = 3–4). (B) Serum ALT levels of each group. (C) Dynamic changes in the levels of αKG, TCA cycle-related metabolites, and glycolysis-related metabolites. (D) Rate of change in serum glutamate, αKG, and pyruvate levels from 3 to 6 hours in the reperfusion phase. (E) Immunofluorescence colocalization of GLS2 and GLUD in liver tissue sections in different time point after reperfusion (GLS2-Cy3-red fluorescence, GLUD-488 fluorescence). The legend is 200 μm. (F) Quantitative statistical analysis of GLS2 and GLUD expression by using mean fluorescence intensity. For all data, statistical comparisons between 2 groups were carried out by Student t test. P < .05 indicates significant differences.
Figure 7
Figure 7
Serum αKG could lead to macrophage metabolic reprogramming to promote M2 phenotype differentiation via the OXPHOS metabolic pathway. (A) Heatmap of the correlation analysis between the fecal levels of glutamine, serum glutamate, αKG, and pyruvate and the disease indicator ALT as well as the expression of the M1 or M2 gene markers Il1β, Il6, Arg1, and Mrc1. (B) H&E staining and Suzuki’s quantitative score of the WT, αKG (6 mg/kg, n = 5), and αKG (60 mg/kg, n = 5) groups. (C) Immunofluorescence double labeling of M2 macrophages and semiquantitative analysis. Scale bars, 100 μm. (D) Serum ALT levels of the 3 groups. (E) Relative mRNA expression of the M1 marker genes Il1β, Tnfα, Il6, and Il12b in the 3 groups. (F) Relative mRNA expression of the M2 marker genes Arg1 and Mrc1 and the M1 marker genes Il1β and Il6 at different time points. (G) Relative mRNA expression of the FAO metabolic pathway-related genes Cpt1a and Cpt2 and the epigenetic gene Jmjd3. (H) Relative mRNA expression of the OXPHOS metabolic pathway-related genes Pdhα1, Ogdh, Sdhα, Atp5b, Tfam, and Pparα. The polymerase chain reaction data above show the kinetics of macrophage M1/M2 marker expression, n = 3–4 for each group. (I) Mechanistic diagram of how αKG can protect the liver from I/R injury. For all data, statistical comparisons between 2 groups were carried out by Student t test. Correlation comparison was performed by Spearman’s correlation analysis. P < .05 indicates significant differences.
Figure 8
Figure 8
Administration of oligomycin A reversed the protective effect of antibiotic pretreatment on hepatic I/R injury. (A) Relative mRNA expression of Atp5b and Atp5j in the WT, WO, ABX, and ABO groups (n = 5 per group). (B) Changes in the levels of serum nucleic acid metabolomics, including ADP/ATP and NAD+/NADH. (C) H&E staining and Suzuki’s quantitative score. (D) Immunofluorescence double labeling of M2 macrophages and semiquantitative analysis. Scale bars, 100 μm. (E) Serum ALT levels in the 4 groups. (F) Relative mRNA expression of the M1 marker genes Il1β, Tnfα, Il6, Il12a, and Il12b in the 4 groups. (G) Relative mRNA expression of the M2 marker genes Arg1, Mrc1, and Ym1 in the 4 groups. For all data, statistical comparisons between 2 groups were carried out by Student t test. P < .05 indicates significant differences.
Figure 9
Figure 9
Exogenous αKG supplement could promote BMDM M2 activation and inhibit M1 polarization. (A) On the left, the value of ATP production normalized by cell number of M1 macrophage-related group: Con, LPS stimulation group, LPS + oligomycin A group, LPS + dose gradient of αKG (0.1, 1, 10 μmol/L), and LPS + oligomycin A + dose gradient of αKG (0.1, 1, 10 μmol/L) (n = 3). On the right, the value of ATP normalized by cell number of M2 macrophage-related group: Con, IL-4 stimulation, IL-4 + oligomycin A, IL-4 + dose gradient of αKG (0.1, 1, 10 μmol/L), and IL-4 + oligomycin A + dose gradient of αKG (0.1, 1, 10 μmol/L) (n = 3). After 1 μmol/L of αKG was chosen as the optimal concentration to increase ATP production of BMDMs, M1 and M2 markers were used to perform macrophage phenotyping by quantitative polymerase chain reaction. (B) Relative mRNA expression of the M1 marker genes Il1β, Tnfα in LPS induced-M1 macrophage related group. (C) Relative mRNA expression of the M2 marker genes Arg1, Mrc1 in IL-4 induced-M2 macrophage related group. For all data, statistical comparisons between 2 groups were carried out by Student t test. P < .05 indicates significant differences. LPS, lipopolysaccharide.

Similar articles

Cited by

References

    1. Bi J., Zhang J., Ren Y., et al. Irisin alleviates liver ischemia-reperfusion injury by inhibiting excessive mitochondrial fission, promoting mitochondrial biogenesis and decreasing oxidative stress. Redox Biol. 2019;20:296–306. - PMC - PubMed
    1. Zhai Y., Petrowsky H., Hong J.C., et al. Ischaemia-reperfusion injury in liver transplantation: from bench to bedside. Nat Rev Gastroenterol Hepatol. 2013;10:79–89. - PMC - PubMed
    1. Brenner C., Galluzzi L., Kepp O., et al. Decoding cell death signals in liver inflammation. J Hepatol. 2013;59:583–594. - PubMed
    1. Peralta C., Jimenez-Castro M.B., Gracia-Sancho J. Hepatic ischemia and reperfusion injury: effects on the liver sinusoidal milieu. J Hepatol. 2013;59:1094–1106. - PubMed
    1. Ye L., He S., Mao X., et al. Effect of hepatic macrophage polarization and apoptosis on liver ischemia and reperfusion injury during liver transplantation. Front Immunol. 2020;11:1193. - PMC - PubMed

Publication types