

Directing Min protein patterns with advective bulk flow
- PMID: 36707506
- PMCID: PMC9883515
- DOI: 10.1038/s41467-023-35997-0
Directing Min protein patterns with advective bulk flow
Abstract
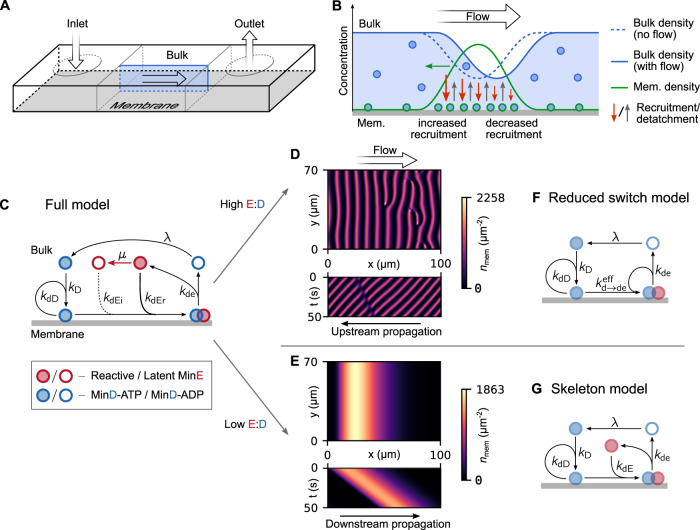
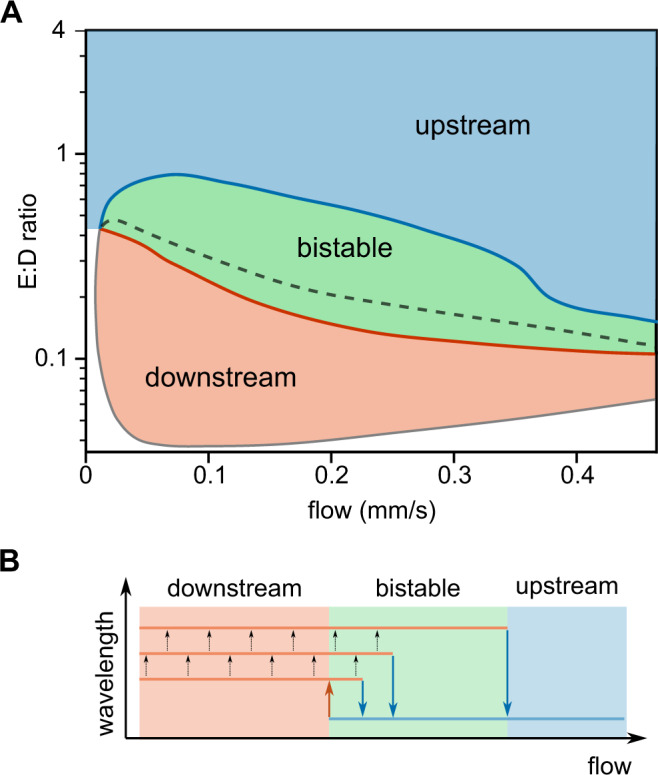
The Min proteins constitute the best-studied model system for pattern formation in cell biology. We theoretically predict and experimentally show that the propagation direction of in vitro Min protein patterns can be controlled by a hydrodynamic flow of the bulk solution. We find downstream propagation of Min wave patterns for low MinE:MinD concentration ratios, upstream propagation for large ratios, but multistability of both propagation directions in between. Whereas downstream propagation can be described by a minimal model that disregards MinE conformational switching, upstream propagation can be reproduced by a reduced switch model, where increased MinD bulk concentrations on the upstream side promote protein attachment. Our study demonstrates that a differential flow, where bulk flow advects protein concentrations in the bulk, but not on the surface, can control surface-pattern propagation. This suggests that flow can be used to probe molecular features and to constrain mathematical models for pattern-forming systems.
© 2023. The Author(s).
Conflict of interest statement
The authors declare no competing interests.
Figures


Similar articles
-
MinE conformational switching confers robustness on self-organized Min protein patterns.Proc Natl Acad Sci U S A. 2018 May 1;115(18):4553-4558. doi: 10.1073/pnas.1719801115. Epub 2018 Apr 16. Proc Natl Acad Sci U S A. 2018. PMID: 29666276 Free PMC article.
-
Min protein patterns emerge from rapid rebinding and membrane interaction of MinE.Nat Struct Mol Biol. 2011 May;18(5):577-83. doi: 10.1038/nsmb.2037. Epub 2011 Apr 24. Nat Struct Mol Biol. 2011. PMID: 21516096
-
Design of biochemical pattern forming systems from minimal motifs.Elife. 2019 Nov 26;8:e48646. doi: 10.7554/eLife.48646. Elife. 2019. PMID: 31767054 Free PMC article.
-
The E. coli MinCDE system in the regulation of protein patterns and gradients.Cell Mol Life Sci. 2019 Nov;76(21):4245-4273. doi: 10.1007/s00018-019-03218-x. Epub 2019 Jul 17. Cell Mol Life Sci. 2019. PMID: 31317204 Free PMC article. Review.
-
The Min-protein oscillations in Escherichia coli: an example of self-organized cellular protein waves.Philos Trans R Soc Lond B Biol Sci. 2018 May 26;373(1747):20170111. doi: 10.1098/rstb.2017.0111. Philos Trans R Soc Lond B Biol Sci. 2018. PMID: 29632263 Free PMC article. Review.
Cited by
-
Measuring flow-mediated protein drift across stationary supported lipid bilayers.Biophys J. 2023 May 2;122(9):1720-1731. doi: 10.1016/j.bpj.2023.03.042. Epub 2023 Apr 5. Biophys J. 2023. PMID: 37020419 Free PMC article.
-
Addendum: Directing Min protein patterns with advective bulk flow.Nat Commun. 2024 Aug 2;15(1):6522. doi: 10.1038/s41467-024-50256-6. Nat Commun. 2024. PMID: 39095392 Free PMC article. No abstract available.
-
Forceful patterning: theoretical principles of mechanochemical pattern formation.EMBO Rep. 2023 Dec 6;24(12):e57739. doi: 10.15252/embr.202357739. Epub 2023 Nov 2. EMBO Rep. 2023. PMID: 37916772 Free PMC article. Review.
-
Cell-free expression with a quartz crystal microbalance enables rapid, dynamic, and label-free characterization of membrane-interacting proteins.Commun Biol. 2024 Aug 17;7(1):1005. doi: 10.1038/s42003-024-06690-9. Commun Biol. 2024. PMID: 39152195 Free PMC article.
References
Publication types
MeSH terms
Substances
LinkOut - more resources
Full Text Sources
