. 2023 Jan 27;14(1):441.
doi: 10.1038/s41467-023-36124-9.

Cellular senescence in malignant cells promotes tumor progression in mouse and patient Glioblastoma

Affiliations

Cellular senescence in malignant cells promotes tumor progression in mouse and patient Glioblastoma

Rana Salam et al. Nat Commun. .

Abstract

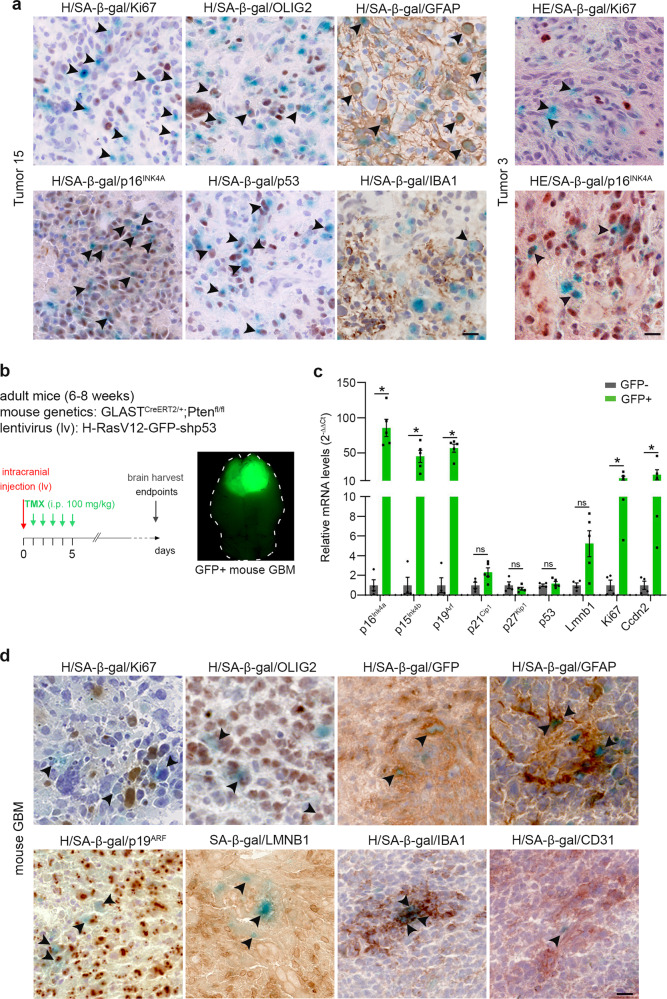
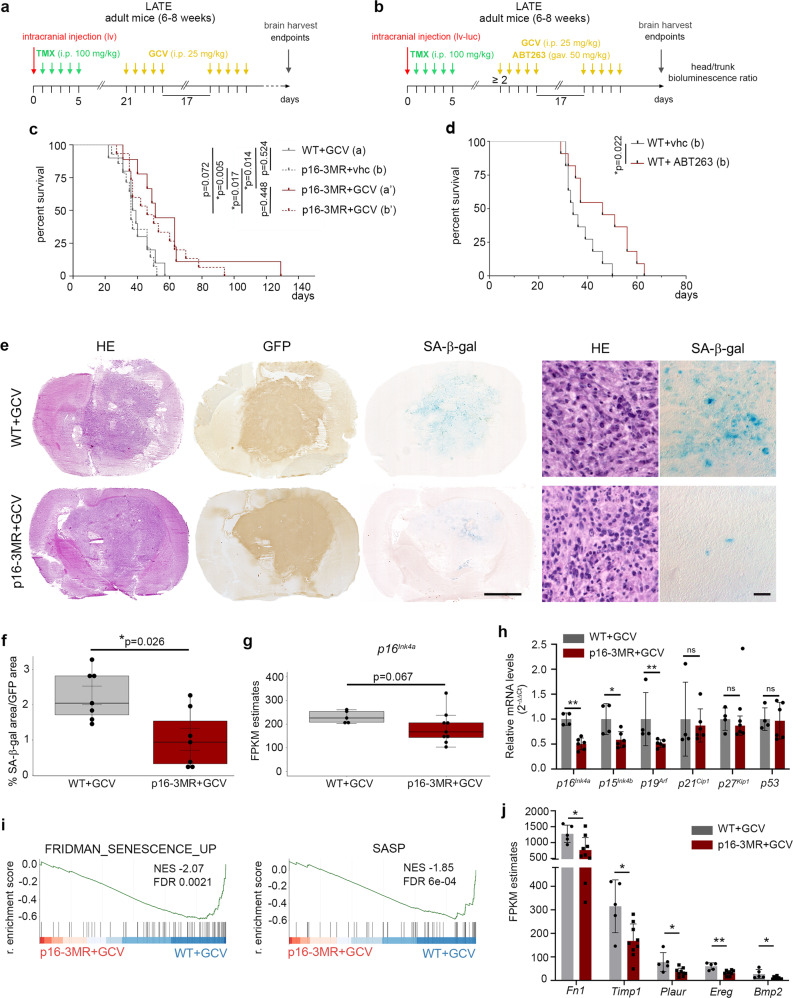
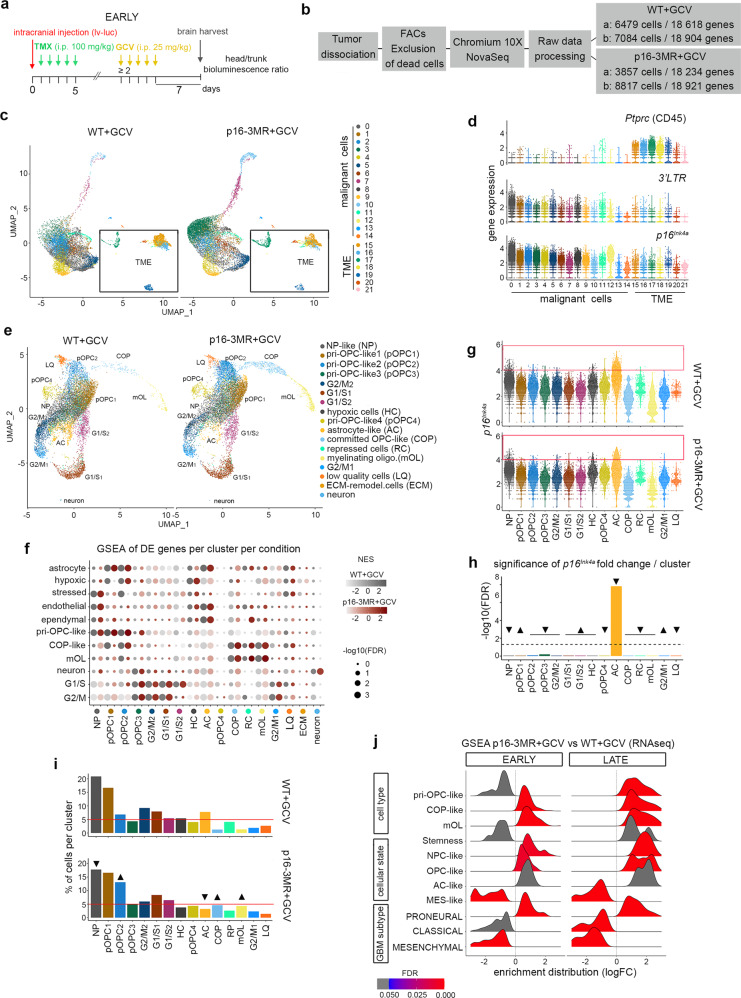
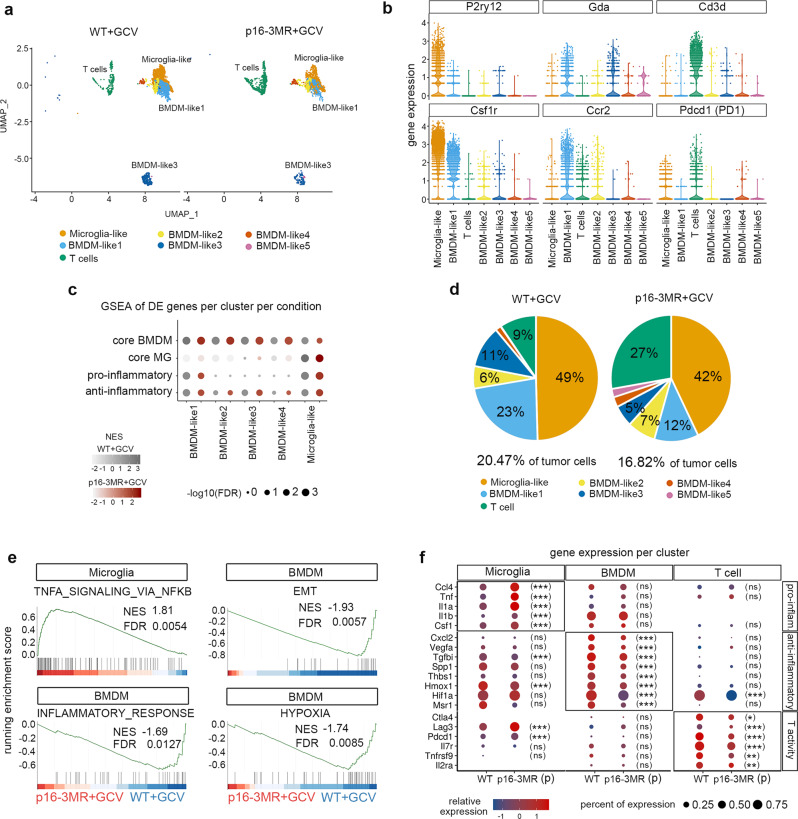
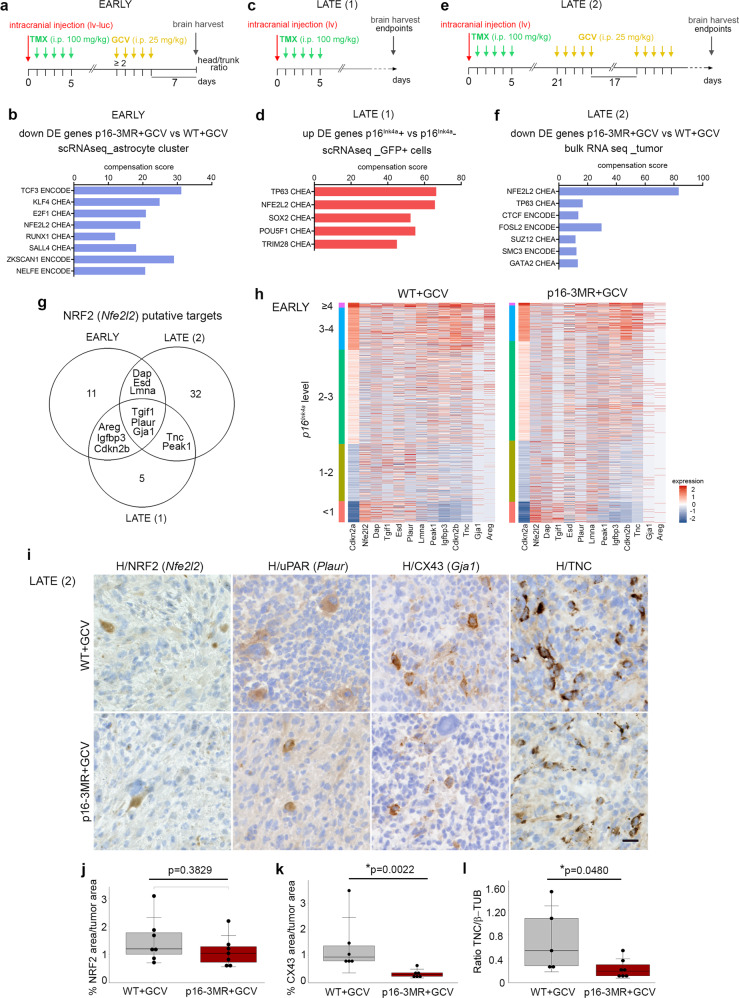
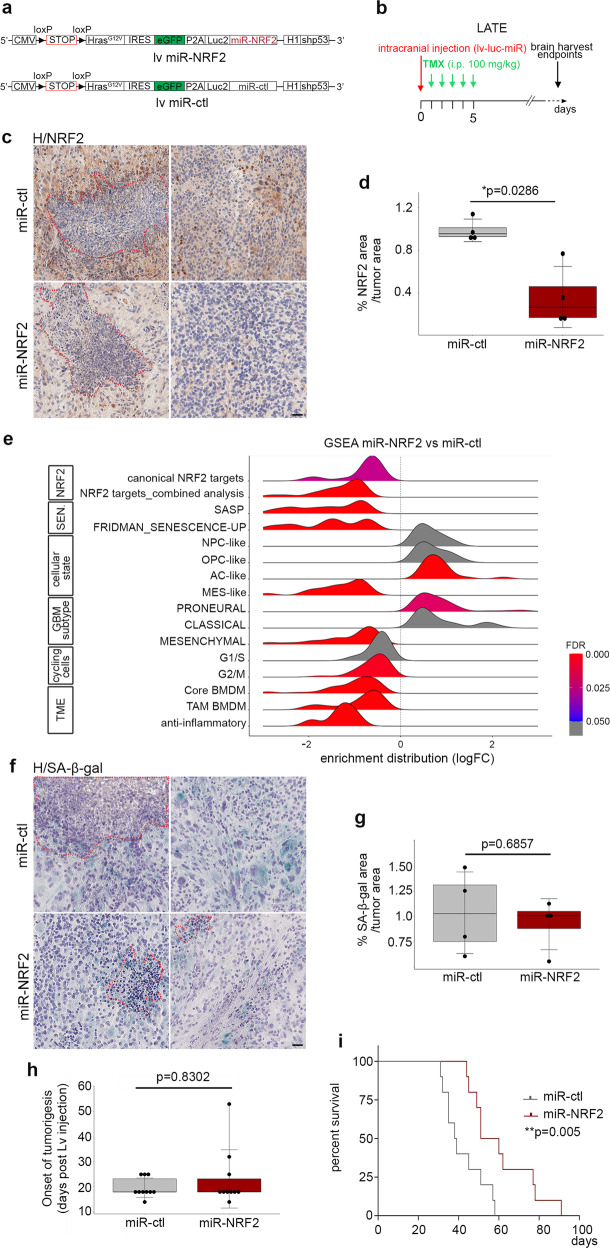
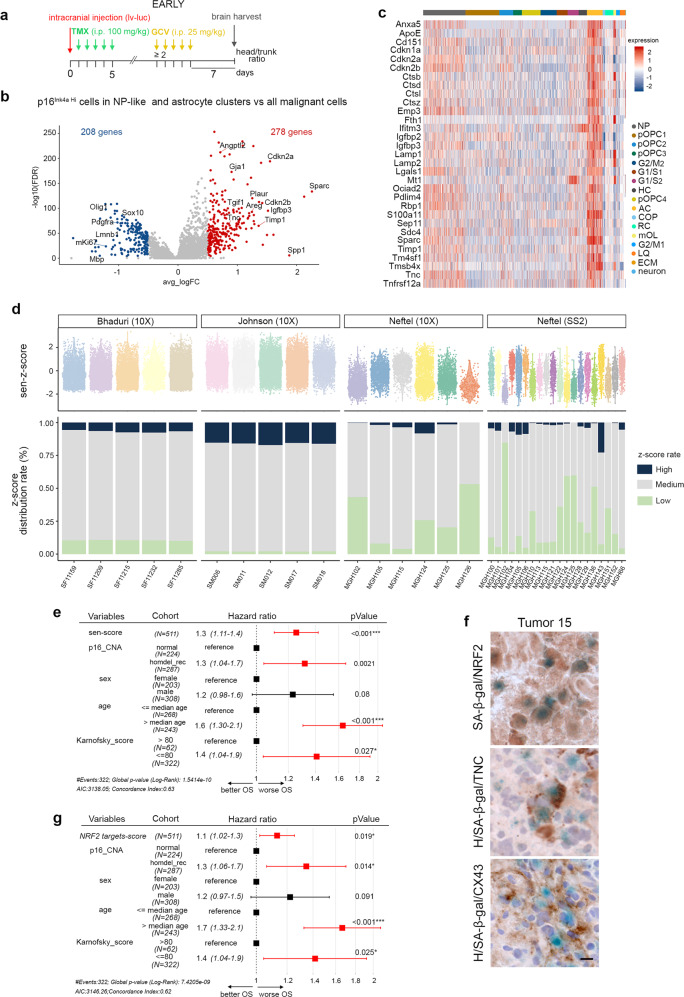
Glioblastoma (GBM) is the most common primary malignant brain tumor in adults, yet it remains refractory to systemic therapy. Elimination of senescent cells has emerged as a promising new treatment approach against cancer. Here, we investigated the contribution of senescent cells to GBM progression. Senescent cells are identified in patient and mouse GBMs. Partial removal of p16Ink4a-expressing malignant senescent cells, which make up less than 7 % of the tumor, modifies the tumor ecosystem and improves the survival of GBM-bearing female mice. By combining single cell and bulk RNA sequencing, immunohistochemistry and genetic knockdowns, we identify the NRF2 transcription factor as a determinant of the senescent phenotype. Remarkably, our mouse senescent transcriptional signature and underlying mechanisms of senescence are conserved in patient GBMs, in whom higher senescence scores correlate with shorter survival times. These findings suggest that senolytic drug therapy may be a beneficial adjuvant therapy for patients with GBM.


Conflict of interest statement

F.B. reports employment of next-of-kin from Bristol-Myers Squibb; research grants from Sanofi and Abbvie outside the submitted work; travel, and accommodations expenses from Bristol-Myers Squibb for travel expenses, outside the submitted work. The remaining authors declare no competing interests.

Figures

Fig. 1
Fig. 1. Identification of senescent cells in patient and mouse gliomas.
a Representative SA-β-gal staining (blue) coupled with immunohistochemistry (IHC, brown) on two non-fixed patients GBM cryosections samples (Ki67 and GFAP: n = 16; p16INK4A: n = 12; IBA1: n = 10; p53: n = 7 and OLIG2: n = 6 patient GBMs). b Left: genetics of the mouse mesenchymal GBM model (mouse and injected lentivirus (lv)). The timeline represents the induction of tumorigenesis with tamoxifen intraperitoneal (i.p.) injections (TMX, 100 mg/kg/day for 5 days). Brains are harvested when mice reach endpoints. Right: the representative stereomicroscopic image of a mouse brain with a GFP+ GBM. c Relative transcript levels shown as ratios of normalized values of mouse GBM (GFP+, n = 5) over surrounding parenchyma (GFP−, n = 4). Data are represented as the mean ± SEM. Statistical significance was determined by the Wilcoxon–Mann–Whitney test (*p < 0.05; ns, not significant). d Representative SA-β-gal staining (blue) coupled with IHC (brown) on mouse GBM cryosections. (Ki67, p19, IBA1 and GFP: n = 8; GFAP: n = 6; OLIG2 and CD31: n = 5; LMNB1: n = 4 independent mouse GBMs). Arrowheads in a, d point to SA-β-gal+ cells co-labeled for the markers OLIG2, GFP, GFAP, p19ARF, or IBA1. For Ki67, LMNB1, and CD31 IHC, the arrowheads point to mono-labeled SA-β-gal+ cells. Scale bars, a and d: 20 µm. H hematoxylin, HE hematoxylin, and eosin, i.p. intraperitoneal, TMX tamoxifen. Raw data are provided as a Source Data file.
Fig. 2
Fig. 2. Senescent cell’s partial removal increases the survival of GBM-bearing mice.
a Timeline of tumorigenesis induction (lv: H-RasV12-GFP-shp53) and removal of senescent cells with GCV, 21 days post lv injection in the p16-3MR transgenic mouse. b Timeline of tumorigenesis induction (lv-luc: H-RasV12-GFP-P2A-Luc2-shp53) and removal of senescent cells with GCV in the p16-3MR mouse or with ABT263 in WT mouse when head to body bioluminescence ratio reached 2. c Kaplan–Meier survival curves (solid lines) of WT (n = 10, median survival 38 days) and p16-3MR (n = 9, median survival 51 days) mice treated with GCV as shown in (a). Kaplan–Meier survival curves (dotted lines) of p16-3MR mice treated with vhc (n = 14, median survival 36 days) or GCV (n = 15, median survival 46 days) as shown in (b). d Kaplan–Meier survival curves of WT mice treated with vhc (n = 11, median survival 34 days) or ABT263 (n = 11, median survival 46 days) as shown in (b). e Representative HE, GFP IHC, and SA-β-Gal staining on adjacent mouse GBM cryosections. Right panels represent higher magnifications of the left panels. Scale bars, left panels: 2.5 mm, right panels: 20 µm. f Quantification of the SA-β-gal area over the tumor (GFP+) area (n = 7 biologically independent animals/group). g Relative transcript levels of p16Ink4a, shown as FPKM estimates extracted from bulk RNAseq analysis (WT+GCV, n = 5; p16-3MR+GCV, n = 9). h Relative transcript levels are shown as ratios of normalized values of p16-3MR+GCV GBMs (n = 6) over WT+GCV GBMs (n = 4). i GSEA graphs from bulk RNAseq data in p16-3MR+GCV GBMs compared with WT+GCV GBMs. SASP gene list from Gorgoulis et al. (Supplementary Data 1). j Relative transcript levels of genes in WT+GCV and p16-3MR+GCV GBMs extracted from bulk RNAseq data (WT+GCV, n = 5; p16-3MR+GCV, n = 9). c and d Statistical significance was determined by Mantel–Cox log-rank test. b Raw p-values from the log-rank tests are included in the figure and significance is indicated by * for p-values below the 5% level after correction by the Benjamini–Hochberg procedure. fh, j Data are represented as the mean ± SD and statistical significance was determined by the Wilcoxon–Mann–Whitney test (*p < 0.05; **p < 0.01, ns, not significant). TMX tamoxifen, vhc vehicle, gav. gavage, GCV ganciclovir, i.p. intraperitoneal, lv lentivirus, lv-luc lentivirus-luciferase, GSEA gene set enrichment analysis, FDR false discovery rate, NES normalized enrichment score, r. enrichment score running enrichment score. Raw data are provided as a Source Data file.
Fig. 3
Fig. 3. Identification of p16Ink4a Hi cells in a subset of malignant cells.
a Timeline of the mouse GBM generation for scRNAseq at the early timepoint. b Scheme of the scRNAseq experiment. c UMAP plots of WT+GCV (n = 2) and p16-3MR+GCV (n = 2) GBM cells at a 0.5 resolution and annotated malignant cells and TME cells. d Violin plots of the expression of CD45, 3’LTR, and p16Ink4a in WT+GCV GBM cells per cluster. e UMAP plots of WT+GCV (n = 2) and p16-3MR+GCV (n = 2) GBM malignant cells and annotated cell type at a 0.6 resolution. f GSEA dot plots of DE genes (FDR < 0.05; avlogFC>0.25) in WT+GCV (gray dots) and p16-3MR+GCV (red dots) GBMs of gene lists from Weng et al. (Supplementary Data 1). g Violin plots of the expression of p16Ink4a in malignant cells per cluster. The red box indicates the cells with an expression of p16Ink4a ≥ 4 (p16Ink4a Hi cells). h Bar plots representing the significance of p16Ink4a fold change per cluster in p16-3MR+GCV GBMs compared with WT+GCV GBMs. The arrowheads point to a decrease (arrowheads down) or increase (arrowheads up) in the fold change. i Bar plots representing the percentage of malignant cells per cluster in WT+GCV and p16-3MR+GCV GBMs. The arrowheads point to clusters whose cell number varies between the two conditions. j GSEA ridge plot of gene lists from Weng et al., Neftel et al., and Wang et al. (Supplementary Data 1) between p16-3MR+GCV and WT+GCV GBMs at the early and late time points. Analysis performed from bulk RNAseq data. TMX tamoxifen; GCV ganciclovir; vhc vehicle; i.p. intraperitoneal; lv-luc lentivirus-luciferase; TME tumor microenvironment, UMAP uniform manifold approximation and projection, LTR long terminal repeat, DE differentially expressed, GSEA gene set enrichment analysis, FDR false discovery rate, NES normalized enrichment score, r. enrichment score running enrichment score. Raw data are provided as a Source Data file.
Fig. 4
Fig. 4. Modulation of the immune compartment following p16Ink4a Hi cells partial removal.
a UMAP plots of CD45+ cells in WT+GCV and p16-3MR+GCV GBMs at a 0.5 resolution and annotated cell type. b Violin plots representing the expression of selected DE genes (FDR < 0.05; avlogFC > 0.25) per cluster in WT+GCV GBMs. c GSEA dot plot of DE genes (FDR < 0.05; avlogFC>0.25) in WT+GCV (gray dots) and p16-3MR+GCV (red dots) CD45+ clusters of core-BMDM, core-MG, pro-inflammatory and anti-inflammatory pathways as defined in Bowman et al. and Darmanis et al. (Supplementary Data 1). d Chart pies representing the percentage of CD45+ cells per cluster in WT+GCV and p16-3MR+GCV GBMs. e GSEA graphs representing the enrichment score of Hallmark gene lists in p16-3MR+GCV compared with WT+GCV microglia clusters and pooled BMDM clusters. The barcode plot indicates the position of the genes in each gene set; red represents positive Pearson’s correlation with p16-3MR+GCV expression and blue with WT+GCV expression. f Dot plots of the relative expression of selected genes in WT+GCV and p16-3MR+GCV microglia, pooled BMDM and T cells clusters. Statistical significance of the expression of genes in p16-3MR+GCV compared with WT+GCV clusters was determined by the Wilcoxon–Mann–Whitney test (ns, not significant, *p < 0.05; **p < 0.01; ***p < 0.001). UMAP uniform manifold approximation and projection, BMDM bone marrow-derived macrophages, MG microglia, DE differentially expressed, EMT epithelial to mesenchymal transition, GSEA gene set enrichment analysis, FDR false discovery rate, NES normalized enrichment score. Raw data are provided as a Source Data file.
Fig. 5
Fig. 5. Identification of NRF2 activity and its putative targets in p16Ink4a Hi malignant cells.
a Timeline of the mouse GBM generation for scRNAseq at the early timepoint (EARLY). b Barplot corresponding to significantly enriched pathways (ENCODE and ChEA consensus TFs from ChIP-X, Enrichr) in differentially downregulated genes (FDR < 0.05; avlogFC>0.25) in the p16-3MR+GCV compared with the WT+GCV astrocyte clusters from the scRNAseq data (as shown in a). c Timeline of the mouse GBM generation for scRNAseq at the late timepoint (LATE (1)). d Barplot corresponding to significantly enriched pathways in differentially up-regulated genes (FDR < 0.05; logFC > 0.5) in p16Ink4a positive vs. p16Ink4a negative malignant cells from the scRNAseq data (as shown in c). e Timeline of the mouse GBM generation for bulk RNAseq at the late timepoint (LATE (2)). f Barplot corresponding to significantly enriched pathways in differentially down-regulated genes (FDR < 0.05; logFC > 0.5) in p16-3MR+GCV compared with WT+GCV GBMs from the bulk RNAseq data (as shown in e). g Venn diagram of NRF2 putative targets between the 3 gene sets as shown in (a, c, and e). h Heatmaps of Nrf2 and its 11 identified putative targets in WT+GCV and p16-3MR GBMs. Cells are classified into five categories according to p16Ink4a expression levels. i Representative immunohistochemistry (IHC, brown) counterstained with hematoxylin (H, purple) on mouse GBM cryosections at the late timepoint. H hematoxylin. (NRF2: WT+GCV, n = 7; p16-3MR+GCV n = 7; uPAR: WT+GCV, n = 3; p16-3MR+GCV, n = 3; CX43: WT+GCV, n = 5; p16-3MR+GCV, n = 6; TNC: WT+GCV, n = 5; p16-3MR+GCV, n = 7 independent mouse GBMs). Scale bar: 20 µm. j Quantification of the NRF2 area (IHC) over the tumor area (WT+GCV, n = 7; p16-3MR+GCV, n = 7 independent mouse GBMs). k Quantification of the CX43 area (IHC) over the tumor area (WT+GCV, n = 6; p16-3MR+GCV, n = 6 independent mouse GBMs). l Quantification of the ratio of TNC over β-TUBULIN expression (western blot) (WT+GCV, n = 5; p16-3MR+GCV, n = 7 independent mouse GBMs). Raw data are shown in Supplementary Fig. 5g. jl data are presented as the mean ± SD. Statistical significance was determined by the Wilcoxon–Mann–Whitney test (*p < 0.05). i.p. intraperitoneal, lv lentivirus, lv-luc lentivirus-luciferase, TMX tamoxifen, DE differentially expressed GCV ganciclovir, H hematoxylin. Raw data are provided as a Source Data file.
Fig. 6
Fig. 6. Knockdown of NRF2 in malignant cells recapitulates most features of the senolytic treatment.
a Scheme of the lentiviral vector containing either a miR-NRF2 or a miR-ctl. b Timeline of the mouse GBM generation at the late timepoint. c Representative NRF2 IHC staining (brown) on miR-ctl (n = 4) and miR-NRF2 (n = 4) GBM cryosections. Necrotic areas are outlined in red dashed lines. d Quantification of the NRF2 area (IHC) over the tumor area (miR-ctl n = 4; miR-NRF2 n = 4). e GSEA ridge plot on bulk RNAseq of miR-NRF2-GBMs compared with miR-ctl-GBMs (see Supplementary Data 1 for gene lists). f Representative SA-β-gal (blue) staining on miR-ctl (n = 4) and miR-NRF2 (n = 4) GBM cryosections. Necrotic areas are outlined in red dashed lines. g Quantification of the SA-β-gal area over the tumor area (miR-ctl n = 4; miR-NRF2 n = 4). h Boxplot representing the onset of tumorigenesis in miR-ctl (n = 10) and miR-NRF2 (n = 10) mice following post-lentiviral injection. The onset of tumorigenesis is defined when the bioluminescence reached 3e106. i Kaplan–Meier survival curves of miR-ctl (n = 10, median survival 38.5 days) and miR-NRF2 mice (n = 10, median survival 55.5 days). Statistical significance was determined by the Mantel–Cox log-rank test (**p < 0.01). Scale bar, c and f 50 µm. d, g, h Statistical significance was determined by Wilcoxon–Mann–Whitney test (*p < 0.05). lv lentivirus, miR-ctl miR-control, H hematoxylin, GSEA gene set enrichment analysis, sen. senescence, TAM-associated macrophages, BMDM bone marrow-derived macrophages. Raw data are provided as a Source Data file.
Fig. 7
Fig. 7. Mouse senescent signature is conserved in patient GBM and its enrichment score is predictive of worse survival.
a Timeline of the mouse GBM generation for scRNAseq at the early timepoint. b Volcano plot of differentially expressed (DE) genes (−0.5 < log2FC > 0.5; FDR < 0.05) between p16Ink4a Hi cells (gene expression ≥ 4) of astrocyte and NP-like clusters compared with the remaining malignant cells in WT+GCV GBMs. c Heatmap of the 31 senescence signature genes in WT+GCV GBMs. d Top: Violin plots of the single-sample GSEA (ssGSEA) senescent Z-score in all patient GBM cells. Patient GBMs data were extracted from Bhaduri et al., Johnson et al., and Neftel et al.. Bottom: Barplots of the percentage of the ssGSEA senescent Z-score distribution rate in all patient GBM cells. High and Low distribution rates correspond to the highest and lowest decile, respectively. e Table representing a Cox regression model using the ssGSEA-senescence score (sen-score), p16INK4a copy number alteration (p16-CNA) stratified into a group without alteration (normal) and a group harboring homozygous recessive deletion (homdel_rec) in the INK4a locus, the sex, the age of the patients and the Karnofsky score. f Representative SA-β-gal staining (blue) coupled with IHC (brown) and counterstained with hematoxylin (H) on patient GBM cryosections. Three patient GBMs were analyzed per antibody. Scale bar: 10 µm. g Table representing a Cox regression model using the ssGSEA NRF2 targets score (NRF2 targets score), p16INK4a copy number alteration, the sex, the age of the patients, and the Karnofsky score. e and g Data were extracted from The Cancer Genome Atlas (TCGA) GBM data sets and statistical significance was determined by a Log-Rank test. The error bars correspond to 95% Confidence Intervals (CIs). GCV ganciclovir, TMX tamoxifen, i.p. intraperitoneal, lv lentivirus, lv-luc lentivirus-luciferase, OS overall survival. Raw data are provided as a Source Data file.

References

    1. Ostrom QT, et al. CBTRUS statistical report: primary brain and central nervous system tumors diagnosed in the United States in 2006–2010. Neuro Oncol. 2013;15:ii1–ii56. - PMC - PubMed
    1. Stupp R, et al. Radiotherapy plus concomitant and adjuvant temozolomide for glioblastoma. N. Engl. J. Med. 2005;352:987–996. - PubMed
    1. Gorgoulis V, et al. Cellular senescence: defining a path forward. Cell. 2019;179:813–827. - PubMed
    1. Coppé J-P, Desprez P-Y, Krtolica A, Campisi J. The senescence-associated secretory phenotype: the dark side of tumor suppression. Annu. Rev. Pathol. Mech. Dis. 2010;5:99–118. - PMC - PubMed
    1. Faget DV, Ren Q, Stewart SA. Unmasking senescence: context-dependent effects of SASP in cancer. Nat. Rev. Cancer. 2019;19:439–453. - PubMed

Publication types

Substances