

Training drives turnover rates in racehorse proximal sesamoid bones
- PMID: 36707527
- PMCID: PMC9883508
- DOI: 10.1038/s41598-022-26027-y
Training drives turnover rates in racehorse proximal sesamoid bones
Abstract
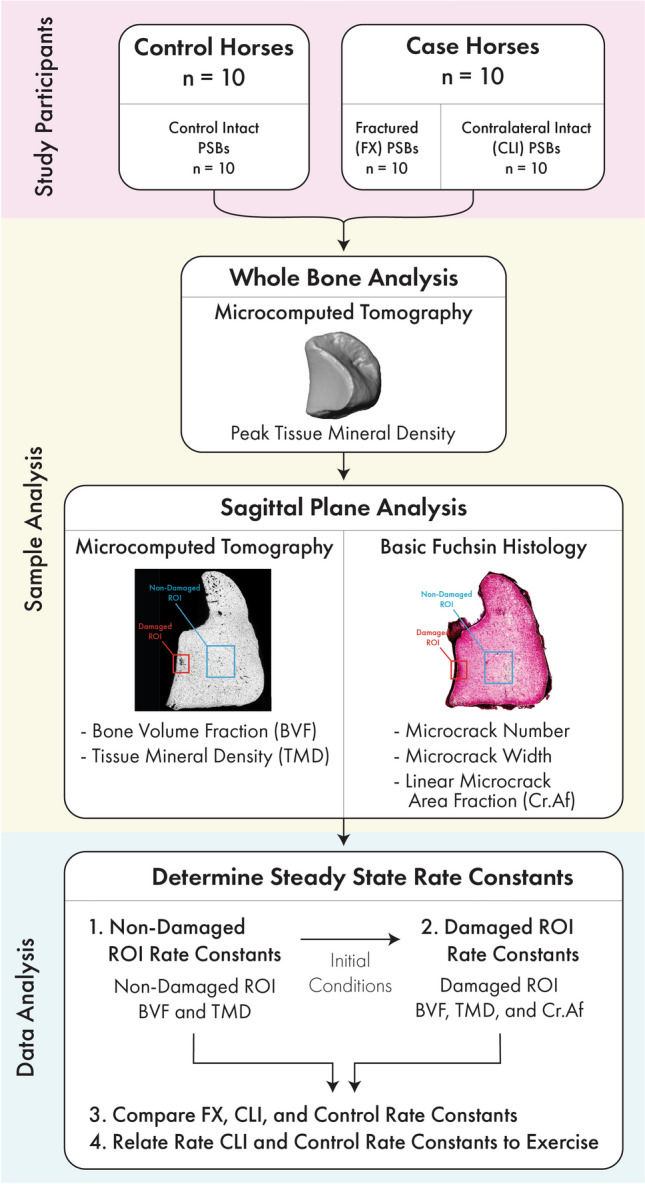
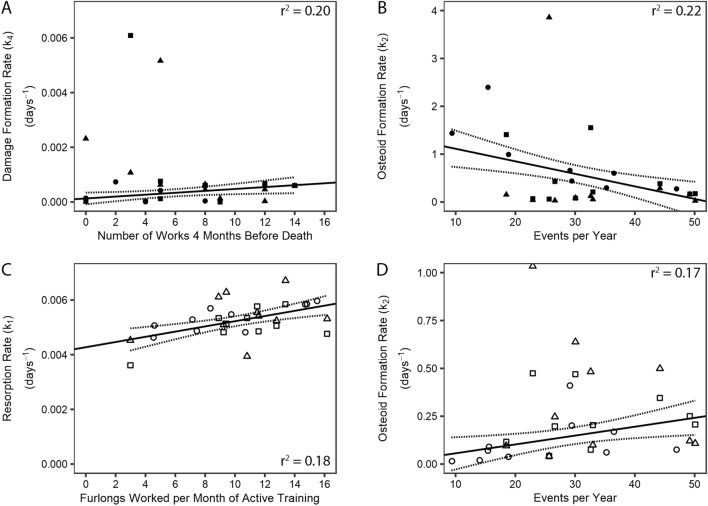
Focal bone lesions are often found prior to clinically relevant stress-fractures. Lesions are characterized by low bone volume fraction, low mineral density, and high levels of microdamage and are hypothesized to develop when bone tissue cannot sufficiently respond to damaging loading. It is difficult to determine how exercise drives the formation of these lesions because bone responds to mechanical loading and repairs damage. In this study, we derive steady-state rate constants for a compartment model of bone turnover using morphometric data from fractured and non-fractured racehorse proximal sesamoid bones (PSBs) and relate rate constants to racing-speed exercise data. Fractured PSBs had a subchondral focus of bone turnover and microdamage typical of lesions that develop prior to fracture. We determined steady-state model rate constants at the lesion site and an internal region without microdamage using bone volume fraction, tissue mineral density, and microdamage area fraction measurements. The derived undamaged bone resorption rate, damage formation rate, and osteoid formation rate had significant robust regression relationships to exercise intensity (rate) variables, layup (time out of exercise), and exercise 2-10 months before death. However, the direction of these relationships varied between the damaged (lesion) and non-damaged regions, reflecting that the biological response to damaging-loading differs from the response to non-damaging loading.
© 2023. The Author(s).
Conflict of interest statement
The authors declare no competing interests.
Figures

Similar articles
-
Exercise history predicts focal differences in bone volume fraction, mineral density and microdamage in the proximal sesamoid bones of Thoroughbred racehorses.J Orthop Res. 2022 Dec;40(12):2831-2842. doi: 10.1002/jor.25312. Epub 2022 Mar 19. J Orthop Res. 2022. PMID: 35245393 Free PMC article.
-
Proximal sesamoid bone microdamage is localized to articular subchondral regions in Thoroughbred racehorses, with similar fracture toughness between fracture and controls.Vet Surg. 2022 Aug;51(6):952-962. doi: 10.1111/vsu.13816. Epub 2022 Jun 7. Vet Surg. 2022. PMID: 35672916
-
Subchondral focal osteopenia associated with proximal sesamoid bone fracture in Thoroughbred racehorses.Equine Vet J. 2021 Mar;53(2):294-305. doi: 10.1111/evj.13291. Epub 2020 Jul 23. Equine Vet J. 2021. PMID: 32474944
-
Bone fatigue and its implications for injuries in racehorses.Equine Vet J. 2014 Jul;46(4):408-15. doi: 10.1111/evj.12241. Epub 2014 Apr 1. Equine Vet J. 2014. PMID: 24528139 Review.
-
Remodeling and the repair of fatigue damage.Calcif Tissue Int. 1993;53 Suppl 1:S75-80; discussion S80-1. doi: 10.1007/BF01673407. Calcif Tissue Int. 1993. PMID: 8275384 Review.
References
-
- Parfitt, A. M. The physiologic and clinical significance of bone histomorphometric data. in BoneHistomorphometry :TechniquesandInterpretation (ed. Recker, R. R.). 143–224 (1983).
