. 2023 Jan 27;14(1):444.
doi: 10.1038/s41467-023-36174-z.

Redox-dependent Igfbp2 signaling controls Brca1 DNA damage response to govern neural stem cell fate

Affiliations

Redox-dependent Igfbp2 signaling controls Brca1 DNA damage response to govern neural stem cell fate

Weam S Shahin et al. Nat Commun. .

Abstract

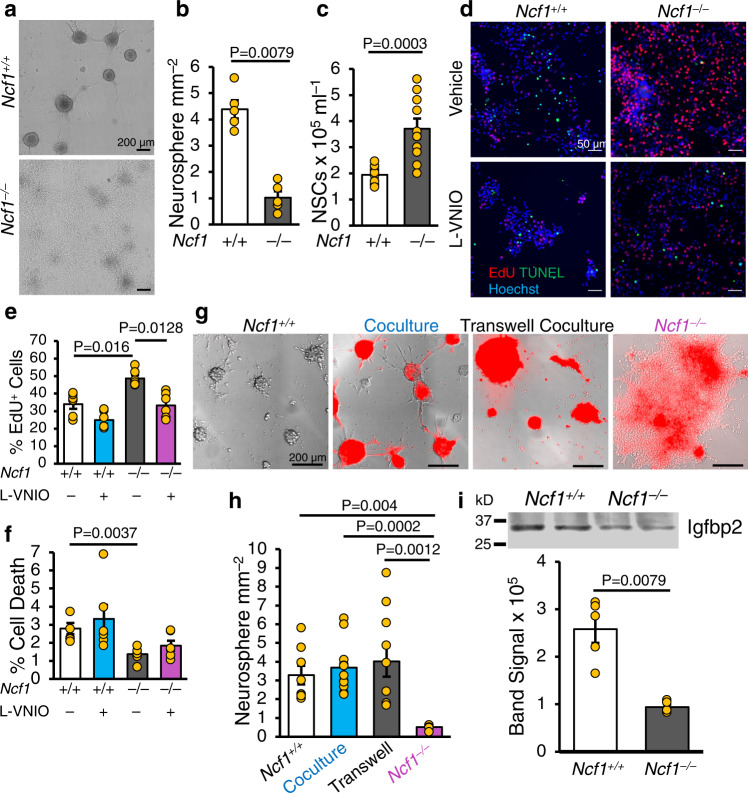
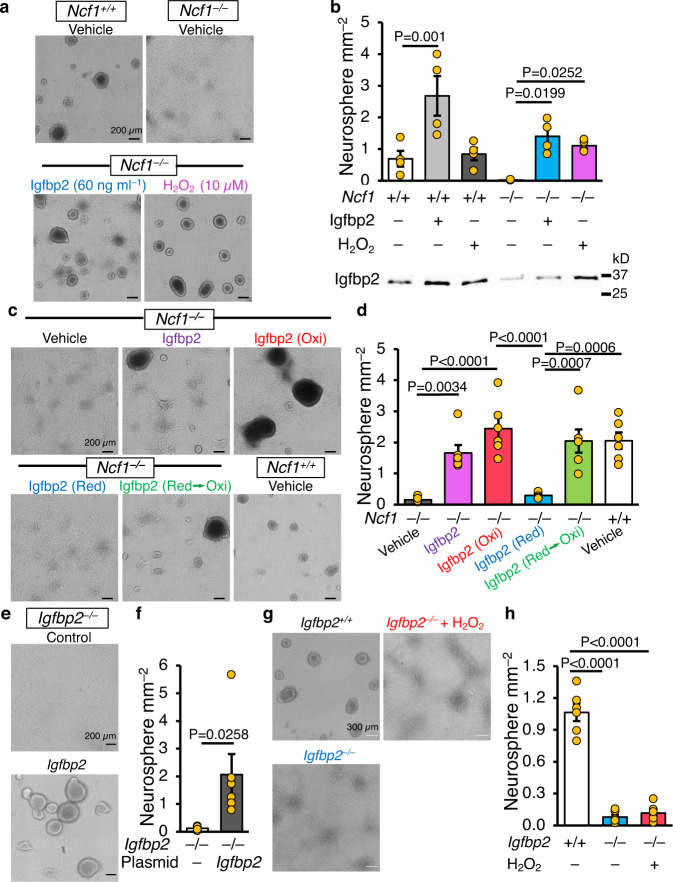
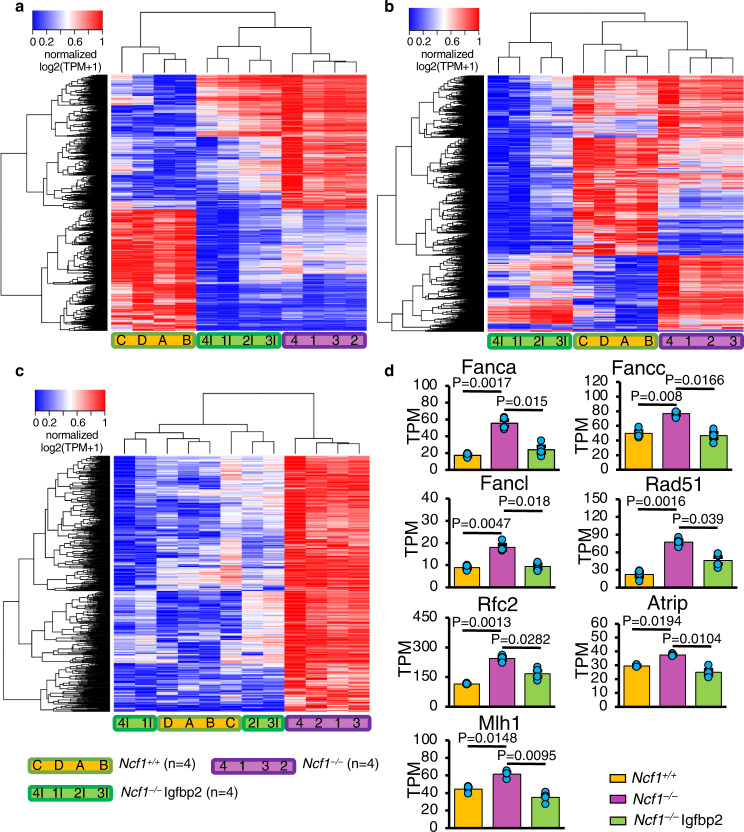
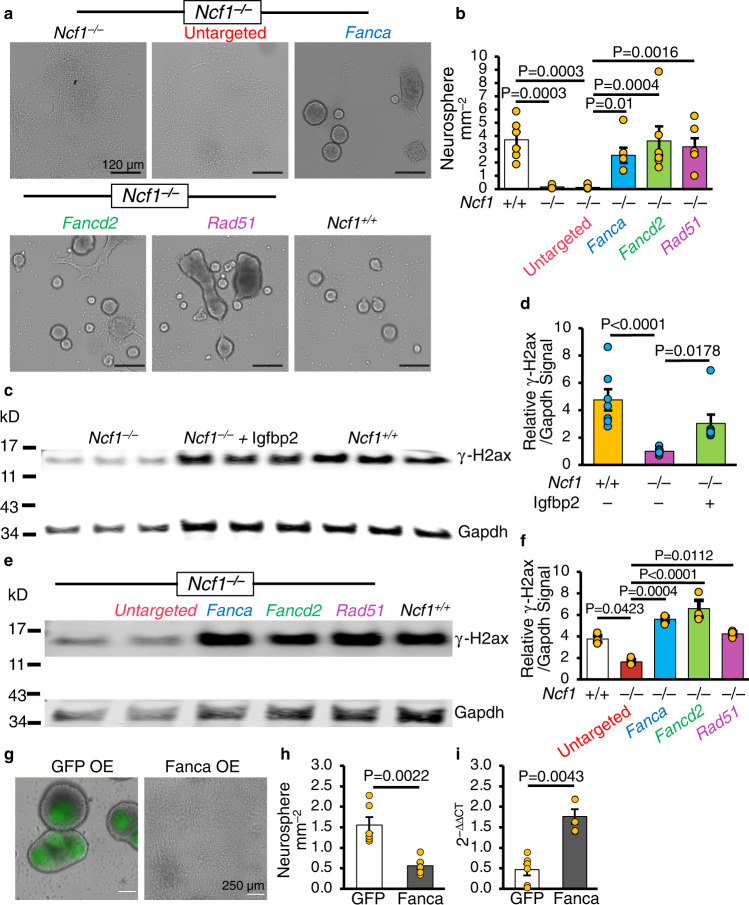
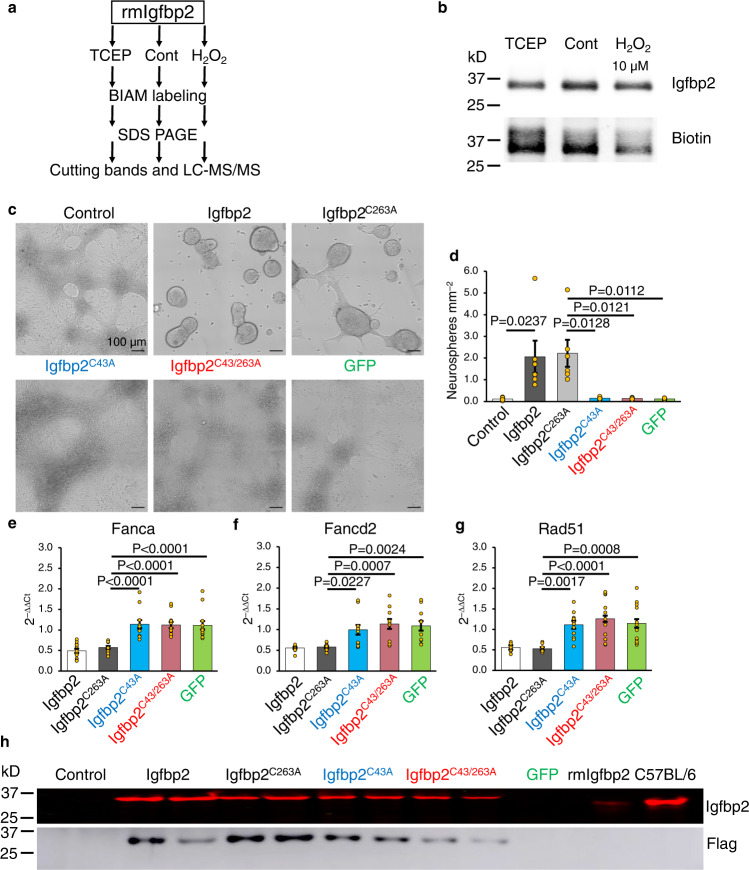
Neural stem cell (NSC) maintenance and functions are regulated by reactive oxygen species (ROS). However, the mechanisms by which ROS control NSC behavior remain unclear. Here we report that ROS-dependent Igfbp2 signaling controls DNA repair pathways which balance NSC self-renewal and lineage commitment. Ncf1 or Igfbp2 deficiency constrains NSCs to a self-renewing state and prevents neurosphere formation. Ncf1-dependent oxidation of Igfbp2 promotes neurogenesis by NSCs in vitro and in vivo while repressing Brca1 DNA damage response genes and inducing DNA double-strand breaks (DDSBs). By contrast, Ncf1-/- and Igfbp2-/- NSCs favor the formation of oligodendrocytes in vitro and in vivo. Notably, transient repression of Brca1 DNA repair pathway genes induces DDSBs and is sufficient to rescue the ability of Ncf1-/- and Igfbp2-/- NSCs to lineage-commit to form neurospheres and neurons. NSC lineage commitment is dependent on the oxidizable cysteine-43 residue of Igfbp2. Our study highlights the role of DNA damage/repair in orchestrating NSC fate decisions downstream of redox-regulated Igfbp2.


Conflict of interest statement

The authors declare no competing interests.

Figures

Fig. 1
Fig. 1. The Nox2 subunit Ncf1 facilitates neurosphere formation in a non-cell autonomous manner by regulating Igfbp2 secretion and activity.
ac Non-adherent cultures of primary postnatal forebrain NSCs were established from WT and Ncf1–/– mice and 2nd passage NSCs were grown for 11 days. a Photomicrographs of NSCs after 11 days in culture. b Quantification of neurospheres ≥60 µm in diameter (n = 5 donors). c Quantification of total cells in each NSC culture (n = 10 donors). df Monolayer cultures of 2nd passage neonatal NSCs were grown for 3 days with L-VNIO (100 µM) or vehicle. NSCs were pulsed with EdU (5 µM) for 4 h before fixation. d Photomicrographs of EdU (Red) and TUNEL (Green) labeling. e Quantification of EdU+ NSCs. f Quantification of cell death (n = 6 donors). g Photomicrographs of NSC cultures 5 days after plating 2nd passage of Ncf1–/– Tomato+ NSCs, in either direct coculture or transwell insert coculture with Ncf1+/+ Tomato NSCs. h Quantification of neurospheres ≥60 µm in diameter (n = 8, 12, 10, and 6 donors in WT, coculture, transwell coculture, and Ncf1–/– groups, respectively). i Western blot analysis and quantification comparing Igfbp2 levels in the conditioned medium 5 days after plating (n = 5 donors). The samples were derived from the same experiment and blots were processed in parallel. kD = kilodalton. Two-tailed Mann–Whitney U test (b, c, i) and Kruskal–Wallis (see Source data for full details) followed by Benjamini–Hochberg FDR multiple comparison posttest (e, f, h). Error bars indicate s.e.m. Scale: 200 µm. Source data are provided as a Source data file.
Fig. 2
Fig. 2. Non-reduced Igfbp2 is necessary for NSC lineage commitment.
a, b Second-passage WT and Ncf1–/– NSCs were treated with mouse recombinant insulin-like growth factor-binding protein 2 (Igfbp2) or H2O2 24–28 h after plating. a Photomicrographs of NSCs 5 days after treatment with Igfbp2 (60 ng ml–1) or H2O2 (10 µM). b Quantification of neurospheres ≥60 µm in diameter (n = 4 donors). Western blot below the bar graph shows Igfbp2 levels in the medium 5 days post-treatment. c Photomicrographs of NSCs 8 days after treatment with 100 ng ml–1 native Igfbp2, H2O2-treated (Oxi), DTT-treated (Red), or DTT then H2O2 sequentially treated (Red → Oxi) Igfbp2. d Quantification of neurospheres ≥60 µm in diameter (n = 6 donors). e, f Igfbp2–/– NSCs were transfected with empty or Igfbp2 expressing plasmid 24 h after plating. e Photomicrographs of NSCs 11 days after transfection. f Quantification of neurospheres ≥60 µm in diameter (n = 6 donors). g, h Second passage WT and Igfbp2–/– NSCs were treated with H2O2 24 h after plating. g Photomicrographs of NSCs 10 days after H2O2 (10 µM) treatment. h Quantification of neurospheres ≥60 µm in diameter (n = 6 donors). Two-tailed students t-test (f), Two-way ANOVA (b), and One-way ANOVA (d, h), followed by Bonferroni multiple comparison posttest. Error bars indicate s.e.m. Scale: 200 µm (a, c, e) and 300 µm (g). Source data are provided as a Source data file.
Fig. 3
Fig. 3. Ncf1 represses NSC DNA repair pathways in an Igfbp2-dependent manner.
NSCs prepared from 4 WT (A, B, C, and D) and 4 Ncf1–/– mice were treated with vehicle (1, 2, 3, and 4) or Igfbp2 (1I, 2I, 3I, and 4I) 48 h after plating. Vehicle- and Igfbp2-treated Ncf1–/– groups are matched for NSC preparation by the number with “I” indicating Igfbp2-treatment. After additional 48 h, total RNA was collected from all groups and ribosome-depleted RNAseq was performed. ac Heat maps represent clustering based on Euclidean distance of all genes that were significantly differentially expressed between any of the three groups (WT, Ncf1–/–, and Igfbp2-treated Ncf1–/– NSCs) (a), WT and Ncf1–/– (b), and WT and Ncf1–/– for which expression was restored towards WT levels after treatment with Igfbp2 (c). Statistical analysis of changes in gene expression used Benjamini–Hochberg FDR corrected one-way ANOVAs (a) and Tukey’s post hoc tests (b, c). d Ingenuity Pathway Analysis (IPA) performed on the gene sets in (c) using the absolute fold change for Ncf1–/– vs. WT and Ncf1–/– + Igfbp2 vs. Ncf1–/– revealed the top pathway: Role of Brca1 in DNA Damage Response (P = 0.0010 and P = 0.0017, respectively) (Supplementary Data 3b). Subset of genes in the Brca1 pathway that are expressed differentially in each of the experimental groups. TPM: transcript per million. Benjamini–Hochberg corrected One-way ANOVA followed by Tukey’s multiple comparison post hoc test, N = 4 donors. Source data are provided as a Source data file.
Fig. 4
Fig. 4. Ncf1/Igfbp2 axis promotes NSC lineage-commitment through repression of NSC DNA repair pathways.
a, b Photomicrographs (a) and quantification (b) of neurospheres ≥60 µm in diameter 7 days after transfection of Ncf1–/– NSCs with siRNA targeting Fanca, Fancd2 or Rad51 or negative control (n = 6 donors). c, d Western blot analysis (c) and quantification (d) of γ-H2ax levels (normalized to Gapdh) in NSC lysates 3 days after Igfbp2 treatment (n = 7 donors from two different experiments). e, f Western blot (e) and quantification (f) of γ-H2ax levels (relative to Gapdh) in cell lysates 3 days after transfection (n = 3 donors). The samples were derived from the same experiment and blots were processed in parallel. kD = kilodalton. gi WT NSCs were transduced with Peggy Back transposase and transposon to overexpress GFP or Fanca. g Photomicrographs and h quantification of neurospheres ≥60 µm in diameter ten days after plating P4 NSCs overexpressing GFP or Fanca (n = 6 donors). i qPCR of Fanca mRNA 3 days after plating P5 WT NSCs overexpressing GFP or Fanca (n = 6 and 5 donors in GFP and Fanca OE NSCs respectively). ΔΔCT: the difference in threshold cycles normalized to β-Actin. Kruskal–Wallis test and FDR method of Benjamini and Hochberg multiple comparison posttest (d), One-way ANOVA and FDR method of Benjamini and Hochberg (b) or Bonferroni multiple comparison posttest for marked comparisons in (f) and two-tailed Mann–Whitney U test (h, i). Error bars indicate s.e.m. Scale: 120 and 250 µm in (a) and (g) respectively. Source data are provided as a Source data file.
Fig. 5
Fig. 5. Ncf1/Igfbp2-mediated repression of NSC DNA repair pathways requires Igfbp2C43 to promote neurosphere formation.
a Experimental design. b Western blot analysis of untreated or TCEP- or H2O2-treated recombinant mouse Igfbp2 (rmIgfbp2) after labeling with biotinylated iodoacetamide (BIAM). ch Igfbp2–/– NSCs were transfected with Igfbp2, Igfbp2C263A, Igfbp2C43A, Igfbp2C43/263A, or GFP expressing plasmid 24 h after plating. c Photomicrographs of NSCs 11 days after transfection. d Quantification of neurospheres ≥60 µm in diameter (n = 6 donors). eg qPCR of Fanca (e), Fancd2 (f) and Rad51 (g) in Igfbp2–/– NSCs 5 days after transfection with Igfbp2, Igfbp2C263A, Igfbp2C43A, Igfbp2C43&263A, or GFP expressing plasmid (n = 12 donors). ΔΔCT: the difference in threshold cycles normalized to β-Actin and compared to untransfected Igfbp2–/– NSCs. h Western blot analysis of Igfbp2 and flag-tag in conditioned medium 3 days after transfection. kD = kilodalton. One-way ANOVA followed by Bonferroni multiple comparison posttest for marked comparisons in (d) or comparing the mean of each group to the mean of untransfected Igfbp2–/– NSCs in (eg). Error bars indicate s.e.m. Scale: 100 µm. Source data are provided as a Source data file.

Similar articles

Cited by

References

    1. Chuikov S, Levi BP, Smith ML, Morrison SJ. Prdm16 promotes stem cell maintenance in multiple tissues, partly by regulating oxidative stress. Nat. Cell Biol. 2010;12:999–1006. - PMC - PubMed
    1. Coant N, et al. NADPH oxidase 1 modulates WNT and NOTCH1 signaling to control the fate of proliferative progenitor cells in the colon. Mol. Cell. Biol. 2010;30:2636–2650. - PMC - PubMed
    1. Ito K, et al. Regulation of oxidative stress by ATM is required for self-renewal of haematopoietic stem cells. Nature. 2004;431:997–1002. - PubMed
    1. Kimura W, et al. Redox signaling in cardiac renewal. Antioxid. redox Signal. 2014;21:1660–1673. - PMC - PubMed
    1. Paul MK, et al. Dynamic changes in intracellular ROS levels regulate airway basal stem cell homeostasis through Nrf2-dependent Notch signaling. Cell Stem Cell. 2014;15:199–214. - PMC - PubMed

Publication types

Substances