Review
. 2023 Mar;24(3):153-172.
doi: 10.1038/s41583-022-00670-w. Epub 2023 Jan 27.

Neurophysiological mechanisms of error monitoring in human and non-human primates

Affiliations
Review

Neurophysiological mechanisms of error monitoring in human and non-human primates

Zhongzheng Fu et al. Nat Rev Neurosci. 2023 Mar.

Abstract

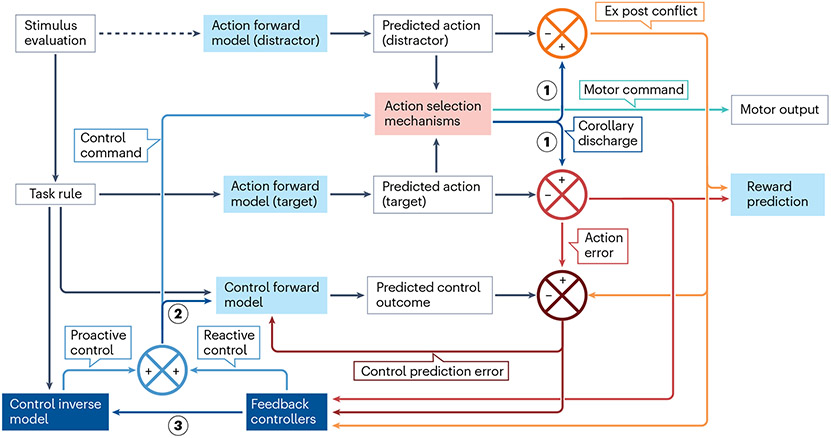
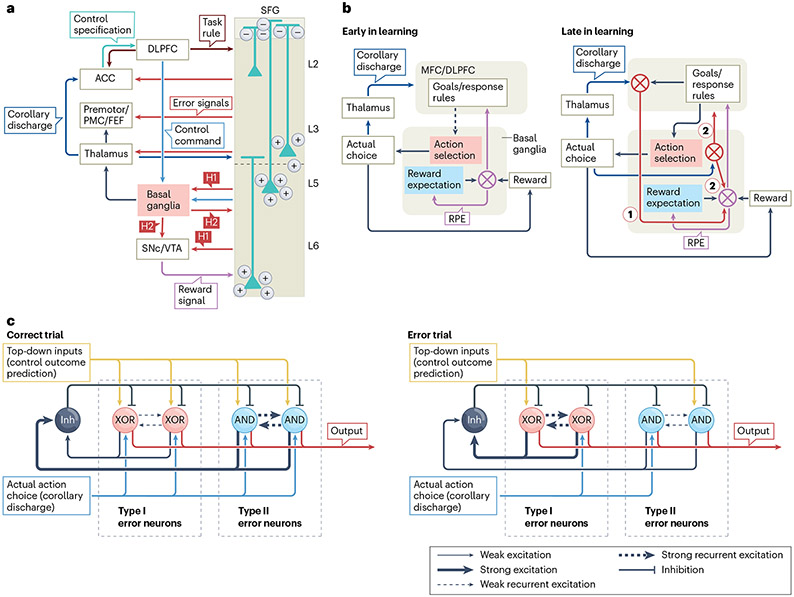
Performance monitoring is an important executive function that allows us to gain insight into our own behaviour. This remarkable ability relies on the frontal cortex, and its impairment is an aspect of many psychiatric diseases. In recent years, recordings from the macaque and human medial frontal cortex have offered a detailed understanding of the neurophysiological substrate that underlies performance monitoring. Here we review the discovery of single-neuron correlates of error monitoring, a key aspect of performance monitoring, in both species. These neurons are the generators of the error-related negativity, which is a non-invasive biomarker that indexes error detection. We evaluate a set of tasks that allows the synergistic elucidation of the mechanisms of cognitive control across the two species, consider differences in brain anatomy and testing conditions across species, and describe the clinical relevance of these findings for understanding psychopathology. Last, we integrate the body of experimental facts into a theoretical framework that offers a new perspective on how error signals are computed in both species and makes novel, testable predictions.


Figures

Fig. 1 ∣
Fig. 1 ∣. Locations of medial frontal lobe areas implicated in performance monitoring and typical recording approaches.
a, Cross sections of the macaque (top) and human (middle and bottom) brains highlighting the relative locations of the pre-supplementary motor area (pre-SMA; green), supplementary motor area (SMA; blue), supplementary eye field (SEF; red), dorsal middle cingulate cortex (dMCC; yellow) and ventral middle cingulate cortex (vMCC; orange). Human brains are illustrated with the paracingulate sulcus absent (middle) or present (bottom). For each species, the approach used for neurophysiological sampling is illustrated. In macaques, intracortical neural signals are sampled with multicontact linear electrode arrays inserted nearly vertically, perpendicular to the cortical layers. In humans, intracortical neural signals are sampled with microwire electrodes. In both species, electroencephalography signals can be recorded from electrodes placed on the cranium (grey cylinder). b, Biophysical contributions of areas in the medial frontal cortex to the error-related negativity. Rostral (left) and caudal (right) sections are presented to highlight variation in contributions from the different cortical areas. Putative dipoles are distinguished by colour for the SEF (red), pre-SMA (green), dMCC (yellow) and vMCC (orange). Dipole orientation varies with cortical folding. The hypothesized vectorial contributions of dipoles in each area (re) to medial frontal electroencephalography voltage (Ve) are portrayed through arrows indicating polarity and strength. CS, cingulate sulcus; Fz, frontal midline EEG electrode; FZc, frontal central EEG electrode; PCS, paracingulate sulcus.
Fig. 2 ∣
Fig. 2 ∣. Error neurons and error-related negativity in macaques and humans.
Each piece of data is shown for both species for visual comparison. a,b, Examples of single neurons responding to error trials with increased firing rate compared with correct trials. c,d, Average scalp and intracranial error-related negativity (ERN) from individual sessions, revealing a stronger negativity for error than correct trials in both species. AUC, area under the curve; Fz, frontal midline EEG electrode; MCC, middle cingulate cortex; pre-SMA, pre-supplementary motor area; SEF, supplementary eye field. Part a adapted from ref. , Springer Nature Limited. Data in part b are from ref. . The left panel in part c is adapted from ref. , Springer Nature Limited. The middle panel in part c is adapted with permission from ref. , APS. The right panel in part d is adapted with permission from ref. , APS. The left panel in part d is adapted with permission from ref. , Elsevier. The data in the middle and right panels in part d are from ref. .
Fig. 3 ∣
Fig. 3 ∣. Reliability and latency of error responses in macaques and humans.
Each piece of data is shown for both species for visual comparison. a,b, Single-trial reliability of the error-related negativity (ERN) amplitude at the scalp (left) and intracranial (right) level is high in both species. Each plot is from an individual session. c,d, Single-trial latency of the intracranial ERN (iERN) (left) and error neurons (right). In both species and with both metrics, error signals consistently appear first in the superior frontal gyrus. AUC, area under the curve; CDF, cumulative distribution function; MCC, middle cingulate cortex; pre-SMA, pre-supplementary motor area; SEF, supplementary eye field. Parts a,b are based on reanalysis of data shown in refs. ,. Single-trial amplitudes were extracted using the method described in ref. . Part c is adapted with permission from ref. , APS. Part d is adapted with permission from ref. , Elsevier.
Fig. 4 ∣
Fig. 4 ∣. Tasks for studying performance monitoring in macaques and humans.
a–f, Summary of tasks that have commonly been used to study performance monitoring; except those requiring reading (c,e), the tasks are suitable for both macaques and humans. For each task, the sequence of screens shown to the participant (left side) and the timing of critical events during a trial (right side) are shown. a,b, Stop-signal task, which requires participants to stop a movement when the stop signal is shown (red). c–f, Screens for the four human tasks: Stroop task, flanker task, multisource interference task (MSIT) and Simon task, in which participants are prompted to make a response by button press indicating the word colour, unique number, central target orientation or identity of the target, respectively. g, Timing applicable to all tasks shown in parts c–f. See Supplementary Fig. 1 for an illustration of the other three commonly used tasks: change-signal task, go–no-go task and antisaccade task. Table 2 shows the cognitive constructs engaged by these tasks.
Fig. 5 ∣
Fig. 5 ∣. Conceptual framework for action error computation.
The available actions under a given task rule and stimulus are predicted by action forward models (light blue). This includes both the correct response (target) and the incorrect response (distractor). The action selection process (red box) then chooses between one of the possible actions. Action selection is modulated by the control command (blue line), which is composed of proactive and reactive components (blue). The feedback controllers use performance-monitoring information from the prior trial to provide reactive control, and the control inverse model provides proactive control based on the task rules. Three kinds of performance-monitoring signals are computed (none of which depends on external feedback). The red cross computes action error signals by comparing the selected action, conveyed as corollary discharge 1, with the predicted goal-compatible action. The orange cross computes ex post conflict signals that are the result of comparing the selected action, conveyed as corollary discharge 1, with the predicted goal-incompatible action. The dark red cross computes control prediction error by comparing the predicted control outcome and the actual control outcome (error, conflict); it can also recruit feedback control. Action errors and ex-post conflict are used to predict the occurrence of reward. The control forward model predicts whether the current control settings, conveyed as corollary discharge 2, will result in an action error and/or ex post conflict. The extent to which feedback control was recruited is provided to the control inverse model as corollary discharge 3. Light blue boxes are forward models (predictors), dark blue boxes are controllers and the red box is action selection. Dark blue arrows are corollary discharges.
Fig. 6 ∣
Fig. 6 ∣. Circuit model for action error computation.
a, Putative microcircuitry model of action error computation. The middle cingulate cortex (MCC) receives error signals from the superior frontal gyrus (SFG) and instantiates the control forward models and the specification part of the control inverse model. The inverse models that generate control commands are part of the MCC and the dorsolateral prefrontal cortex (DLPFC). The basal ganglia receive control commands and help to select an action, which is conveyed back to the SFG and the MCC as a corollary discharge. The illustrated pyramidal neurons are error neurons in the SFG. Red arrows indicate flow of error information. The positive and negative symbols represent electric charges contributing to the dipole influencing the electroencephalography signal upon error neuron activation. b, Error computation at different stages of learning. When a new task is being learned, learning is driven by reward prediction errors (RPEs), which are conveyed by midbrain dopaminergic neurons to train cortical representations (left). After choice and response rules have been learned, errors are either computed locally in the medial frontal cortex (MFC) (hypothesis H1, our proposed model) or in the basal ganglia and are passed on to the MFC (hypothesis H2, the reinforcement learning–error-related negativity model). c, Winner-take-all computation of action errors. Type I error neurons increase (decrease) spike rates in error (correct) trials, implemented as anti-coincidence detectors. Type II error neurons decrease (increase) spike rates in error (correct) trials, implemented as coincidence detectors. The top-down inputs represent the predicted action, and the thalamic inputs represent the action choice conveyed as a corollary discharge. Neurons labelled ‘AND’, ‘XOR’ (exclusive or) and ‘Inh’ are coincidence detectors, anticoincidence detectors and inhibitory, respectively. ACC, anterior cingulate cortex; FEF, frontal eye field; L, layer; PMC, primary motor cortex; premotor, premotor cortex; SNc, substantia nigra pars compacta; VTA, ventral tegmental area.

Similar articles

Cited by

References

    1. Rabbitt PM Errors and error correction in choice-response tasks. J. Exp. Psychol 71, 264–272 (1966).

      The original description of slowing after errors, revealing the existence of and a means to investigate performance monitoring.

    1. Logan GD & Crump MJ Cognitive illusions of authorship reveal hierarchical error detection in skilled typists. Science 330, 683–686 (2010). - PubMed
    1. Wessel JR An adaptive orienting theory of error processing. Psychophysiology 55, e13041 (2018). - PubMed
    1. Ullsperger M, Danielmeier C & Jocham G Neurophysiology of performance monitoring and adaptive behavior. Physiol. Rev 94, 35–79 (2014). - PubMed
    1. Ullsperger M Performance monitoring in neurological and psychiatric patients. Int. J. Psychophysiol 59, 59–69 (2006). - PubMed

Publication types