. 2023 Jan 27;6(1):108.
doi: 10.1038/s42003-023-04448-3.

Self-recycling and partially conservative replication of mycobacterial methylmannose polysaccharides

Affiliations

Self-recycling and partially conservative replication of mycobacterial methylmannose polysaccharides

Ana Maranha et al. Commun Biol. .

Abstract

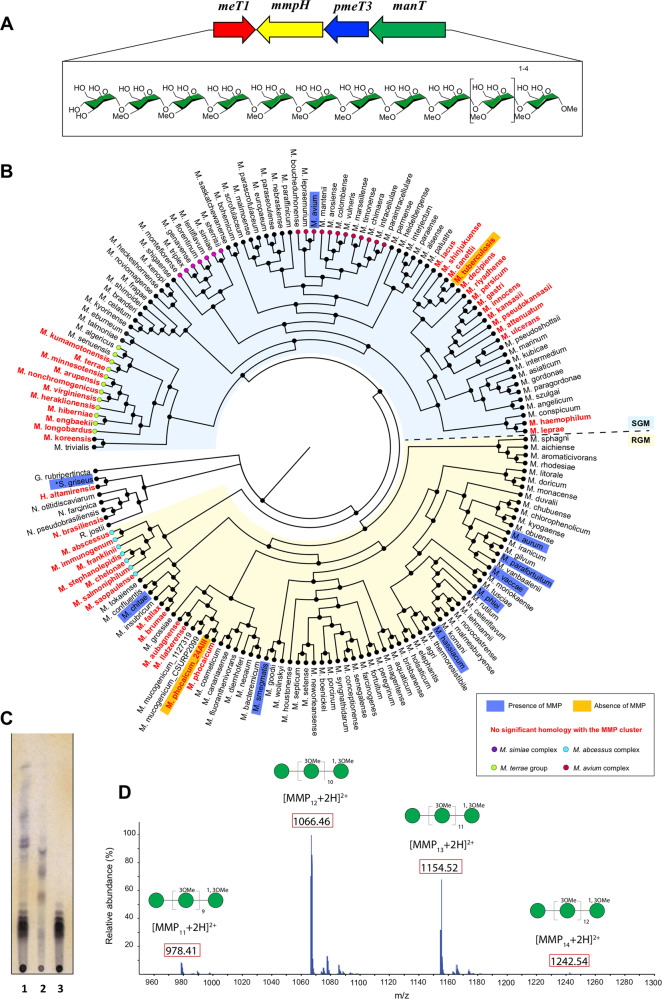
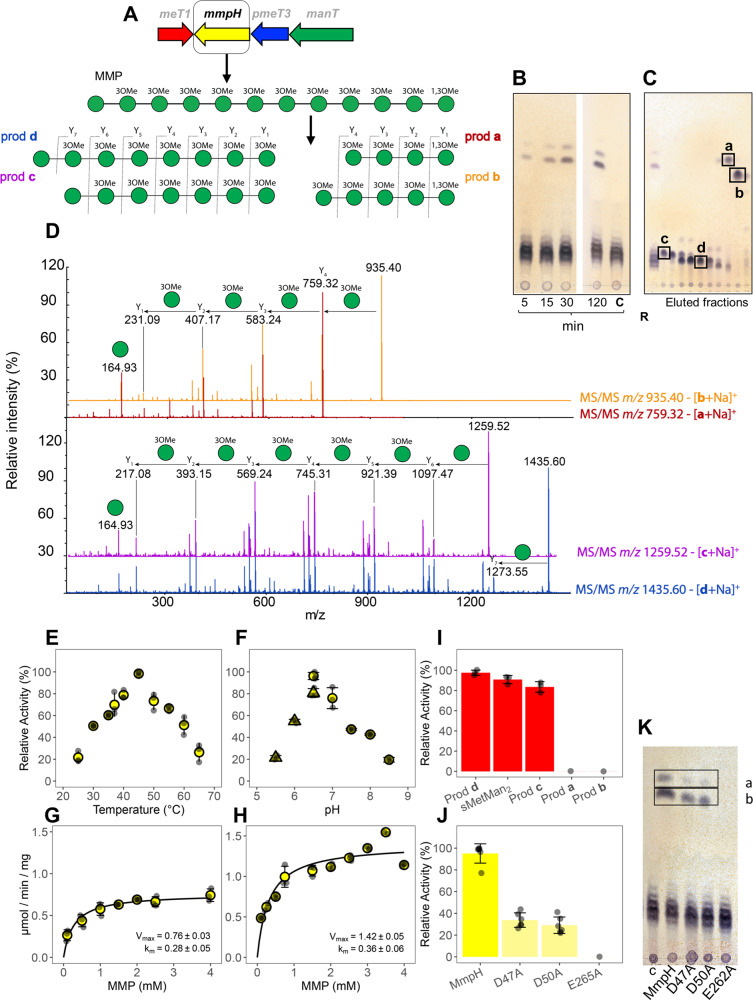
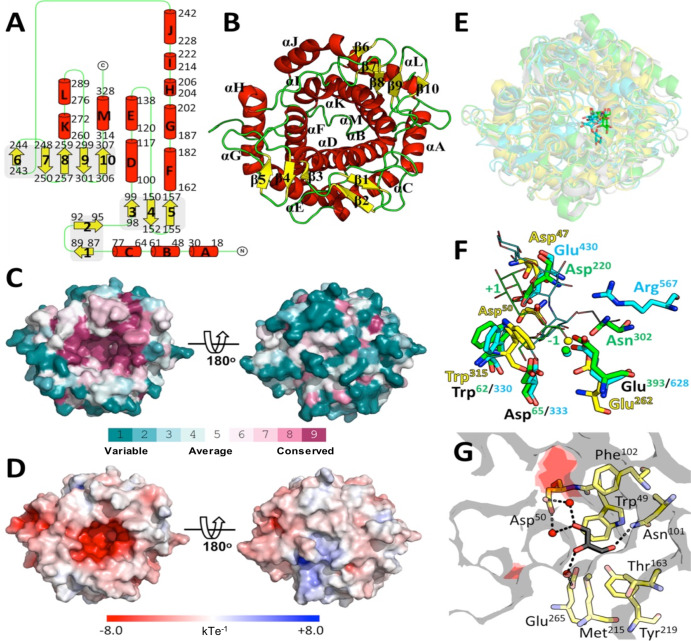
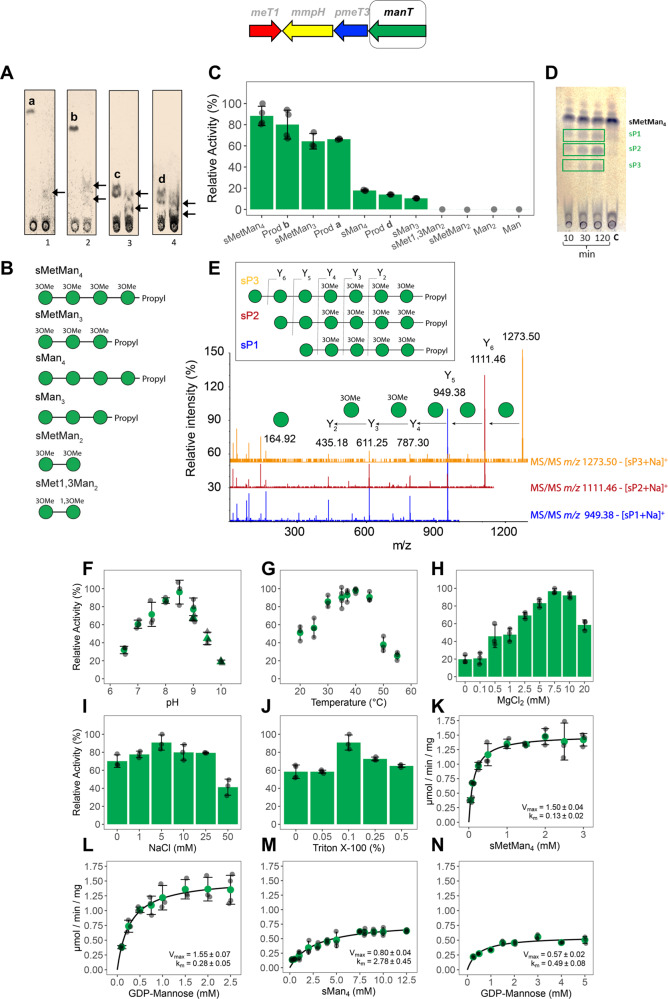
The steep increase in nontuberculous mycobacteria (NTM) infections makes understanding their unique physiology an urgent health priority. NTM synthesize two polysaccharides proposed to modulate fatty acid metabolism: the ubiquitous 6-O-methylglucose lipopolysaccharide, and the 3-O-methylmannose polysaccharide (MMP) so far detected in rapidly growing mycobacteria. The recent identification of a unique MMP methyltransferase implicated the adjacent genes in MMP biosynthesis. We report a wide distribution of this gene cluster in NTM, including slowly growing mycobacteria such as Mycobacterium avium, which we reveal to produce MMP. Using a combination of MMP purification and chemoenzymatic syntheses of intermediates, we identified the biosynthetic mechanism of MMP, relying on two enzymes that we characterized biochemically and structurally: a previously undescribed α-endomannosidase that hydrolyses MMP into defined-sized mannoligosaccharides that prime the elongation of new daughter MMP chains by a rare α-(1→4)-mannosyltransferase. Therefore, MMP biogenesis occurs through a partially conservative replication mechanism, whose disruption affected mycobacterial growth rate at low temperature.


Conflict of interest statement

The authors declare no competing interests.

Figures

Fig. 1
Fig. 1. Analysis of the presence of MMP in Mycobacterium and related genera.
A Organization of the cluster of MMP biosynthetic genes (arrows) in mycobacterial genomes. Red, meT1, 1-O-methyltransferase gene; yellow, mmpH, MMP hydrolase gene; blue, pmeT3, putative 3-O-methyltransferase gene; green, manT, mannosyltransferase gene. The chemical structure of MMP11-14 and the corresponding glycan representation are given below the gene cluster scheme (boxed), according to the guidelines of Symbol Nomenclature for Glycans. B Phylogenetic cladogram indicating the presence of the MMP gene cluster in bacterial genomes. The maximum likelihood phylogenetic tree was built based on the phylogenetic relationship between the complete genomes of 162 mycobacterial species and related actinobacteria (Table S1) as inferred using the bcgTree pipeline. Previous experimental evidence of the presence of MMP was considered,,. If not indicated in the cladogram, the strain listed in Table S1 was considered representative of the species. *Streptomyces griseus produces an acetylated form of MMP (AMMP). C TLC analysis of MMP purified from M. smegmatis (see Methods). Lane 1, MMP-containing fractions after reversed phase chromatography; lane 2, impurities separated from the MMP sample by gel filtration chromatography; lane 3, purified MMP mixture after gel filtration chromatography. D ESI-TOF spectrum of the purified MMP mixture acquired in positive ion mode. A filled green circle represents one mannose residue. [M + 2H]2+ ions are boxed red.
Fig. 2
Fig. 2. Biochemical characterization of M. hassiacum MmpH.
A MMP biosynthetic cluster and schematic representation of the hydrolytic activity of MmpH using MMP as substrate. B TLC analysis of a time course of MmpH activity; C, control reaction without enzyme. C TLC analysis of eluted fractions after purification of MmpH oligomannoside products; Lane R, MmpH reaction mixture using MMP as substrate. The purest oligomannoside products (a-d) eluted are indicated by black boxes. D Positive ion mode ESI-TOF analysis of purified oligomannoside products. Product ion nomenclature follows that proposed by Domon and Costello and the fragmentation pathways of Y-type glycosidic cleavages are indicated. The representation of glycans follows the guidelines of Symbol Nomenclature for Glycans. A filled green circle represents a mannose residue. E Temperature profile of MmpH activity. F pH dependence of MmpH activity in the presence of MES (triangle) and BTP (circle) buffers. G Michaelis–Menten curve for the enzymatic activity of MmpH at 37 °C. H Michaelis-Menten curve for the enzymatic activity of MmpH at 45 °C. I Relative activity of MeT1 using natural MmpH products (oligomannosides a-d) and synthetic sMetMan2 as substrate. J Enzymatic activity of MmpH variants Asp47Ala (D47A), Asp50Ala (D50A) and Glu256Ala (E256A) using MMP as substrate. K TLC analysis of the activity (30 min) of MmpH variants using MMP as substrate; C, control reaction without enzyme; Products a and b are in black boxes. Error bars represent standard deviation of three replicates.
Fig. 3
Fig. 3. Overall structure of M. hassiacum MmpH and structural comparison.
A Topology diagram of MmpH with α-helices (A–M) and β-strands (1–10) represented as red cylinders and yellow arrows, respectively. The number of the first and last residue of each secondary structure element is indicated. B Cartoon representation of the MmpH monomer with secondary structure elements colored as in panel (A). C Solid surface representation of MmpH colored according to ConSurf residue conservation score, calculated from the amino acid sequence alignment of 150 MmpH homologues (fig. S7). The color-code gradient (from teal for variable positions to purple for highly conserved ones) is shown at the bottom of the panel. The left pose is oriented as in panel B (top view). The right pose results from a 180° rotation of the left pose around x (bottom view). D Solid surface representation of MmpH colored according to its electrostatic surface potential (calculated with APBS, as implemented in PyMOL (Schrödinger)), contoured from −8 (red) to 8 kT/e (blue). The two views of the MmpH monomer are those depicted in panel (C). E Superposition of MmpH (yellow) in the same orientation as in panel B with GH15 family member-G1d from Arthrobacter globiformis (cyan; PDB entry 1ULV), CpGH125 from Clostridium perfringens (green; PDB entry 3QT9) and SpGH125 from Streptococcus pneumoniae (grey; PDB entry 3QRY). All proteins are shown in cartoon representation and the ligands acarbose, α-1,6-linked 1-thio-α-mannobiose and 1-deoxymannojirimycin (dMNJ) as stick models with carbon atoms colored as the corresponding cartoon, nitrogen atoms blue, oxygen red and sulfur yellow. F Close-up view of the superposed (-1) sugar binding subsites of G1d, CpGH125 and MmpH. Most residues involved in sugar recognition, as well as the catalytic acid and base are shown as stick models (color code as in panel E). Water molecules important for the inverting reaction mechanism are shown as spheres and colored as the carbon atoms of the corresponding protein. Sugar-binding subsites (−1) and (+1) of α-1,6-linked 1-thio-α-mannobiose-binding CpGH125 are indicated for clarity. G Close-up of the adjacent subsite of MmpH, represented as a transparent grey surface with the putative catalytic acid (Asp47) and base (Glu262) colored red. Residues establishing contacts with the bound glycerol molecule are represented as stick models and colored as in panel (F). Dashed black lines and red spheres represent hydrogen bonds and water molecules, respectively.
Fig. 4
Fig. 4. Biochemical characterization of M. hassiacum ManT.
A TLC analysis of ManT activity using the natural MmpH oligomannoside products as substrates. Letters a to d indicate products of MmpH activity used in control reactions without ManT. Lanes 1-4, ManT reactions with tetramannoside a, pentamannoside b, heptamannoside c and octamannoside d. Products of ManT activity are indicated by arrows. B Schematic representation of chemically synthesized oligomannosides (see Supplementary Methods). Green circles represent mannose units. C Relative activity of ManT in the presence of natural oligomanosides (MmpH products) and synthetic acceptor substrates: Man (mannose); Man2 (α-mannobiose); sMetMan2, sMet1,3Man2, sMan3, sMan4, sMetMan3 and sMetMan4 (see Supplementary Methods). D TLC analysis of a time course of ManT activity using the synthetic tetramannoside sMetMan4 as substrate: C: control reaction without enzyme; sP1, sP2 and sP3 are products of ManT activity using synthetic substrates. E MS/MS analysis of ManT products sP1 to sP3 (schematic representation in inset). Product ion nomenclature follows that proposed by Domon and Costello and the fragmentation pathways of Y- type glycosidic cleavages are shown. The representation of glycans follows the guidelines of Symbol Nomenclature for Glycans. A filled green circle represents a mannose residue. F pH dependence of ManT activity examined in BTP (circles) and CAPSO (triangles) buffers. G Temperature profile of ManT activity. H ManT activity in the presence of increasing concentrations of MgCl2. I Effect of NaCl concentration on the activity of ManT. J Effect of Triton X-100 concentration on the activity of ManT. Biochemical properties were determined in the presence of the tetramannoside acceptor sMetMan4. K, L Michaelis–Menten curve for the activity of ManT as a function of substrates sMetMan4 and GDP-Man, respectively. M, N Michaelis–Menten curve for the activity of ManT as a function of unmethylated sMan4 and GDP-Man, respectively. Kinetic parameters were examined at 37 °C. Error bars represent standard deviation of three replicates.
Fig. 5
Fig. 5. Structural characterization of M. hassiacum ManT.
A Cartoon representation of the crystallographic structure of ManT with secondary structure elements colored yellow (β-strands β1–β13) and red (α-helices αA–αO). The N- and C-terminal domains of the protein and the inter-domain linker are also labeled. B Superposition of the three-dimensional structure of ManT with those of structural homologues. The crystal structure of ManT (green) was superposed with those of GT-4 family members PimA from M. smegmatis (cyan; PDB entry 2GEJ), and MshA from Corynebacterium glutamicum (tan; PDB entry 3C4Q). All proteins are represented as transparent cartoons and bound GDP-Man and UDP are represented as stick models with carbon atoms colored as the corresponding cartoon, nitrogen atoms blue and oxygen red. C, D Close-up views of the sugar-donor binding sites of PimA, MshA and ManT. Residues directly involved in the recognition of the nucleotide (C) and of the mannosyl moiety of GDP-Man (D) are shown as stick models and colored as in (B). The β11-αK loop of ManT, in the conformation observed in molecule B is also represented. E Solid surface representation of ManT colored according to ConSurf residue conservation score, calculated from the amino acid sequence alignment of 149 ManT homologues (fig. S10). The color-code gradient (from teal for variable positions to purple for highly conserved ones) is shown at the bottom of the panel. The left pose is oriented as in B (top view). The right pose results from a 180° rotation of the left pose around x (bottom view). F Solid surface representation of ManT colored according to its electrostatic surface potential (calculated with APBS, as implemented in PyMOL (Schrödinger)), contoured from −8 (red) to 8 kT/e (blue). The two views of the ManT monomer are those depicted in panel (E). G Relative activity of ManT variants Glu313Ala (E313A), Glu321Ala (E321A) and Lys240Ala (K240A) using sMetMan4 and GDP-Man as substrates. H TLC analysis of the activity of ManT variants (30 min and 2 h) using sMetMan4 as substrate; C, control reaction without enzyme. ManT products sP1 to sP3 are in green boxes. I, J Michaelis–Menten curve for ManT Glu313Ala variant as a function of substrates sMetMan4 and GDP-Man, respectively. Kinetic parameters were examined at 37 °C. Error bars represent standard deviation of three replicates.
Fig. 6
Fig. 6. Effects of the inactivation of mmpH on the growth of M. smegmatis.
A Genetic organization of mmpH and neighboring genes in M. smegmatis and in the unmarked mmpH-negative mutant. The deletion site on mmpH is marked by a cross. B PCR confirmation of M. smegmatis p2NIL-ΔmmpH-sel transformants. M, molecular weight marker; WT, amplification from M. smegmatis DNA; C, Msmeg:p2NIL-ΔmmpH-sel negative transformant; ΔmmpH, successful transformant with evident loss of a 290 bp fragment from the mmpH gene. C TLC analysis of PMPS purified from WT and ΔmmpH M. smegmatis. Tre, trehalose. Lanes 1, 2, 3 elution with 40, 60 and 80% (v/v) methanol. D Relative difference between the generation time (GT) of WT M. smegmatis and the ΔmmpH mutant (Fig. S11B) grown at the indicated temperatures in GBM. Error bars represent SEM of three replicates.
Fig. 7
Fig. 7. Proposed self-recycling mechanism for partially conservative biogenesis of mycobacterial MMP.
This mechanism relies on the hydrolytic activity of MmpH toward MMP, followed by the synthesis of new daughter MMP molecules occurring by the coordinated action of ManT, MeT1 and pMeT3. A dashed arrow indicates putative alternating ManT and pMeT3 activities proposed to be required for full assembly of mature MMP,. MeT1, MMP 1-O-methyltransferase; MmpH, MMP hydrolase (α-endomannosidase); pMeT3, putative MMP 3-O-methyltransferase; ManT, MMP α-(1→4)-mannosyltransferase; SAM, S-adenosyl methionine; SAH, S-adenosyl homocysteine; GDP-Man, Guanosine 5′-diphospho-α-D-mannose; GDP, Guanosine 5′-diphosphate.

Similar articles

References

    1. Falkinham JO., III Current epidemiologic trends of the nontuberculous mycobacteria (NTM) Curr. Environ. Health Rep. 2016;3:161–167. - PubMed
    1. Nunes-Costa D, Alarico S, Dalcolmo MP, Correia-Neves M, Empadinhas N. The looming tide of nontuberculous mycobacterial infections in Portugal and Brazil. Tuberculosis. 2016;96:107–119. - PubMed
    1. Ratnatunga CN, et al. The rise of non-tuberculosis mycobacterial lung disease. Front. Immunol. 2020;11:303. - PMC - PubMed
    1. Holt MR, Kasperbauer S. Management of extrapulmonary nontuberculous mycobacterial infections. Semin. Respir. Crit. Care Med. 2018;39:399–410. - PubMed
    1. Griffith DE, Aksamit TR. Understanding nontuberculous mycobacterial lung disease: it’s been a long time coming. F1000Research. 2016;5:2797–2797. - PMC - PubMed

Publication types

LinkOut - more resources