. 2023 Jan 27;7(1):14.
doi: 10.1038/s41698-023-00352-5.

Artificial intelligence reveals features associated with breast cancer neoadjuvant chemotherapy responses from multi-stain histopathologic images

Affiliations

Artificial intelligence reveals features associated with breast cancer neoadjuvant chemotherapy responses from multi-stain histopathologic images

Zhi Huang et al. NPJ Precis Oncol. .

Abstract

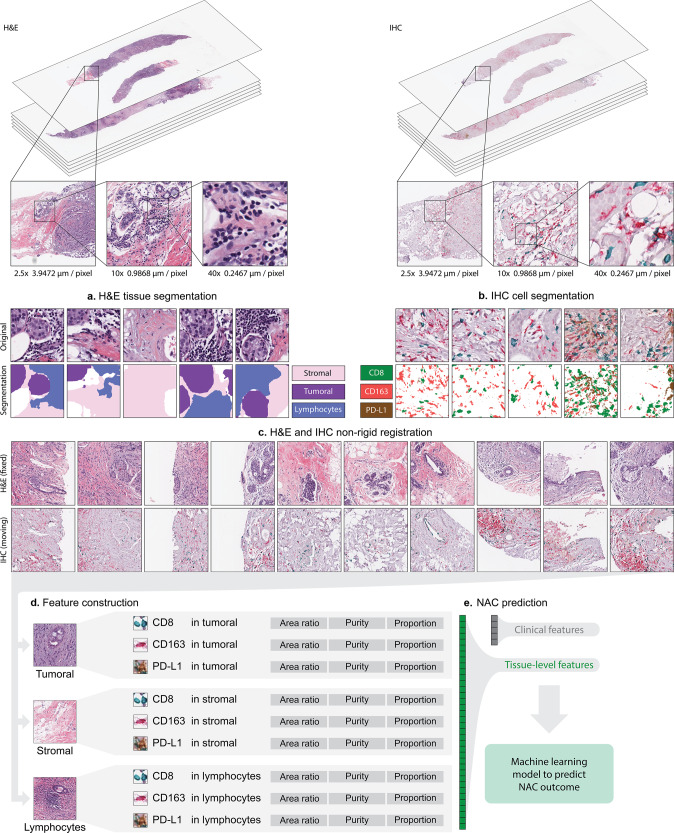
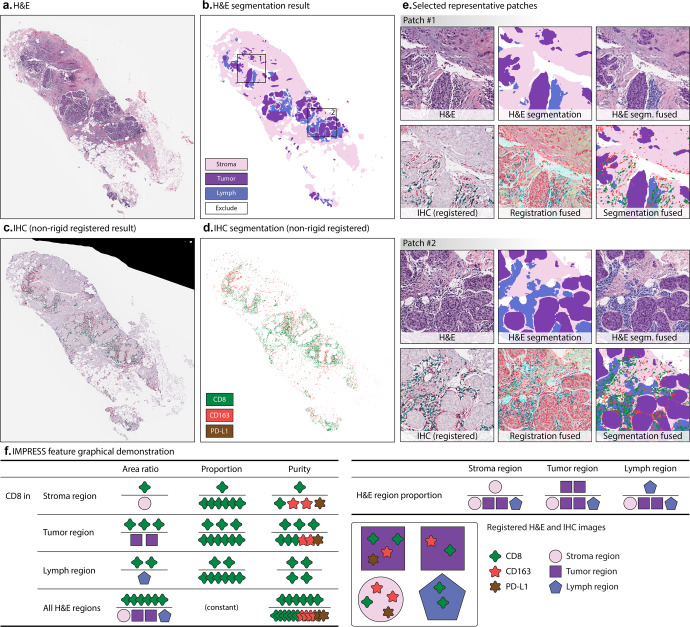
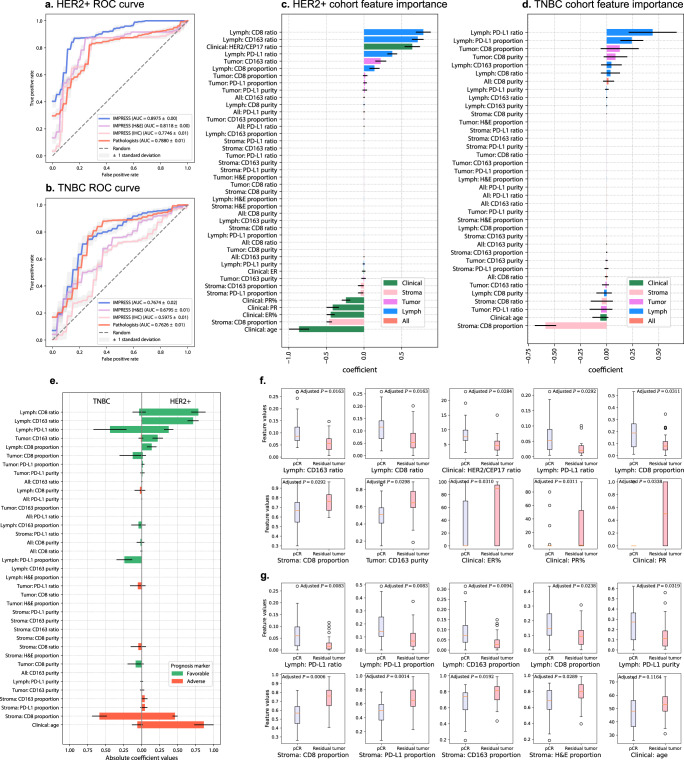
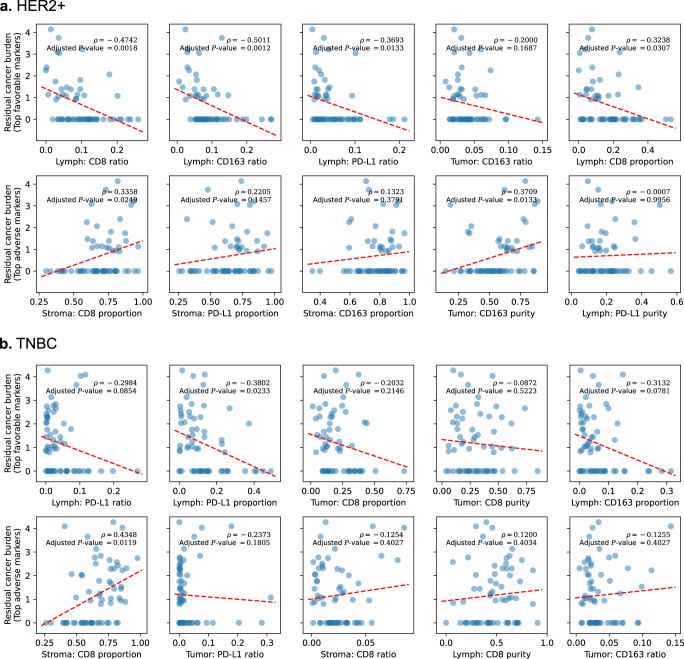
Advances in computational algorithms and tools have made the prediction of cancer patient outcomes using computational pathology feasible. However, predicting clinical outcomes from pre-treatment histopathologic images remains a challenging task, limited by the poor understanding of tumor immune micro-environments. In this study, an automatic, accurate, comprehensive, interpretable, and reproducible whole slide image (WSI) feature extraction pipeline known as, IMage-based Pathological REgistration and Segmentation Statistics (IMPRESS), is described. We used both H&E and multiplex IHC (PD-L1, CD8+, and CD163+) images, investigated whether artificial intelligence (AI)-based algorithms using automatic feature extraction methods can predict neoadjuvant chemotherapy (NAC) outcomes in HER2-positive (HER2+) and triple-negative breast cancer (TNBC) patients. Features are derived from tumor immune micro-environment and clinical data and used to train machine learning models to accurately predict the response to NAC in breast cancer patients (HER2+ AUC = 0.8975; TNBC AUC = 0.7674). The results demonstrate that this method outperforms the results trained from features that were manually generated by pathologists. The developed image features and algorithms were further externally validated by independent cohorts, yielding encouraging results, especially for the HER2+ subtype.


Conflict of interest statement

H.N. is an employee of Roche Diagnostic Inc. All other authors declare that the research was conducted in the absence of any commercial or financial relationships that could be construed as a potential conflict of interest.

Figures

Fig. 1
Fig. 1. Overview of our workflow.
a H&E tissue segmentation based on DeepLabV3 model. The segmentation generates stroma region, tumor region, and lymphocytes aggregated (lymph) region. b IHC markers segmentation. CD8, CD163, and PD-L1 were segmented. c H&E and IHC non-rigid registration. First row: representative H&E patches; second row: corresponding IHC patches after registration. d IMage-based Pathological REgistration and Segmentation Statistics (IMPRESS) feature construction. Totally 36 IMPRESS features were constructed. e Neoadjuvant chemotherapy (NAC) prediction with logistic regression.
Fig. 2
Fig. 2. Tissue segmentation and image-level features extraction from registered H&E and IHC segmentation.
a An example H&E tissue; b H&E tissue segmentation result; c IHC tissue (aligned to a) after non-rigid registration; d IHC segmentation results, after non-rigid registration. e Selected representative patches from b including (1) H&E patch, (2) H&E segmentation, (3) H&E segmentation (segm. in short) fused with original patch, (4) IHC patch after registration, (5) IHC patch after registration fused with H&E patch, and (6) H&E, IHC segmentation fused patch; f IMPRESS feature graphical demonstration. In f, each IHC marker produces 11 features (CD8 was shown as an example), H&E region produces 3 features, totally 36 IMPRESS features. Figure best viewed in color.
Fig. 3
Fig. 3. LASSO-regularized logistic regression machine learning model predicts NAC outcomes.
a, b Receiver operating characteristic (ROC) curve for HER2+ (a) and TNBC (b) cohorts in the logistic regression results. Blue line: IMPRESS plus clinical features; Purple line: IMPRESS (H&E features only) plus clinical features; Pink line: IMPRESS (IHC features only) plus clinical features; Red line: pathologists assessed plus clinical features. c, d Feature importance generated by logistic regression. Positive coefficients are associated with better prognosis (pCR) and vice versa. Horizontal line in each bar stands for standard deviation. c HER2+ cohort; d TNBC cohort. e Comparison of IMPRESS and clinical coefficient importance in machine learning results between HER2+ and TNBC cohorts, organized by HER2+ coefficients in descending order. Coefficients in the horizontal bar plot were reported in absolute values, the positive values were defined as “favorable” prognostic markers and vise versa for negative values. Figure best viewed in colors. Horizontal line in each bar stands for standard deviation. f, g Univariate feature analysis in HER2+ cohort (f) and TNBC cohort (g) by comparing pCR cases against residual tumor cases. In f and g, top row showed five most favorable features, bottom row showed five most adverse features. Two-sided P-values were calculated based on Student’s t-test, followed with B&H procedure for multiple test adjustment (FDR = 0.05). For boxplot, the interior horizontal red line represents the median value, the upper and lower box edges represent 75th and 25th percentile, and the upper and lower bars represent the 90th and 10th percentiles, respectively.
Fig. 4
Fig. 4. Scatter plot with Spearman’s rank correlation coefficient ρ and P-value between IMPRESS features and residual cancer burden (RCB).
a HER2+ cohort, first row: top 5 favorable IMPRESS features; second row: top 5 adverse IMPRESS features; b TNBC cohort, first row: top 5 favorable IMPRESS features; second row: top 5 adverse IMPRESS features. Dashed red lines represent the fitted linear regression slopes. All P-values were adjusted with B&H procedure (FDR = 0.05).
Fig. 5
Fig. 5. Correlation analyses for IMPRESS features in HER2+ and TNBC cohorts.
a HER2+ all IMPRESS feature correlation matrix; b HER2+ area ratio correlation matrix; c HER2+ proportion correlation matrix; d HER2+ purity correlation matrix; e TNBC all IMPRESS feature correlation matrix; f TNBC area ratio correlation matrix; g TNBC proportion correlation matrix; h TNBC purity correlation matrix. Figure best viewed in color.

References

    1. Bera K, Schalper KA, Rimm DL, Velcheti V, Madabhushi A. Artificial intelligence in digital pathology - new tools for diagnosis and precision oncology. Nat. Rev. Clin. Oncol. 2019;16:703–715. - PMC - PubMed
    1. Abels E, et al. Computational pathology definitions, best practices, and recommendations for regulatory guidance: a white paper from the Digital Pathology Association. J. Pathol. 2019;249:286–294. - PMC - PubMed
    1. Campanella G, et al. Clinical-grade computational pathology using weakly supervised deep learning on whole slide images. Nat. Med. 2019;25:1301–1309. - PMC - PubMed
    1. Kather JN, et al. Deep learning can predict microsatellite instability directly from histology in gastrointestinal cancer. Nat. Med. 2019;25:1054–1056. - PMC - PubMed
    1. Cheng J, et al. Computational analysis of pathological images enables a better diagnosis of TFE3 Xp11.2 translocation renal cell carcinoma. Nat. Commun. 2020;11:1778. - PMC - PubMed