Review
. 2023 Mar;18(3):929-989.
doi: 10.1038/s41596-022-00754-y. Epub 2023 Jan 27.

Measuring DNA modifications with the comet assay: a compendium of protocols

Andrew Collins #  1 Peter Møller #  2 Goran Gajski #  3 Soňa Vodenková #  4   5 Abdulhadi Abdulwahed  6 Diana Anderson  7 Ezgi Eyluel Bankoglu  8 Stefano Bonassi  9   10 Elisa Boutet-Robinet  11 Gunnar Brunborg  12   13 Christy Chao  14 Marcus S Cooke  15 Carla Costa  16   17   18 Solange Costa  16   17   18 Alok Dhawan  19 Joaquin de Lapuente  20 Cristian Del Bo'  21 Julien Dubus  22 Maria Dusinska  23 Susan J Duthie  24 Naouale El Yamani  23 Bevin Engelward  25 Isabel Gaivão  26 Lisa Giovannelli  27 Roger Godschalk  28 Sofia Guilherme  29 Kristine B Gutzkow  12   13 Khaled Habas  30 Alba Hernández  31 Oscar Herrero  32 Marina Isidori  33 Awadhesh N Jha  34 Siegfried Knasmüller  35 Ingeborg M Kooter  36 Gudrun Koppen  37 Marcin Kruszewski  38   39 Carina Ladeira  40   41 Blanca Laffon  42   43 Marcelo Larramendy  44 Ludovic Le Hégarat  45 Angélique Lewies  46 Anna Lewinska  47 Guillermo E Liwszyc  44 Adela López de Cerain  48   49 Mugimane Manjanatha  50 Ricard Marcos  31 Mirta Milić  3 Vanessa Moraes de Andrade  51 Massimo Moretti  52 Damian Muruzabal  48 Matjaž Novak  53 Rui Oliveira  54 Ann-Karin Olsen  12   13 Norah Owiti  25 Mário Pacheco  29 Alok K Pandey  55 Stefan Pfuhler  56 Bertrand Pourrut  57 Kerstin Reisinger  58 Emilio Rojas  59 Elise Rundén-Pran  23 Julen Sanz-Serrano  48 Sergey Shaposhnikov  60 Ville Sipinen  61 Karen Smeets  62 Helga Stopper  8 João Paulo Teixeira  16   17   18 Vanessa Valdiglesias  43   63 Mahara Valverde  59 Frederique van Acker  64 Frederik-Jan van Schooten  28 Marie Vasquez  65 Johannes F Wentzel  66 Maciej Wnuk  67 Annelies Wouters  62 Bojana Žegura  53 Tomas Zikmund  68   69 Sabine A S Langie  28 Amaya Azqueta  70   71
Affiliations
Review

Measuring DNA modifications with the comet assay: a compendium of protocols

Andrew Collins et al. Nat Protoc. 2023 Mar.

Abstract

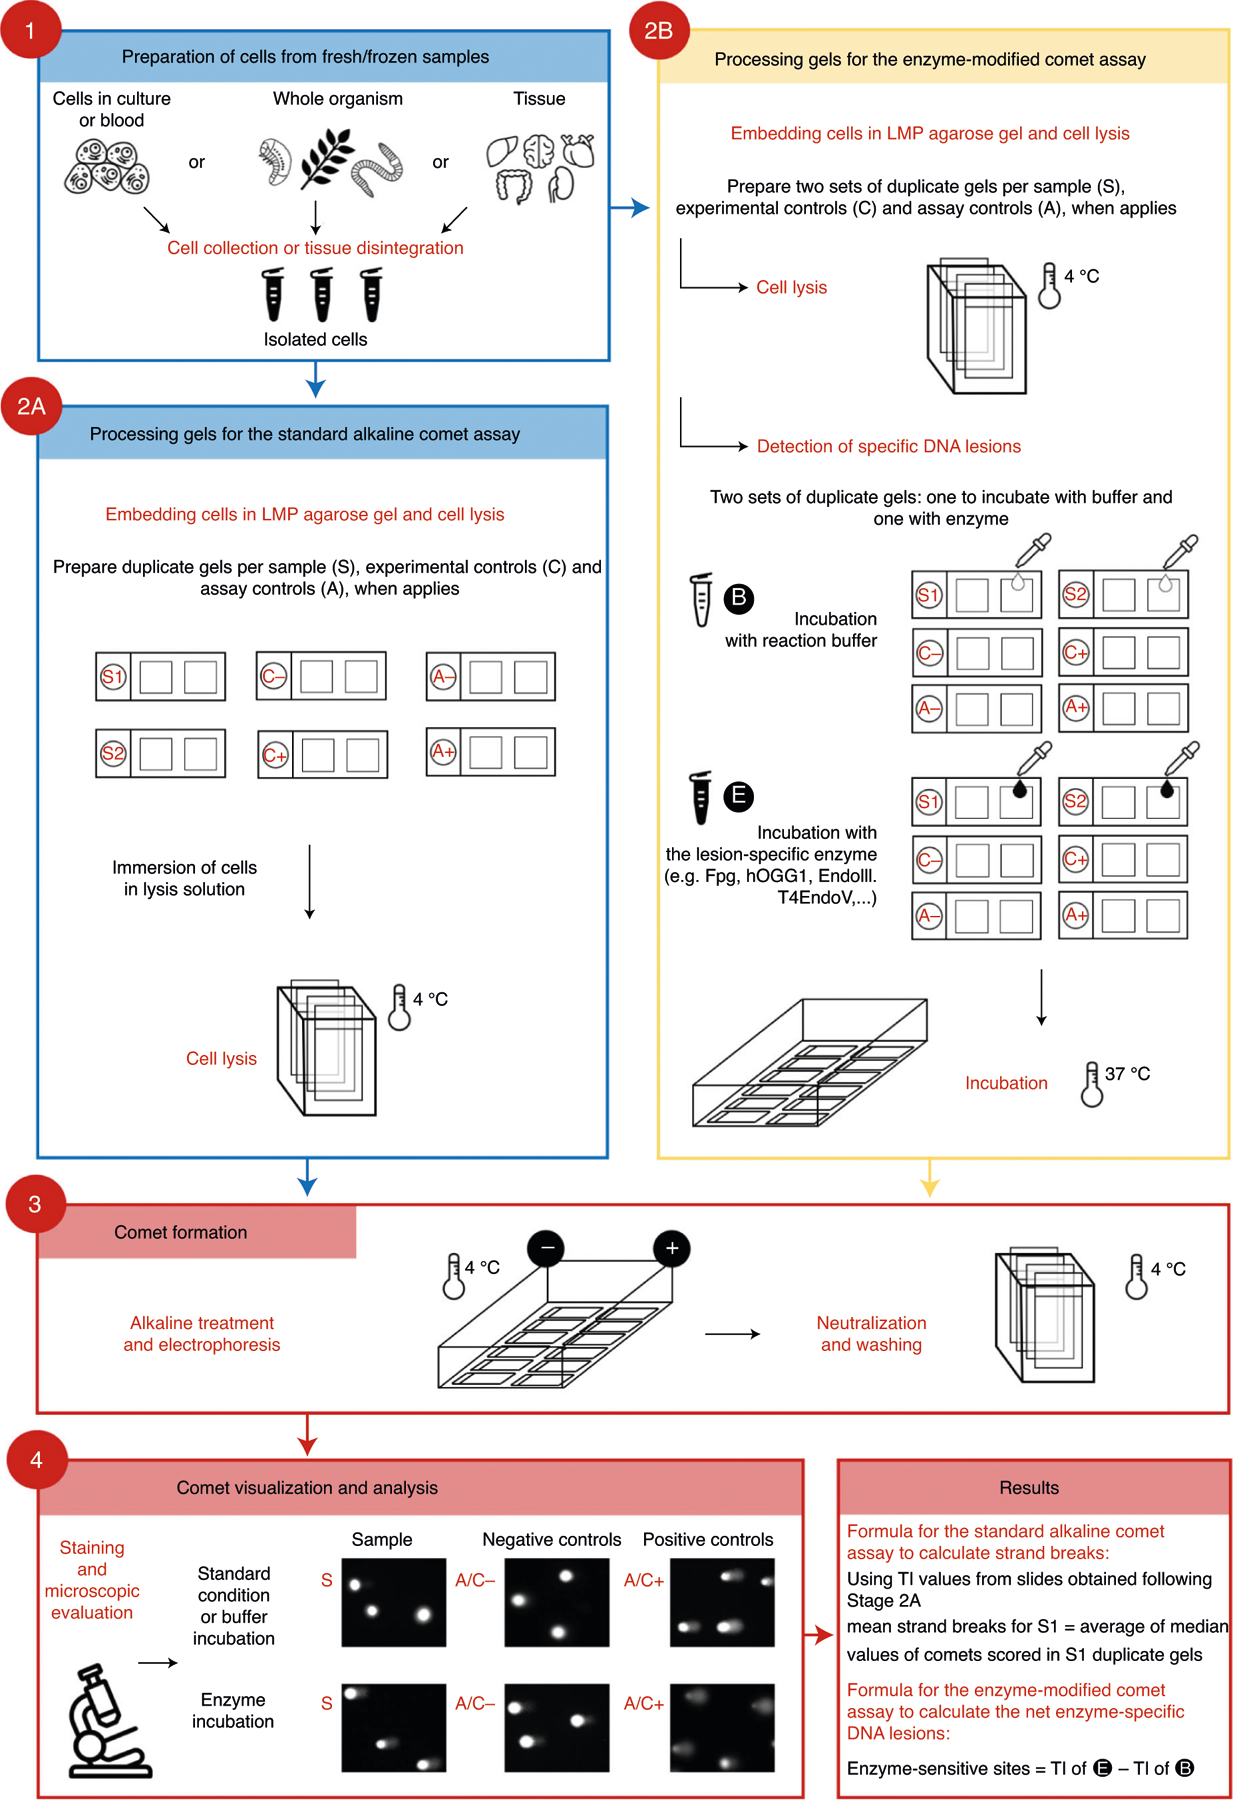
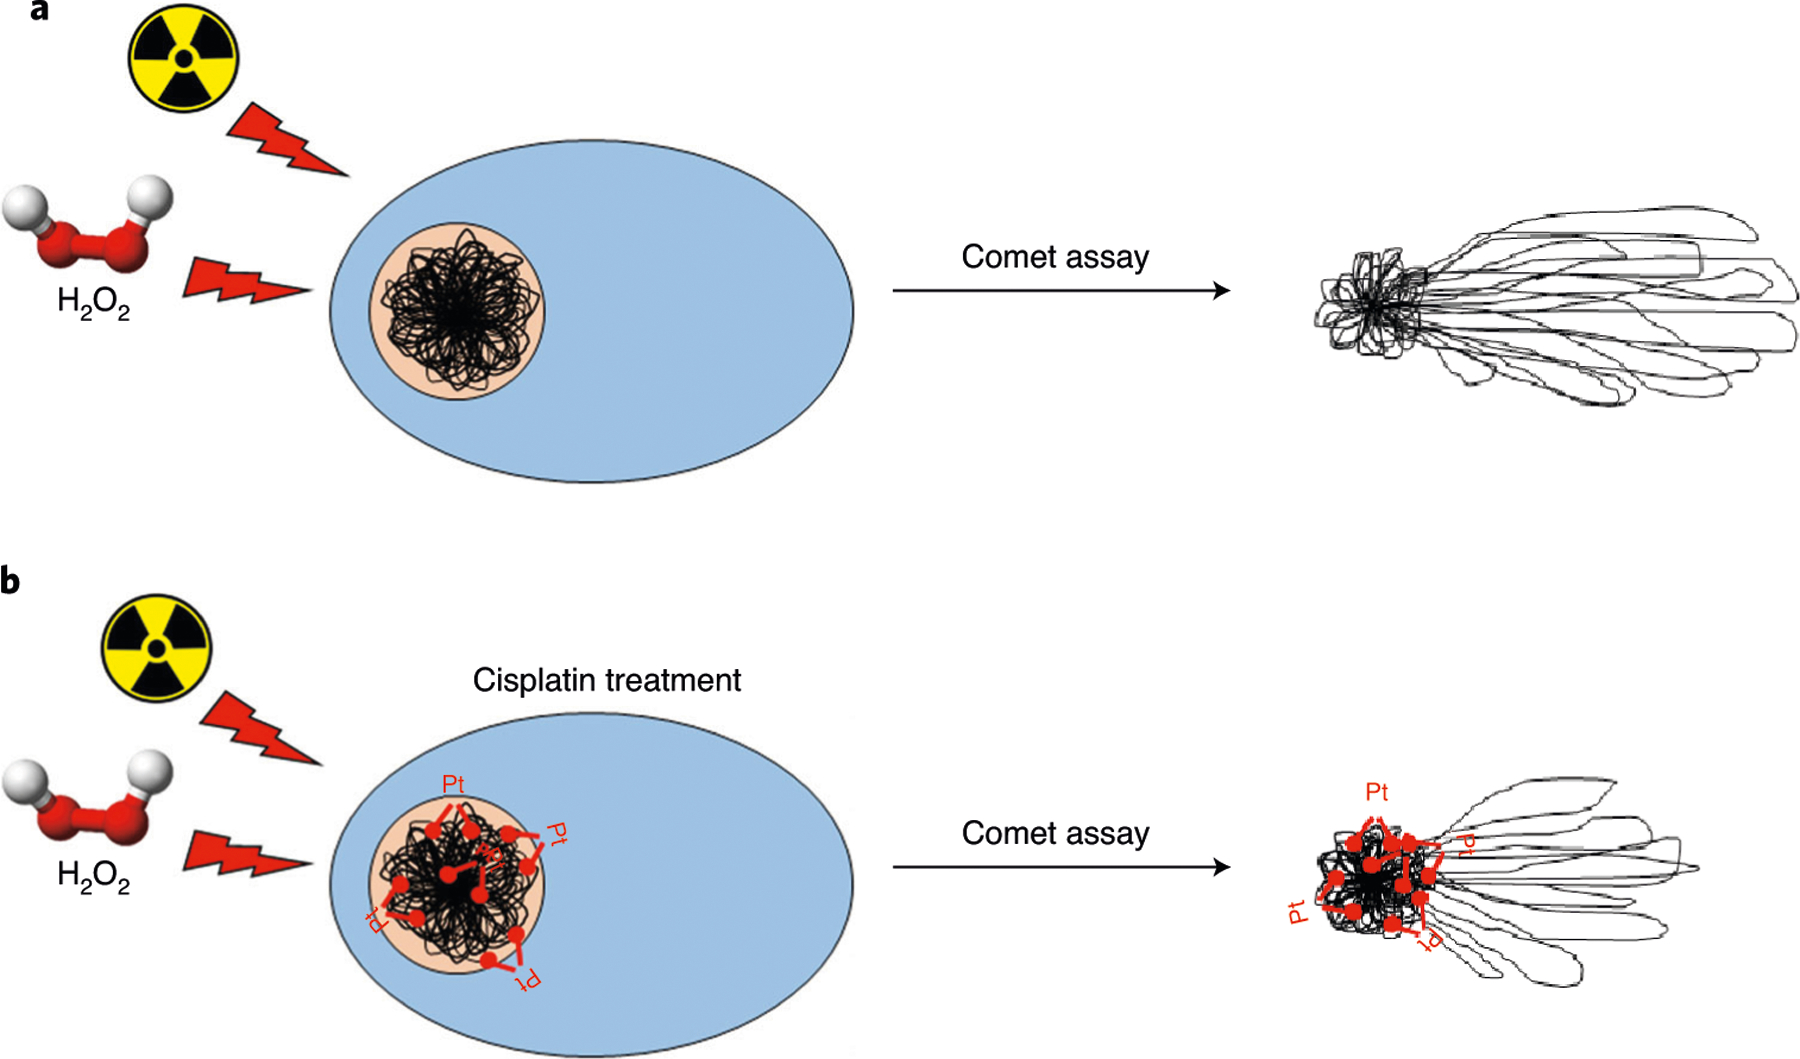
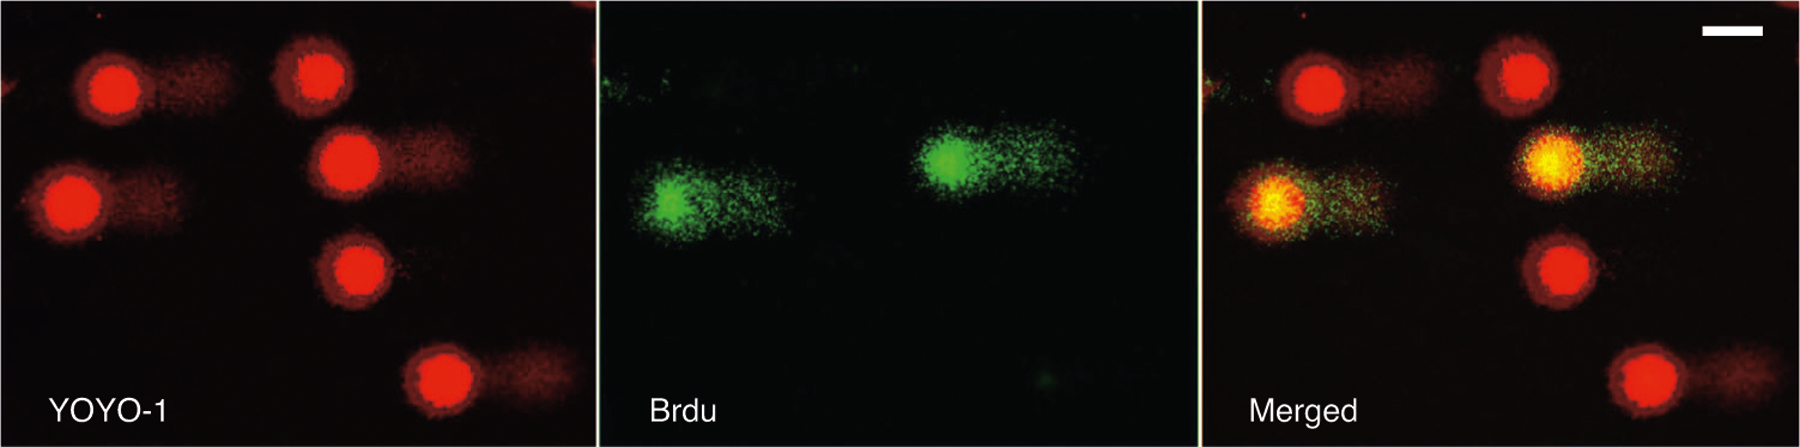
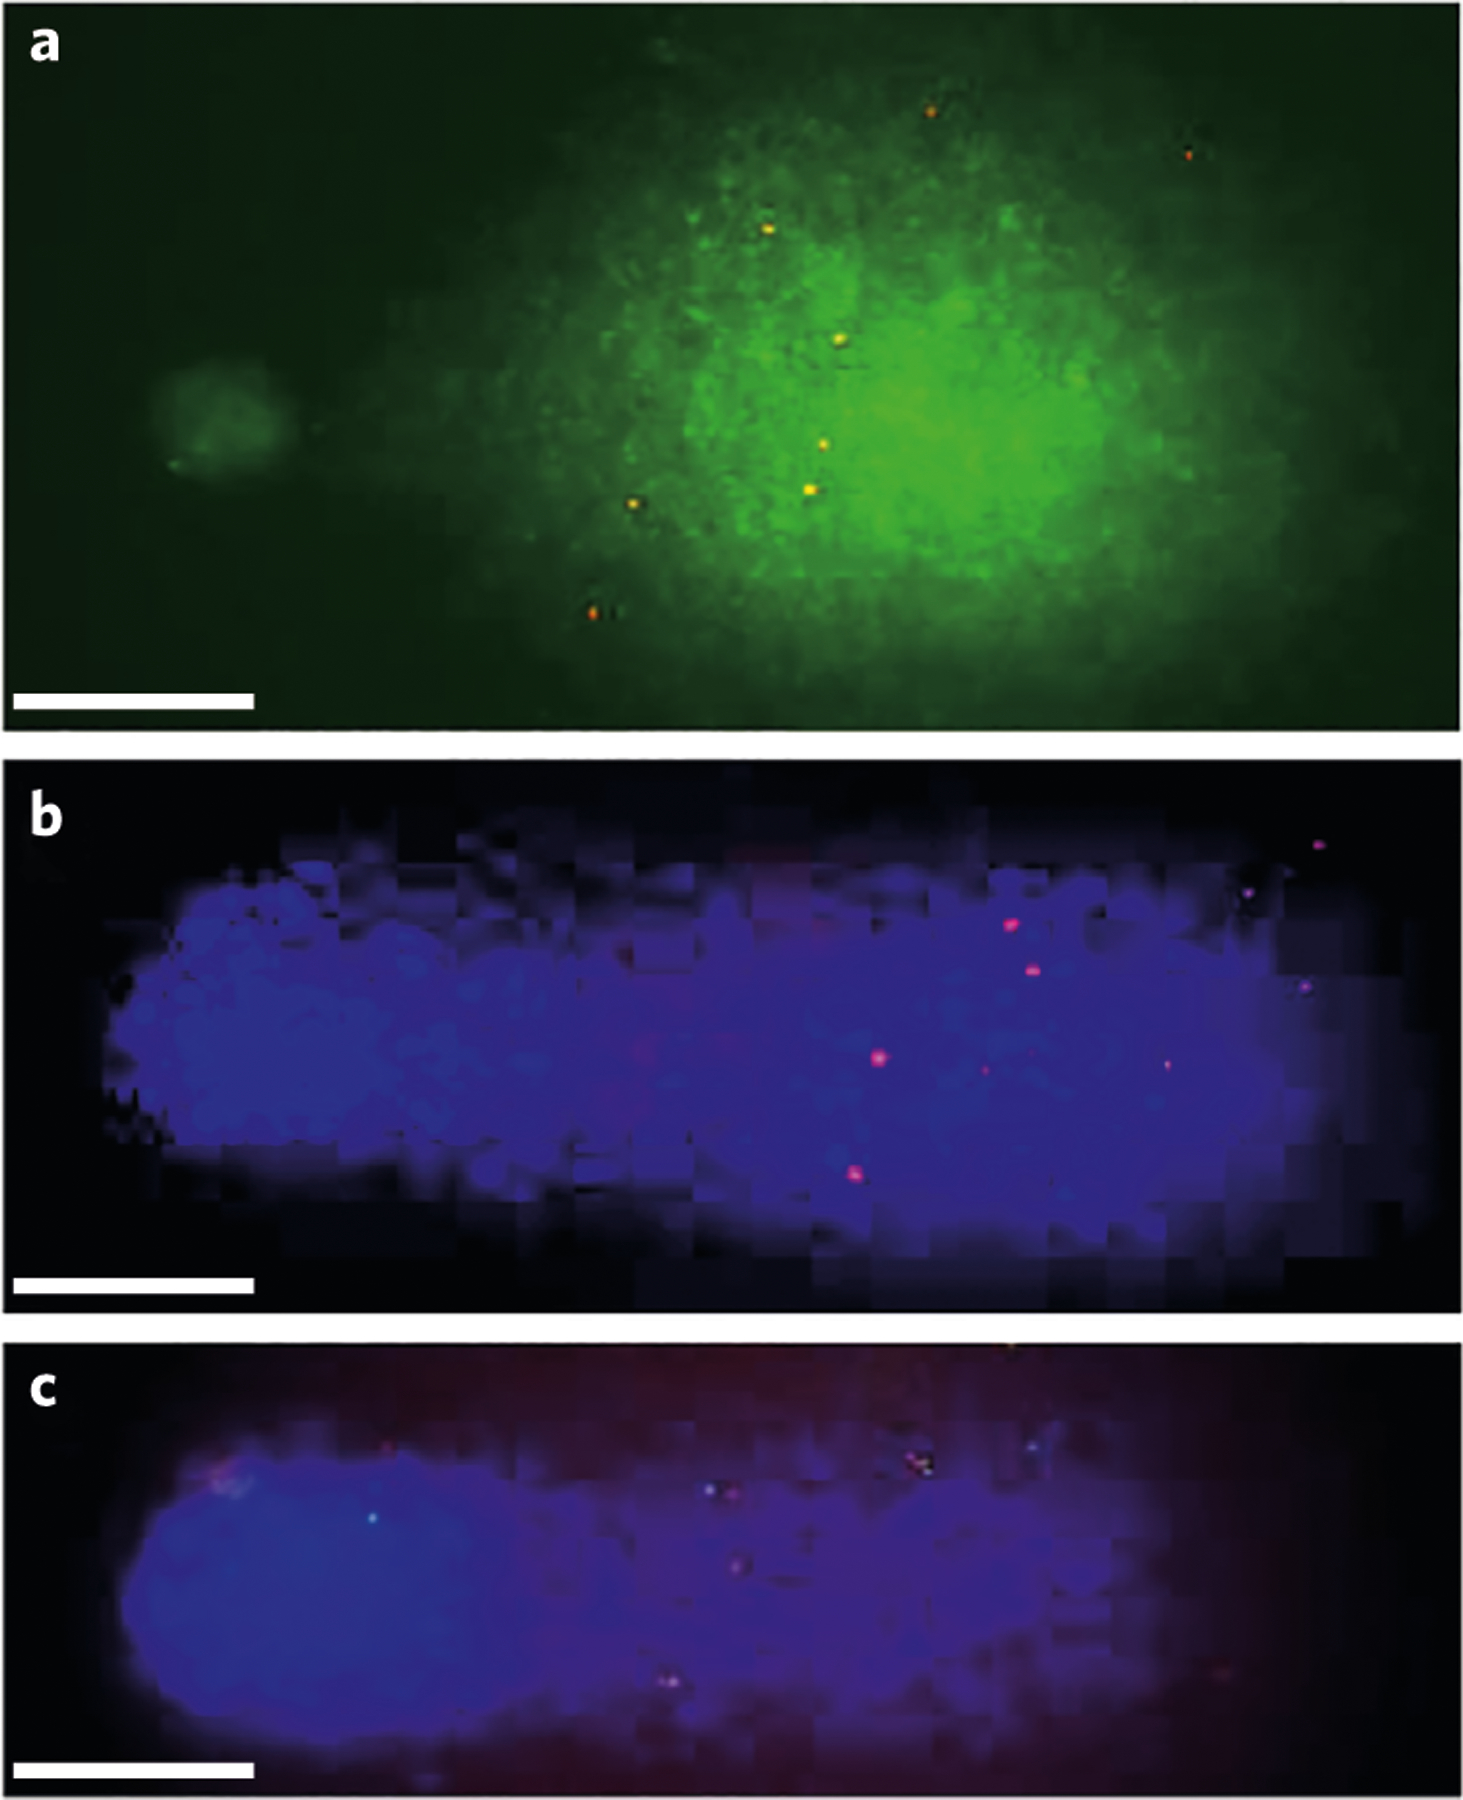
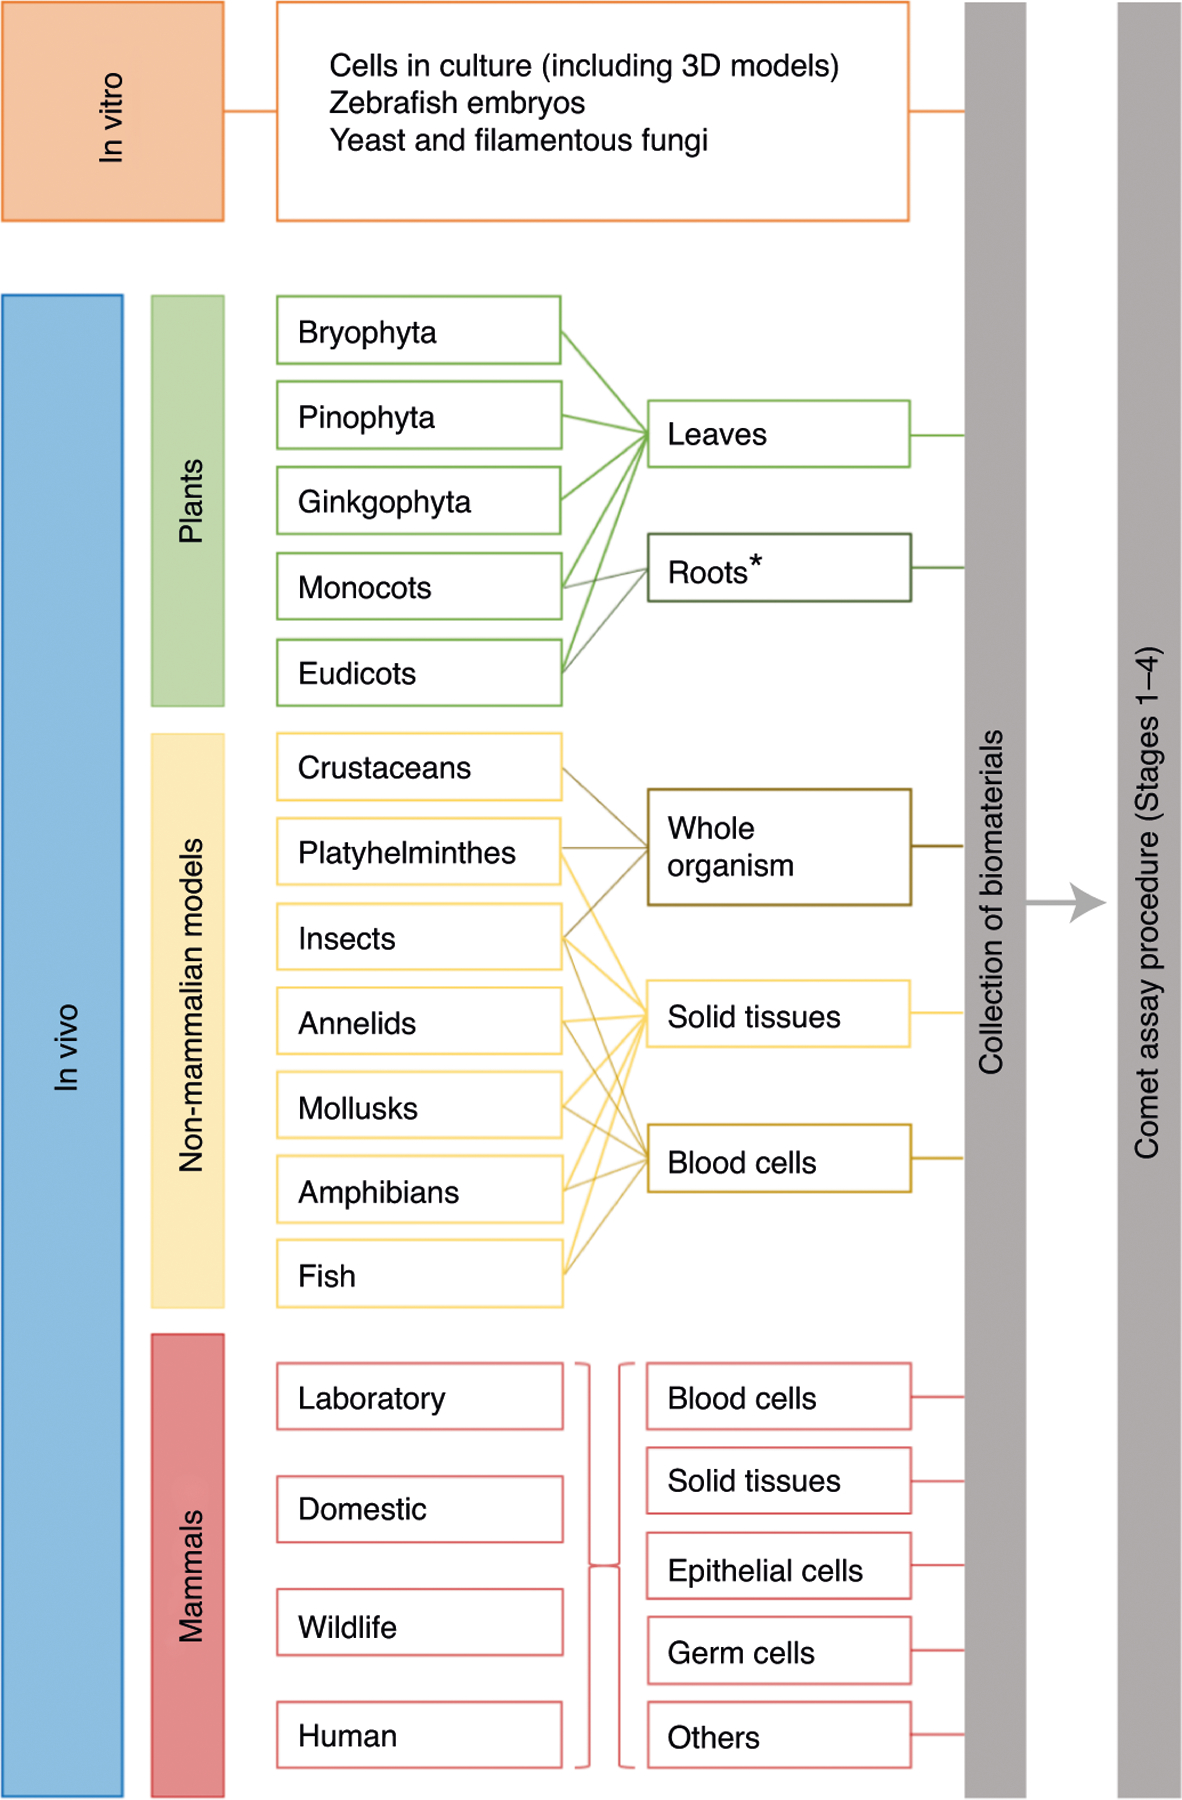
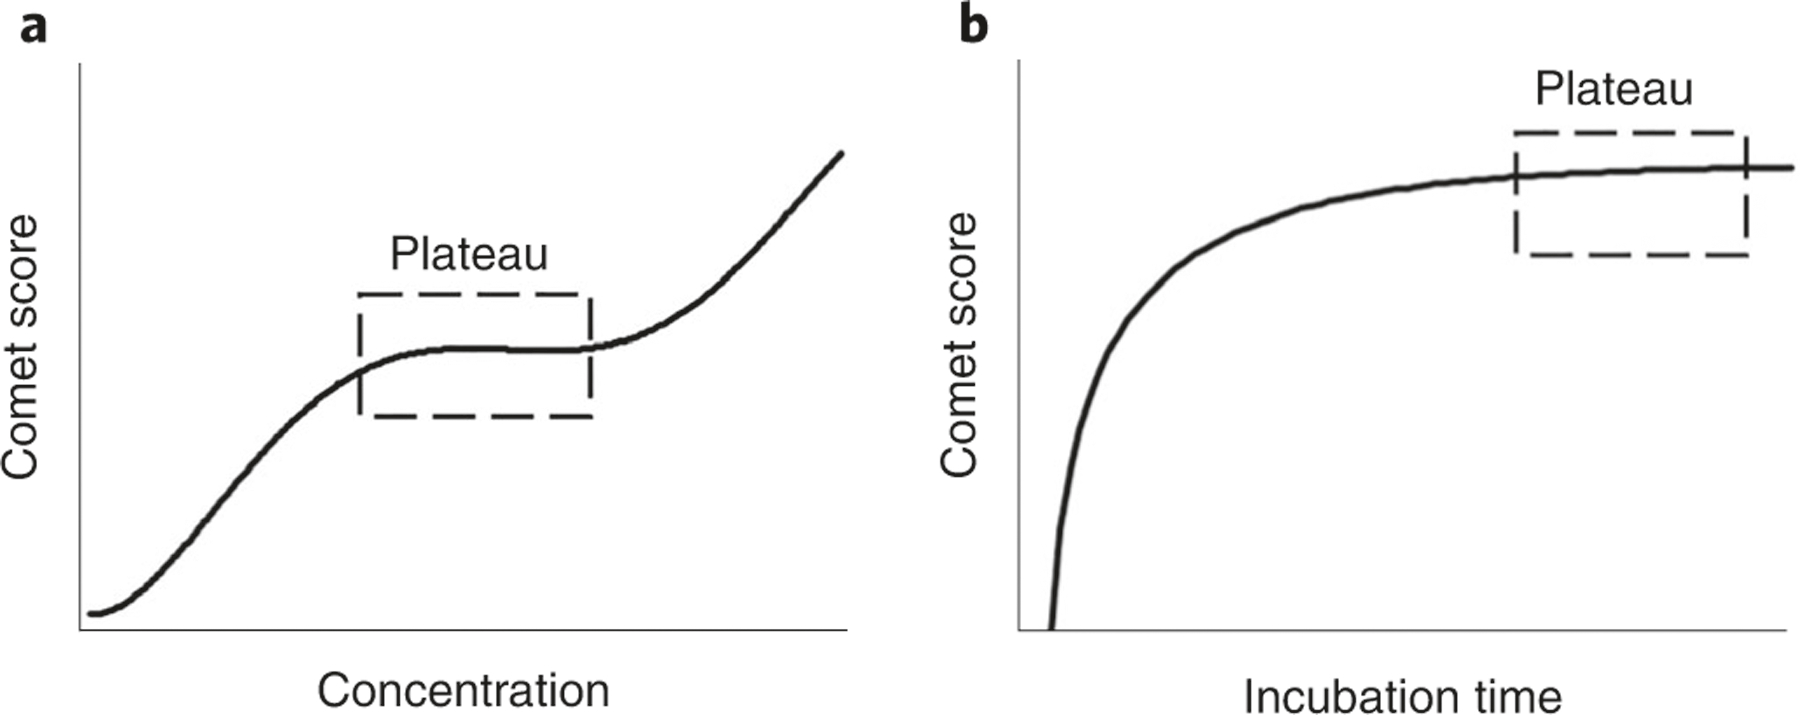
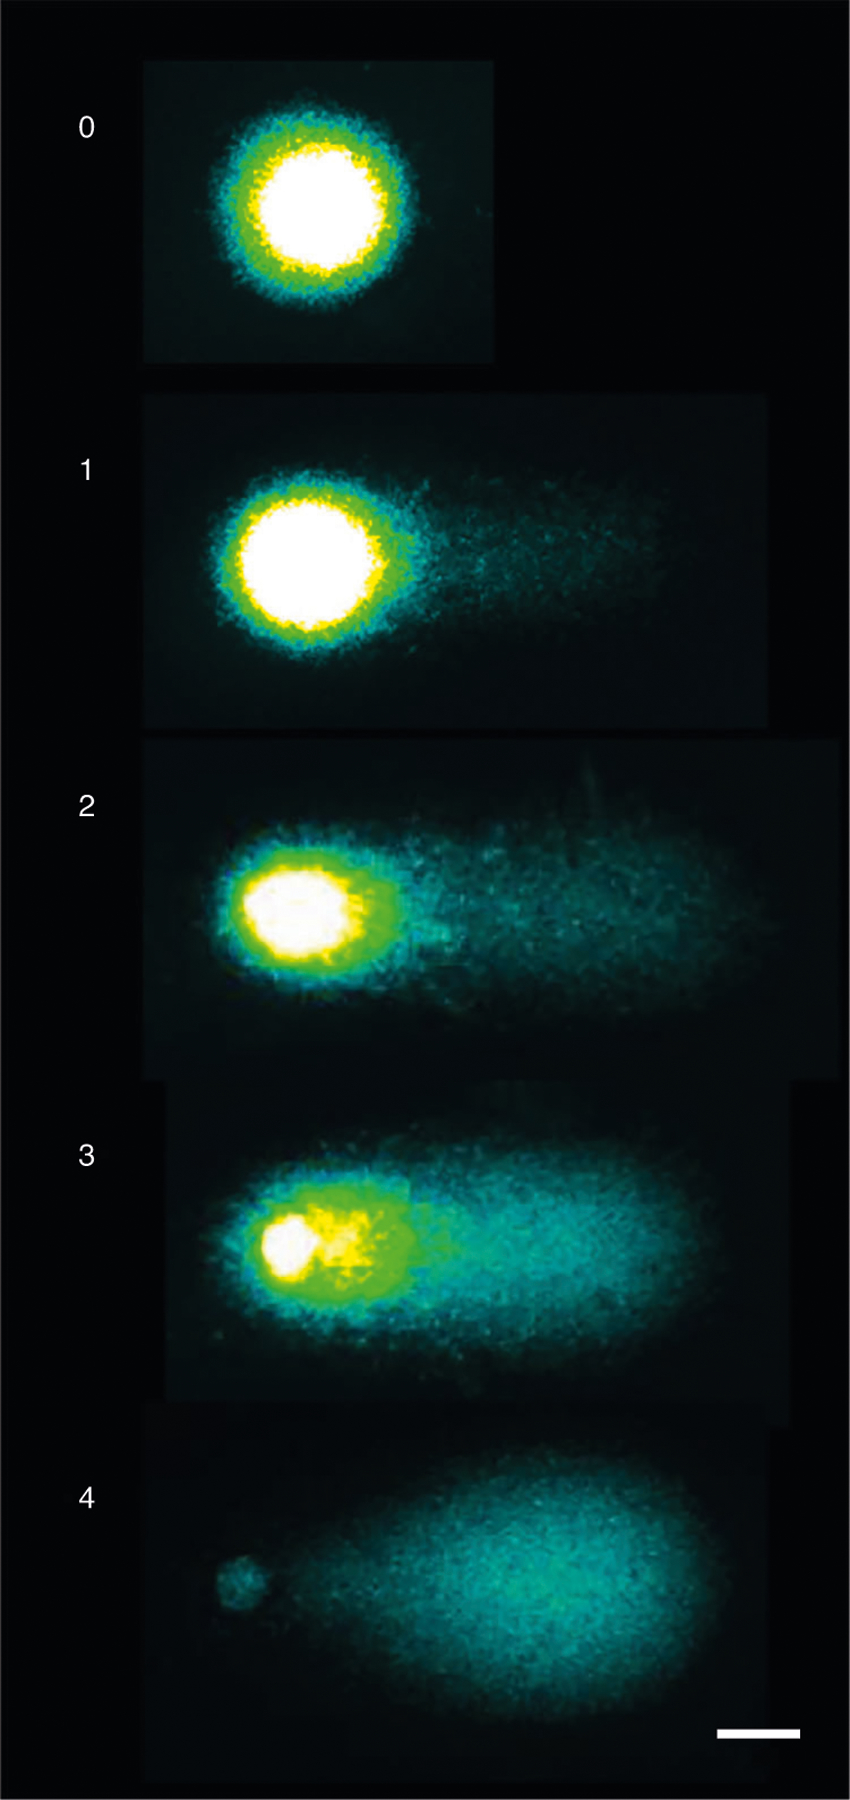
The comet assay is a versatile method to detect nuclear DNA damage in individual eukaryotic cells, from yeast to human. The types of damage detected encompass DNA strand breaks and alkali-labile sites (e.g., apurinic/apyrimidinic sites), alkylated and oxidized nucleobases, DNA-DNA crosslinks, UV-induced cyclobutane pyrimidine dimers and some chemically induced DNA adducts. Depending on the specimen type, there are important modifications to the comet assay protocol to avoid the formation of additional DNA damage during the processing of samples and to ensure sufficient sensitivity to detect differences in damage levels between sample groups. Various applications of the comet assay have been validated by research groups in academia, industry and regulatory agencies, and its strengths are highlighted by the adoption of the comet assay as an in vivo test for genotoxicity in animal organs by the Organisation for Economic Co-operation and Development. The present document includes a series of consensus protocols that describe the application of the comet assay to a wide variety of cell types, species and types of DNA damage, thereby demonstrating its versatility.


Conflict of interest statement

Competing interests

The authors declare no competing interests.

Figures

Fig. 1 |
Fig. 1 |. Overview of the standard and the enzyme-modified comet assay protocols.
Stage 1 involves the isolation of single cells, which are processed in either the standard (Stage 2A) or enzyme-modified (Stage 2B) comet assay. In the second stage of the standard comet assay, nucleoids are embedded in agarose and lysed. The enzyme-modified comet assay contains an additional step where the nucleoids are incubated with DNA repair enzymes such as formamidopyrimidine DNA glycosylase (Fpg), human 8-oxoguanine DNA glycosylase 1 (hOGG1), endonuclease III (EndoIII), or T4 endonuclease V (T4endoV). Stage 3 entails a DNA unwinding step, electrophoresis and subsequent neutralization of the slides. Stage 4 is the visualization and microscopic evaluation of comets in the samples (S) as well as negative (A/C−) and positive (A/C+) assay controls. Finally, the results are expressed as, e.g., tail intensity (TI) for DNA SBs, or in the case of enzyme-sensitive sites as net TI by subtracting TI for the buffer-treated slides from TI for the enzyme-treated slides.
Fig. 2 |
Fig. 2 |. A schematic representation of interstrand crosslinks (ICLs) formation by cisplatin and detection with a variant of the alkaline comet assay.
a, In the absence of cisplatin treatment, relaxed DNA loops migrate towards the anode forming the comet tail. b, In the presence of cisplatin, and with exposure to a strand-breaking agent such as ionizing radiation or H2O2, migration of the DNA is inhibited by the ICLs—the more ICLs, the less the migration of the DNA.
Fig. 3 |
Fig. 3 |. Representative images of three comets illustrating interstrand crosslinks (ICLs) detection following cisplatin treatment.
a–c, Cells from an ovarian cancer cell line (SKOV-3) were first treated with 0 µM or 200 µM cisplatin. SBs were then induced using H2O2 (50 µM). The presence of cisplatin-induced crosslinks resulted in a decrease in tail moment (TM) after DNA damage induced by H2O2 (50 µM), compared with the H2O2 treatment control, in the absence of cisplatin. Control cells without any treatment (a); cells treated with H2O2 (50 µM) only (b); cells treated with cisplatin (200 µM) and subsequently H2O2 (50 µM) (c). Scale bar, 10 µm.
Fig. 4 |
Fig. 4 |. Component parts of the 12-gel chamber unit.
a, Top view, showing metal base with marks for positioning gels on slide, silicone rubber gasket, plastic top-plate with wells, and silicone rubber seal. b, Assembled unit.
Fig. 5 |
Fig. 5 |. Images illustrating the 96-gel format using GelBond film.
Figure reprinted with permission from ref. , Oxford University Press.
Fig. 6 |
Fig. 6 |. The CometChip platform.
a, Cells in medium or PBS are loaded by gravity into a microwell array in agarose that was created using a mold with pegs approximately the diameter of a single cell,. Excess cells are removed by shear force, leaving behind an array of cells. Cells are retained with a layer of LMP agarose (not shown). b, An agarose slab with thousands of microwells is created with the dimensions of a 96-well plate. A bottomless 96-well plate is pressed into the agarose, creating 96 compartments, each with >100 microwells. After cell loading, rinsing, capping and treatment, the agarose slab is processed using standard comet assay protocol conditions. Cells can be either pretreated or treated on-chip. Each of the 96 wells substitutes for a single glass slide used in the traditional comet assay. c, For the EpiCometChip (see ‘Detection of global DNA methylation’), immediately after lysis, the agarose slab is rinsed and incubated with McrBC before processing using standard comet analysis conditions. C, nonmethylated cytosine; 5MeC, 5-methylcytosine. Panels b and c adapted with permission from ref. , Wiley.
Fig. 7 |
Fig. 7 |. The vertical comet system.
a, Racks hold slides vertically (up to 25 slides per rack). b, Treatment chambers that accommodate the slide-containing racks. c, High-throughput electrophoresis tank (possesses integrated cooling, so no wet ice needed) holding two racks. d, Standard comet assay tank in tray of wet ice; the improvement in size of the high-throughput tank (c) over the standard comet assay tank is clearly seen.
Fig. 8 |
Fig. 8 |. Principle of the DNA methylation-sensitive comet assay.
This assay uses two isoschizomeric restriction enzymes that recognize the same tetranucleotide sequence (5′-CCGG -3′), but display different sensitivities to DNA methylation; HpaII is inhibited by the presence of a methyl group on the second cytosine in the recognition sequence (it is able to recognize unmethylated sequences), while MspI is able to cut both methylated and unmethylated sequences. The global methylation can be assessed by calculating the HpaII/MspI ratio. Scale bars, 10 μm.
Fig. 9 |
Fig. 9 |. Visualization of all comets and BrdU-positive comets only by fluorescence microscopy, using two filters.
With the FITC filter (left), comets stained with YOYO-1 for detection of DNA breaks are visualized. With the TRITC filter (middle), BrdU-positive comets formed by cells in the S phase of the cell cycle are visualized. The image on the right shows both BrdU-positive and BrdU-negative comets. Scale bar, 40 μm.
Fig. 10 |
Fig. 10 |. Example pictures of different types of signals seen in comet–FISH experiments after alkaline electrophoresis using U-2 OS cells.
a, Probe RPCI-1 213H19 labeled with two colors (digoxigenin as green dots and biotin as red dots), in comets from cells irradiated with UVC at 0.2 Jm−2. b, Probe RPCI1 213H19 labeled with biotin (red dots), in comets from cells treated with 0.1 mM H2O2. c, Probes RPCI-1 213H19 and RPCI-6 32H24 labeled with digoxigenin (green) and biotin (red), respectively, in comets from cells irradiated with UVC at 0.2 Jm−2. Scale bars, 20 μm. Figure adapted with permission from ref. , Wiley.
Fig. 11 |
Fig. 11 |. Overview of various species and different sample types that have been used in the comet assay.
Preparation of cells from different sample types is described in Stage 1 of the Procedure. *So far, only roots from monocots and eudicots have been used for the comet assay, but there is no reason why roots from other plants could not be used as well.
Fig. 12 |
Fig. 12 |. Titration steps in the enzyme-modified comet assay.
a, The graph illustrates the titration curve that is usually obtained when the optimal concentration of enzymes is found. Cells with a known level of DNA damage (e.g., potassium-bromate-treated cells) are incubated with different dilutions of the enzyme for a specific period (e.g., 30 min). The plateau represents a range of concentrations over which the enzyme has excised all available lesions (i.e., specific incisions), and the subsequent increase in comet score is attributed to nonspecific incisions. b, The graph illustrates the time curve from a comet assay experiment, where the optimal incubation time is selected to be on the plateau where all lesions are recognized by the enzyme.
Fig. 13 |
Fig. 13 |. Representative images of comets classified in five different classes for visual scoring.
0 (no tail), 1, 2, 3 and 4 (almost all DNA in tail; sometimes described as a hedgehog). The colorectal cancer cell line HCT116 was used to obtain the images. Scale bar, 20 μm.
Fig. 14 |
Fig. 14 |. Detection of DNA crosslinks in a theoretical cell culture study.
Experiments are first carried out to find a suitable level of DNA SBs, using an agent that directly causes breaks in DNA such as H2O2 or ionizing radiation (left). Subsequently, experiments are done where cells are exposed to the test agent (compound) and ionizing radiation. The presence of crosslinks in DNA is concluded if the irradiated samples plus the tested compound have less DNA migration as compared with the irradiated samples without the tested compounds (black bars compared with gray bars).
Fig. 15 |
Fig. 15 |. Assessment of DNA lesions by inhibition of late-stage excision repair processes in a theoretical cell culture study.
The cells are incubated with the test agent (compound, C) and inhibitor (I) (red letter in the left graph refers to the presence of compound or inhibitor; in case of incubations with I/C-red and I/C the lines overlap). The data included in the dashed box are represented in the bar graph on the right. The effect of DNA repair on the determination of genotoxicity is inferred by the higher level of DNA migration in samples that have been exposed to both the compound and repair inhibitors (right).
Fig. 16 |
Fig. 16 |. Examples of data output of the enzyme-modified comet assay in theoretical samples.
Samples 1 and 2 exemplify two different samples where the levels of DNA SBs differ, whereas the levels of enzyme-sensitive sites are identical. The total level of DNA damage (i.e., ‘enzyme’ treatment) is higher in sample 2 than in sample 1, but interpreting that as a higher level of DNA damage in the enzyme-modified comet assay is misleading. Samples 3 and 4 exemplify two different samples that have few enzyme-sensitive sites, but low or high levels of DNA SBs, respectively. In these samples, the DNA damage level measured by the ‘buffer’ and ‘enzyme’ treatments is identical. Negative values of enzyme-sensitive sites will occur in some samples because of experimental variation in the scoring of comet assay slides. Sample 3 represents a situation with a valid measurement of few enzyme-sensitive sites because the level of total DNA damage is relatively low (i.e., close to 10% tail DNA). In sample 4, the level of DNA SBs is so high that the comet assay is saturated (i.e., DNA migration is close to 100% tail DNA). Therefore, it is not possible for the enzyme treatment to increase the DNA migration, and so enzyme-sensitive levels are underestimated.
Fig. 17 |
Fig. 17 |. Levels of DNA migration in assay control samples from a biomonitoring study, encompassing 11 d of comet assay experiments.
PBMCs were exposed to 1 µM Ro-19–8022 and irradiated for 4 min with white light, and subsequently cryopreserved. The DNA migration is depicted as lesions per 106 bp in samples treated with buffer (i.e., DNA SBs), formamidopyrimidine glycosylase (Fpg) or human oxoguanine DNA glycosylase (hOGG1). Figure adapted with permission from ref. , Elsevier.
Fig. 18 |
Fig. 18 |. Example results from a study of Fpg-sensitive sites after exposure to diesel exhaust particles in cultured human HepG2 cells.
Filled circles and whiskers are mean value and standard deviation, respectively, of six experiments (numbers in brackets are standard deviation). The concentration of diesel exhaust particles is shown on the x axis. Figure adapted with permission from ref. , Elsevier.

Similar articles

Cited by

References

    1. Olive P, Banáth J & Durand R Heterogeneity in radiation-induced DNA damage and repair in tumor and normal cells measured using the ‘comet’ assay. Radiat. Res 122, 86–94 (1990). - PubMed
    1. Neri M et al. Worldwide interest in the comet assay: a bibliometric study. Mutagenesis 30, 155–163 (2015). - PubMed
    1. de Lapuente J et al. The comet assay and its applications in the field of ecotoxicology: a mature tool that continues to expand its perspectives. Front. Genet 6, 180 (2015). - PMC - PubMed
    1. Gajski G et al. The comet assay in animal models: from bugs to whales—(Part 1 Invertebrates). Mutat. Res. Rev. Mutat. Res 779, 82–113 (2019). - PubMed
    1. Gajski G et al. The comet assay in animal models: from bugs to whales—(Part 2 Vertebrates). Mutat. Res. Rev. Mutat. Res 781, 130–164 (2019). - PubMed

Publication types

LinkOut - more resources