

In vitro gut microbiome response to carbohydrate supplementation is acutely affected by a sudden change in diet
- PMID: 36707764
- PMCID: PMC9883884
- DOI: 10.1186/s12866-023-02776-2
In vitro gut microbiome response to carbohydrate supplementation is acutely affected by a sudden change in diet
Abstract
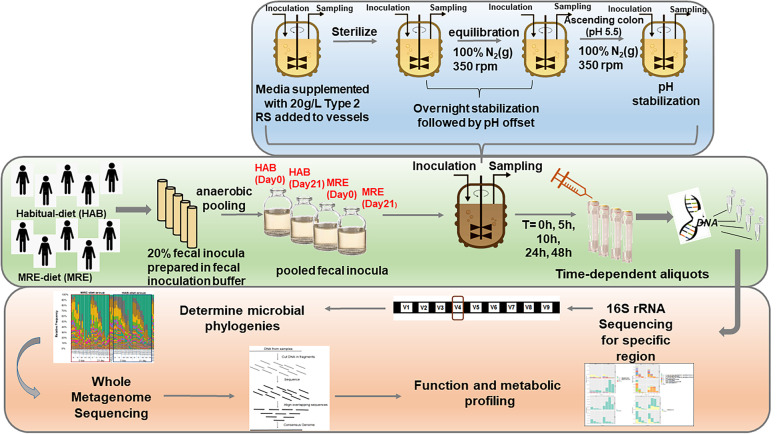
Background: Interactions between diet, stress and the gut microbiome are of interest as a means to modulate health and performance. Here, in vitro fermentation was used to explore the effects of a sudden change in diet, 21 days sole sustenance on the Meal, Ready-to-Eat (MRE) U.S. military combat ration, on inter-species competition and functional potential of the human gut microbiota. Human fecal samples collected before and after MRE intervention or consuming a habitual diet (HAB) were introduced to nutrient-rich media supplemented with starch for in vitro fermentation under ascending colon conditions. 16S rRNA amplicon and Whole-metagenome sequencing (WMS) were used to measure community composition and functional potential. Specific statistical analyses were implemented to detect changes in relative abundance from taxa, genes and pathways.
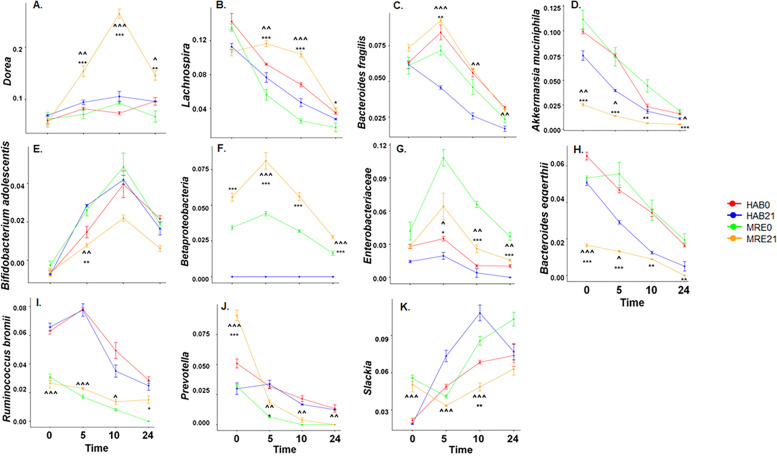
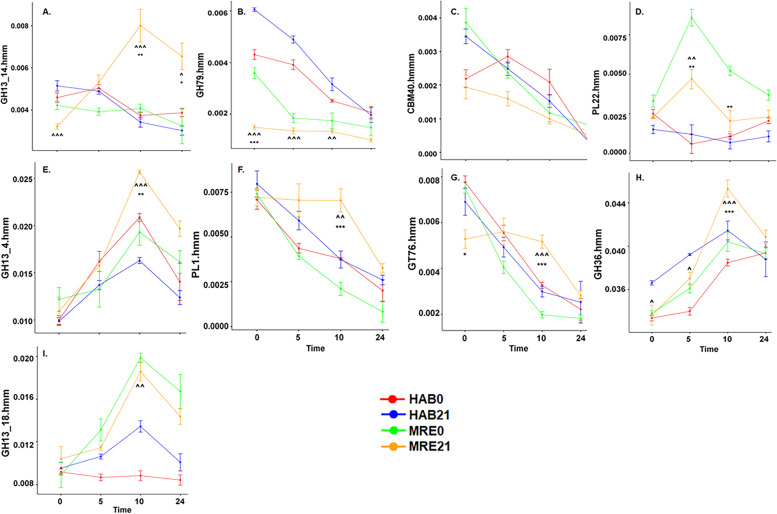
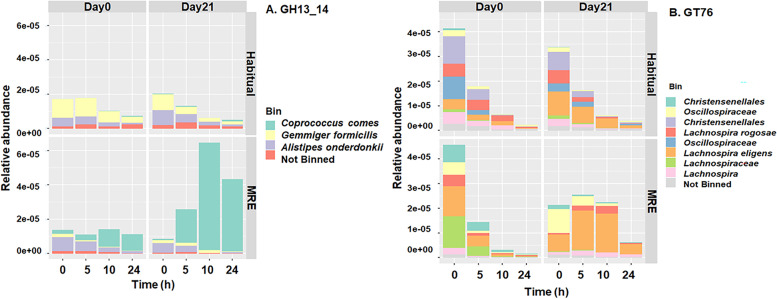
Results: Differential changes in relative abundance of 11 taxa, Dorea, Lachnospira, Bacteroides fragilis, Akkermansia muciniphila, Bifidobacterium adolescentis, Betaproteobacteria, Enterobacteriaceae, Bacteroides egerthii, Ruminococcus bromii, Prevotella, and Slackia, and nine Carbohydrate-Active Enzymes, specifically GH13_14, over the 24 h fermentation were observed as a function of the diet intervention and correlated to specific taxa of interest.
Conclusions: These findings suggest that consuming MRE for 21 days acutely effects changes in gut microbiota structure in response to carbohydrate but may induce alterations in metabolic capacity. Additionally, these findings demonstrate the potential of starch as a candidate supplemental strategy to functionally modulate specific gut commensals during stress-induced states.
Trial registration: ClinicalTrials.gov NCT02423551.
Keywords: Carbohydrate metabolism; Carbohydrate-active enzymes; Gut microbiome; Gut microbiota; In vitro fermentation; Meal Ready-to-Eat (MRE); Metabolic competition; Microbial ecology; Microbial functional potential; Next generation sequencing.
© 2023. This is a U.S. Government work and not under copyright protection in the US; foreign copyright protection may apply.
Conflict of interest statement
The authors declare that they have no competing interests.
Figures
Similar articles
-
Acute stressor alters inter-species microbial competition for resistant starch-supplemented medium.Gut Microbes. 2019;10(4):439-446. doi: 10.1080/19490976.2018.1554962. Epub 2018 Dec 22. Gut Microbes. 2019. PMID: 31309868 Free PMC article. Clinical Trial.
-
A diet of U.S. military food rations alters gut microbiota composition and does not increase intestinal permeability.J Nutr Biochem. 2019 Oct;72:108217. doi: 10.1016/j.jnutbio.2019.108217. Epub 2019 Jul 30. J Nutr Biochem. 2019. PMID: 31473505 Clinical Trial.
-
Resistant Starch Alters the Microbiota-Gut Brain Axis: Implications for Dietary Modulation of Behavior.PLoS One. 2016 Jan 8;11(1):e0146406. doi: 10.1371/journal.pone.0146406. eCollection 2016. PLoS One. 2016. PMID: 26745269 Free PMC article.
-
Conserved and variable responses of the gut microbiome to resistant starch type 2.Nutr Res. 2020 May;77:12-28. doi: 10.1016/j.nutres.2020.02.009. Epub 2020 Feb 22. Nutr Res. 2020. PMID: 32251948 Free PMC article. Review.
-
Diet, nutrients and the microbiome.Prog Mol Biol Transl Sci. 2020;171:237-263. doi: 10.1016/bs.pmbts.2020.04.006. Epub 2020 Apr 25. Prog Mol Biol Transl Sci. 2020. PMID: 32475524 Review.
Cited by
-
Unveiling the gut-eye axis: how microbial metabolites influence ocular health and disease.Front Med (Lausanne). 2024 May 10;11:1377186. doi: 10.3389/fmed.2024.1377186. eCollection 2024. Front Med (Lausanne). 2024. PMID: 38799150 Free PMC article. Review.
-
In Vitro Fermentation Shows Polyphenol and Fiber Blends Have an Additive Beneficial Effect on Gut Microbiota States.Nutrients. 2024 Apr 13;16(8):1159. doi: 10.3390/nu16081159. Nutrients. 2024. PMID: 38674850 Free PMC article.
-
The single degree of polymerization influences the efficacy of xylooligosaccharides in shaping microbial and metabolite profiles in chicken gut to combat avian pathogenic Escherichia coli.BMC Microbiol. 2025 Apr 22;25(1):227. doi: 10.1186/s12866-025-03948-y. BMC Microbiol. 2025. PMID: 40264018 Free PMC article.
-
Meeting report of the seventh annual Tri-Service Microbiome Consortium Symposium.BMC Proc. 2024 Nov 7;18(Suppl 20):25. doi: 10.1186/s12919-024-00307-z. BMC Proc. 2024. PMID: 39506745 Free PMC article.
References
Publication types
MeSH terms
Substances
Associated data
LinkOut - more resources
Full Text Sources
Medical
