. 2023 Jan 28;15(1):23.
doi: 10.1186/s13195-023-01175-z.

Altered dynamics of glymphatic flow in a mature-onset Tet-off APP mouse model of amyloidosis

Affiliations

Altered dynamics of glymphatic flow in a mature-onset Tet-off APP mouse model of amyloidosis

Inès R H Ben-Nejma et al. Alzheimers Res Ther. .

Abstract

Background: Alzheimer's disease (AD) is an incurable neurodegenerative disorder characterised by the progressive buildup of toxic amyloid-beta (Aβ) and tau protein aggregates eventually leading to cognitive decline. Recent lines of evidence suggest that an impairment of the glymphatic system (GS), a brain waste clearance pathway, plays a key role in the pathology of AD. Moreover, a relationship between GS function and neuronal network integrity has been strongly implicated. Here, we sought to assess the efficacy of the GS in a transgenic Tet-Off APP mouse model of amyloidosis, in which the expression of mutant APP was delayed until maturity, mimicking features of late-onset AD-the most common form of dementia in humans.

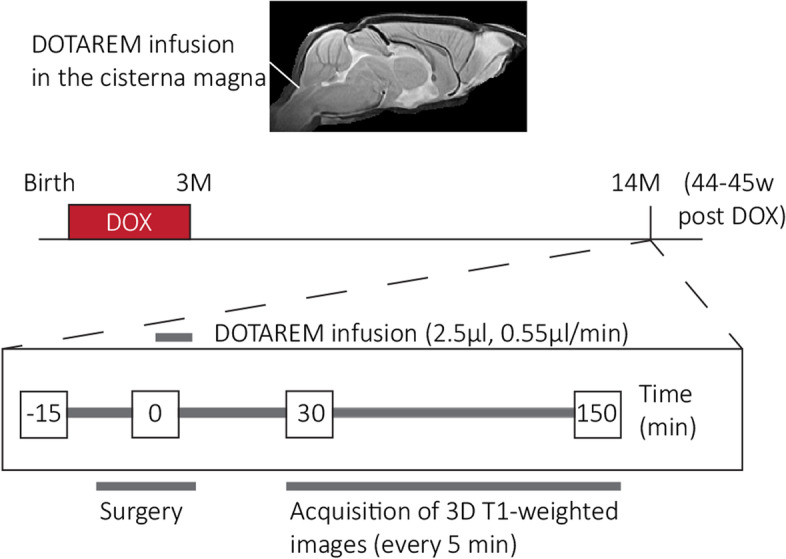
Methods: To evaluate GS function, we used dynamic contrast-enhanced MRI (DCE-MRI) in 14-month-old Tet-Off APP (AD) mice and aged-matched littermate controls. Brain-wide transport of the Gd-DOTA contrast agent was monitored over time after cisterna magna injection. Region-of-interest analysis and computational modelling were used to assess GS dynamics while characterisation of brain tissue abnormalities at the microscale was performed ex vivo by immunohistochemistry.

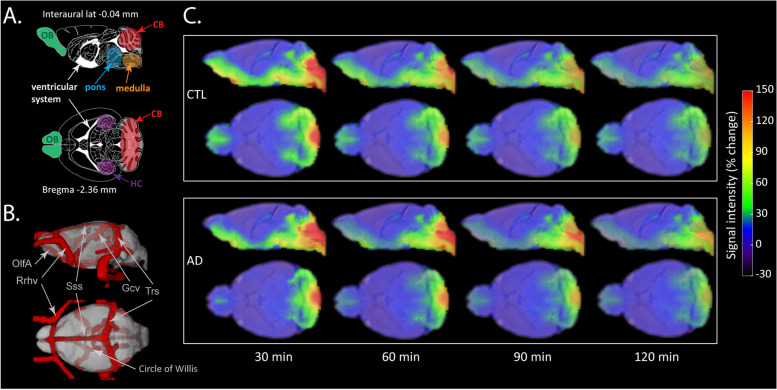
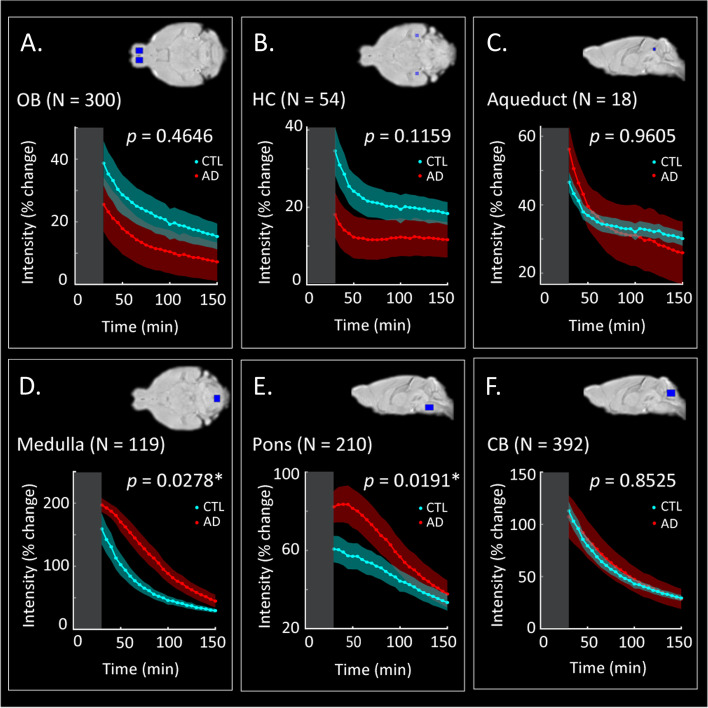
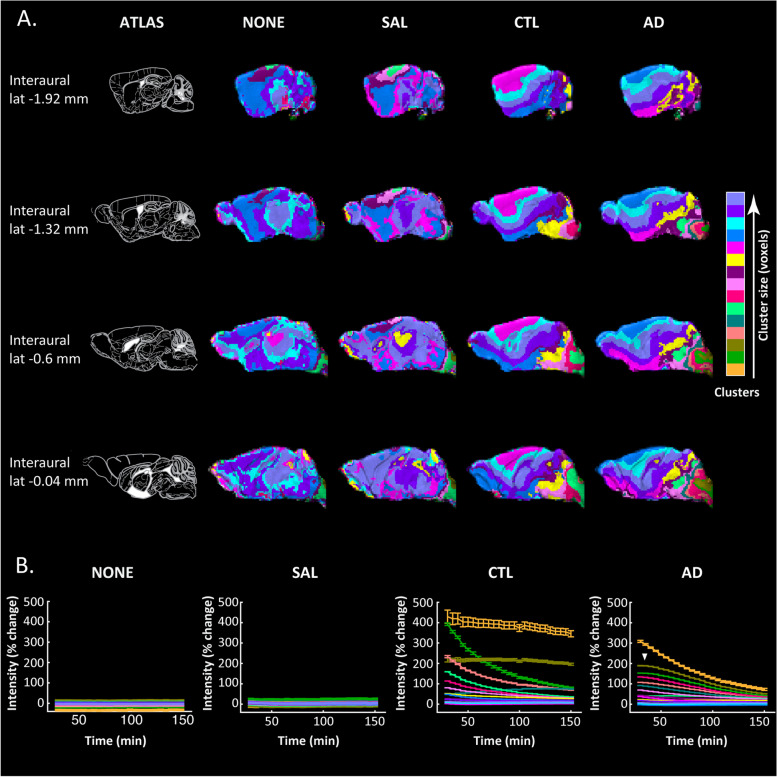
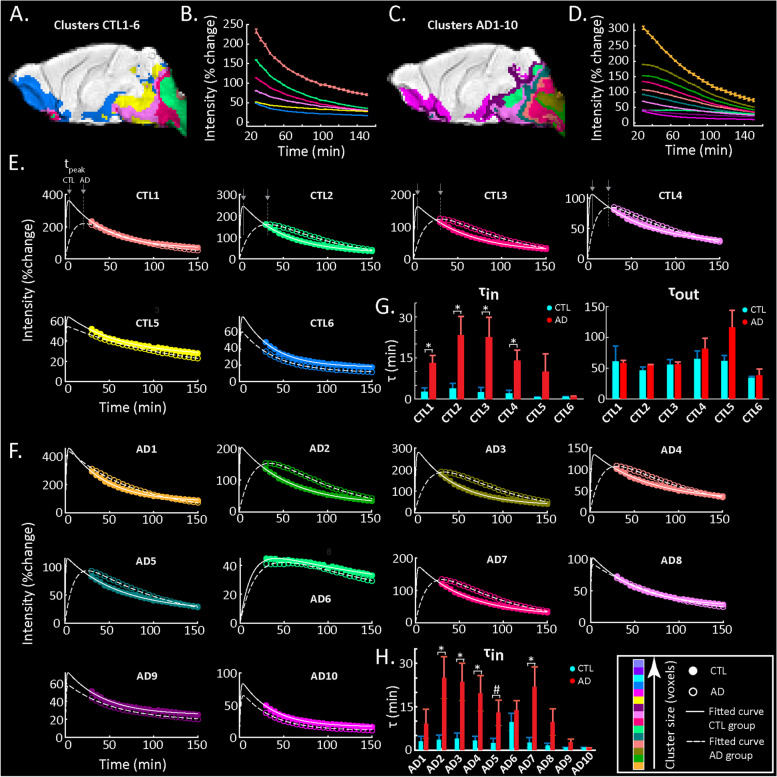
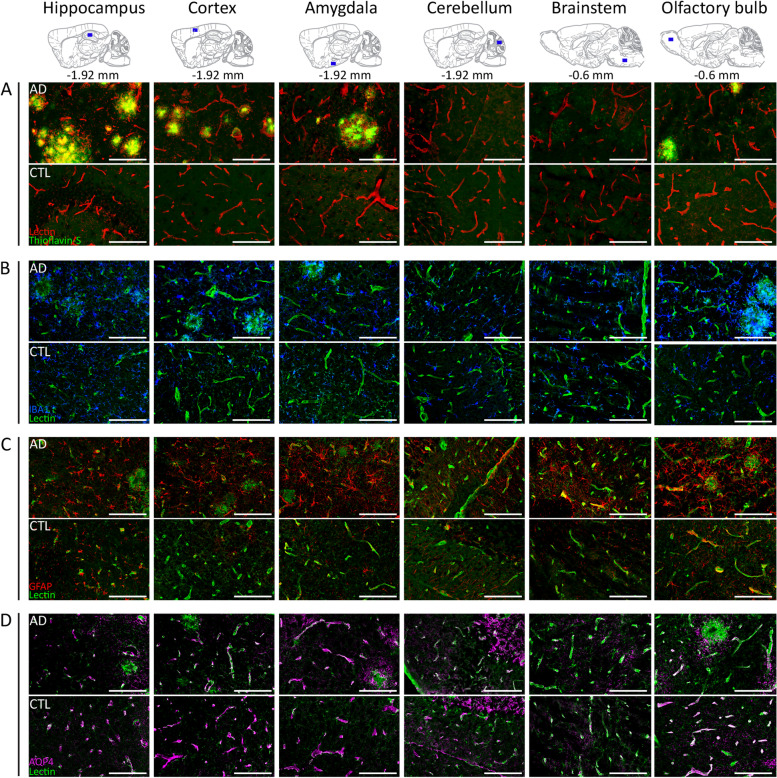
Results: We observed reduced rostral glymphatic flow and higher accumulation of the contrast agent in areas proximal to the injection side in the AD group. Clustering and subsequent computational modelling of voxel time courses revealed significantly lower influx time constants in AD relative to the controls. Ex vivo evaluation showed abundant amyloid plaque burden in the AD group coinciding with extensive astrogliosis and microgliosis. The neuroinflammatory responses were also found in plaque-devoid regions, potentially impacting brain-fluid circulation.

Conclusions: In a context resembling late-onset AD in humans, we demonstrate the disruption of glymphatic function and particularly a reduction in brain-fluid influx in the AD group. We conjecture that the hindered circulation of cerebrospinal fluid is potentially caused by wide-spread astrogliosis and amyloid-related obstruction of the normal routes of glymphatic flow resulting in redirection towards caudal regions. In sum, our study highlights the translational potential of alternative approaches, such as targeting brain-fluid circulation as potential therapeutic strategies for AD.

Keywords: Amyloid-beta; Astrogliosis; Brain-fluid circulation; DCE-MRI; Forebrain amyloidosis; Glymphatic system; Inflammation; Mature-onset Tet-off mice.


Conflict of interest statement

The authors declare that they have no competing interests.

Figures

Fig. 1
Fig. 1
Overview of the experimental setup. The 14-month-old animals, AD and CTL, underwent the surgery after 11 months of amyloid-beta expression. The surgery started a few minutes after the anaesthesia induction (time point =  − 15 min) and the start of continuous Gd-DOTA infusion (2.5 µl, 0.55 µl/min) into the cisterna magna refers to the time point t = 0. The DCE-MRI acquisition (120 min) started 30 min post-Gd-DOTA injection, every 5 min, up to 150 min post-injection
Fig. 2
Fig. 2
Spatial distribution maps of Gd-DOTA in the AD and CTL mice over time. A Schematic representation of the sagittal plane (interaural lateral − 0.04 mm) and transverse plane (Bregma level − 2.36 mm) from the Paxinos atlas with highlighted key regions such as olfactory bulb (OB), cerebellum (CB), hippocampus (HC), pons, medulla and ventricular system. B 3D visualisation of major blood vessels based on a recent vascular brain mouse atlas that was aligned to the template of this study (vascular atlas from [46]). The depicted vessels including OlfA (olfactory artery), Rrhv (rostral rhinal vein), Gcv (cerebral vein of Galen), Sss (superior sagittal sinus) and Trs (transverse sinus) are located in the vicinity of regions with enhanced contrast. C The spatial distribution of the MRI contrast agent in the CTL (top panel) and AD mice (bottom panel) at 30 min, 60 min, 90 min and 120 min post-intracisternal infusion shown in sagittal and transverse views. The colour scale represents the average percent signal intensity change, with dark blue/red indicating low/high percent signal intensity change, respectively
Fig. 3
Fig. 3
Region-of-interest (ROI)-based analysis. Average signal intensity changes over time reflecting Gd-DOTA contrast agent distribution in the OB (A), the HC (B), the aqueduct (C), the medulla (D), the pons (E) and the CB (F) for the CTL (cyan) and the AD (red) groups of mice. The grey rectangle in each panel represents the pre-acquisition time (acquisition started at 30 min post-Gd-DOTA infusion) with zero indicating the time of injection. An overview of the brain location of each ROI can be found in the top right corner of each panel (blue rectangles). OB, olfactory bulb; HC, hippocampus; CB, cerebellum; N, ROI size in voxels; *significant difference in the area under the curve (AUC) across the two groups indicates a differential distribution of contrast agent (N = 5 mice per group; two-sample t-test; p < 0.05; see the ‘Methods’ section)
Fig. 4
Fig. 4
Gd-DOTA spatial patterns over time in the Tet-Off APP mouse model. The clustering of MRI voxel time courses reflecting Gd-DOTA contrast agent distribution over time in the Tet-Off APP (AD) and three control groups: non-injected (NONE), saline-injected (SAL) and Gd-DOTA injected (CTL). A On the leftmost column (ATLAS), sagittal planes from the Paxinos atlas at different interaural locations indicate four representative brain slices. In other columns, the visualisation of 15 clusters for each group (each cluster shown with a different colour) demonstrates brain areas that share similar distributions of contrast agent. Colours on the colour bar indicate the sorting of clusters (in number of voxels) from smallest to largest in each group but note that same colours in different groups do not entail the same sizes and that it is not a linear scale but rather a sorted legend. B The voxel-average time courses (mean ± SD) of each cluster are shown for each group in the same colour as the respective cluster in A. Note that non-injected groups (NONE, SAL) show flat distributions of signal intensity over time that simply relate to slight signal amplitude differences without contrast agent contribution. On the other hand, injected groups demonstrated large increases in signal intensity starting at 30 min post-injection of Gd-DOTA (start of MRI acquisition) declining over time in most of the clusters (clearance of contrast agent) but also noted the accumulation of contrast agent in a couple of clusters
Fig. 5
Fig. 5
Model fitting of cluster time courses. A, C Clusters of the CTL and AD groups respectively selected for further analysis based on a minimum signal intensity change and a minimum number of voxel criterion (see the ‘Methods’ section). B, D Time courses of the selected clusters in the CTL and AD groups respectively. E Model fitting of the time courses of the selected clusters from the CTL group (solid lines, filled circles) is compared to model fitting of the same cluster of voxels in the AD group (dashed lines, open circles). F Similarly, model fitting of the selected clusters of the AD group (dashed lines, open circles) is compared to model fitting of the same cluster of voxels in the CTL group (solid lines, closed circles). In each panel of E and F, lines demonstrate the model fit and circles the data points (also shown in B, D) for each cluster. Colours represent the size sorting of the clusters based on the number of voxels (same as Fig. 4). G Bar graphs of influx (τin) and efflux (τout) time constants for CTL and AD mice in the clusters of the CTL map shown in A. Mean values and sem as well as the p-values are reported in Table 1. H Bar graph of the influx (τin) time constant for CTL and AD mice in the clusters of the AD map shown in C. Efflux is not shown (no significant differences) but values for τin and τout as well as p-values are reported in Table 2. For all bar graphs, ‘*’ denotes statistical significance (N = 5 mice per group; two-sample t-test; p < 0.05)
Fig. 6
Fig. 6
Representative images of amyloid pathology and inflammatory responses in the Tet-Off APP mouse model. Ex vivo evaluation was performed within key brain regions, such as the hippocampus, cortex, amygdala, olfactory bulb, cerebellum and brainstem in Tet-Off APP (AD) and control (CTL) mice. The uppermost panel shows sagittal planes (interaural respectively at − 1.92 mm or − 0.6 mm) from the Paxinos atlas indicating the selected brain slices and area locations. A Amyloid plaques (green) stained with Thioflavin-S were detected in brain regions characteristic of the model, such as the hippocampus, the cortical areas and olfactory bulb. The blood vessels were labelled with lectin (tomato—red). B Clear evidence of microgliosis within the brain tissue with characteristic large clusters of microglia (Iba-1, blue) observed in AD mice; blood vessels (lectin, green). C AD mice showed extensive and wide-spread astrogliosis, astrocytes identified by GFAP immunostaining (red), compared to control littermates even in brain regions devoid of plaques (i.e. brainstem); blood vessels (lectin, green). D AQP4 (magenta) immunohistochemical staining patterns along blood vessels (lectin, green). Scale bar, 100 µm for all images

References

    1. Dubois B, et al. Preclinical Alzheimer’s disease: definition, natural history, and diagnostic criteria. Alzheimers Dement. 2016;12(3):292–323. - PMC - PubMed
    1. Long JM, Holtzman DM. Alzheimer disease: an update on pathobiology and treatment strategies. Cell. 2019;179(2):312–339. - PMC - PubMed
    1. Querfurth HW, LaFerla FM. Alzheimer’s disease. N Engl J Med. 2010;362(4):329–344. - PubMed
    1. Zlokovic BV. Neurovascular pathways to neurodegeneration in Alzheimer’s disease and other disorders. Nat Rev Neurosci. 2011;12(12):723–738. - PMC - PubMed
    1. Soto-Rojas LO, et al. The neurovascular unit dysfunction in Alzheimer’s disease. Int J Mol Sci. 2021;22(4):2022. - PMC - PubMed

Publication types

MeSH terms