. 2023 Jan 27;12(1):13.
doi: 10.1186/s40164-023-00375-5.

Depletion of polyfunctional CD26highCD8+ T cells repertoire in chronic lymphocytic leukemia

Affiliations

Depletion of polyfunctional CD26highCD8+ T cells repertoire in chronic lymphocytic leukemia

Najmeh Bozorgmehr et al. Exp Hematol Oncol. .

Abstract

Background: CD8+ T cells play an essential role against tumors but the role of human CD8+CD26+ T cell subset against tumors, in particular, haematological cancers such as chronic lymphocytic leukemia (CLL) remains unknown. Although CD4+CD26high T cells are considered for adoptive cancer immunotherapy, the role of CD8+CD26+ T cells is ill-defined. Therefore, further studies are required to better determine the role of CD8+CD26+ T cells in solid tumors and haematological cancers.

Methods: We studied 55 CLL and 44 age-sex-matched healthy controls (HCs). The expression of CD26 on different T cell subsets (e.g. naïve, memory, effector, and etc.) was analyzed. Also, functional properties of CD8+CD26+ and CD8+CD26- T cells were evaluated. Finally, the plasma cytokine/chemokine and Galectin-9 (Gal-9) levels were examined.

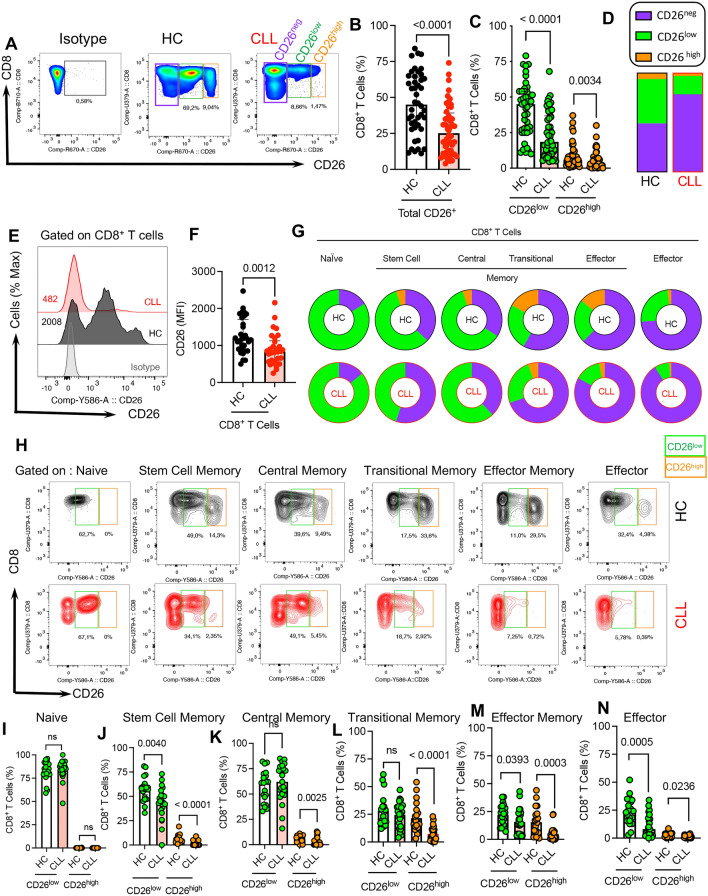
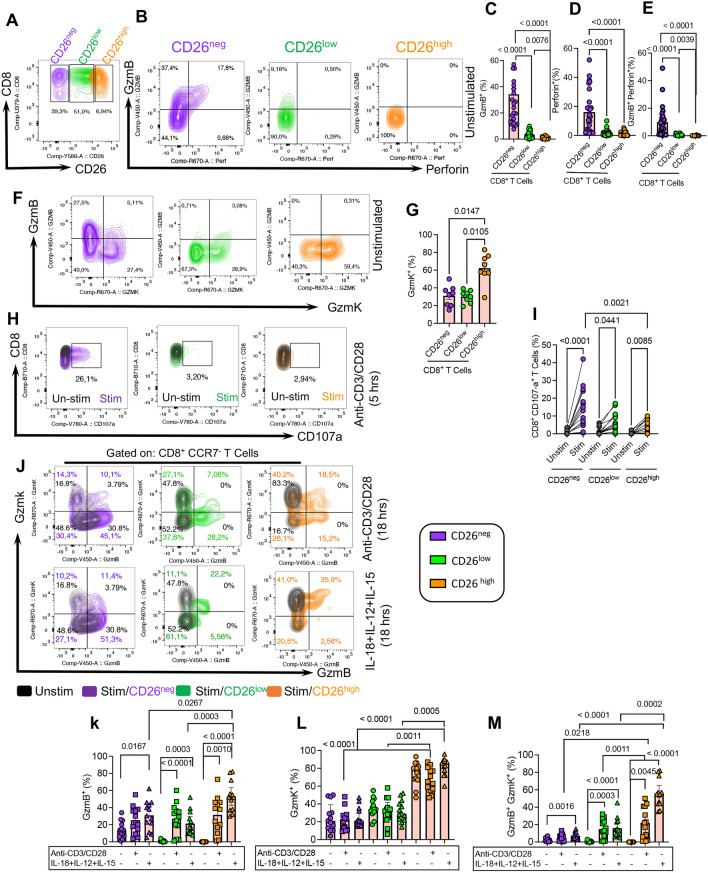
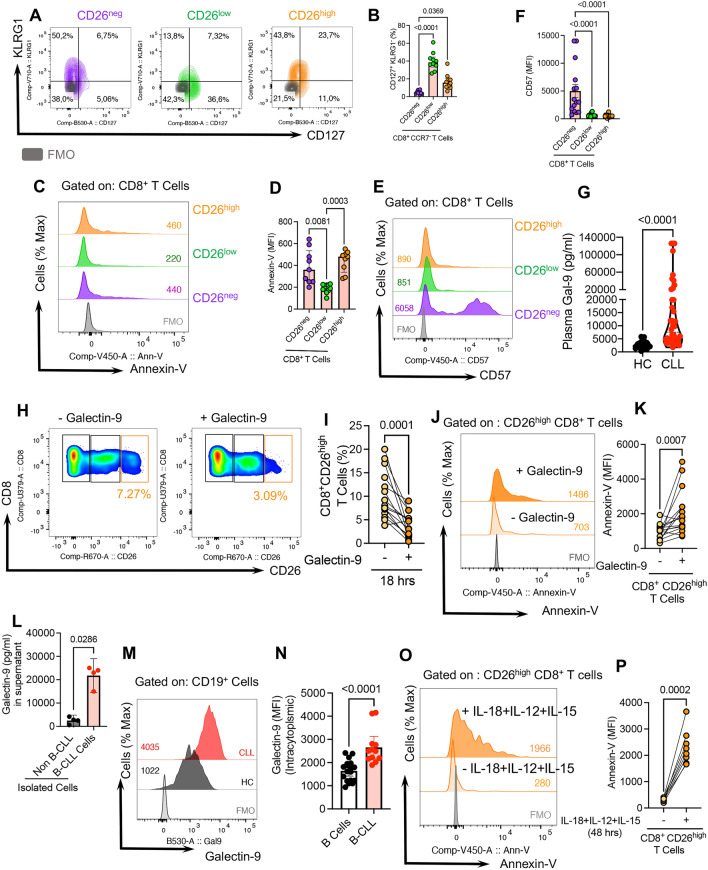
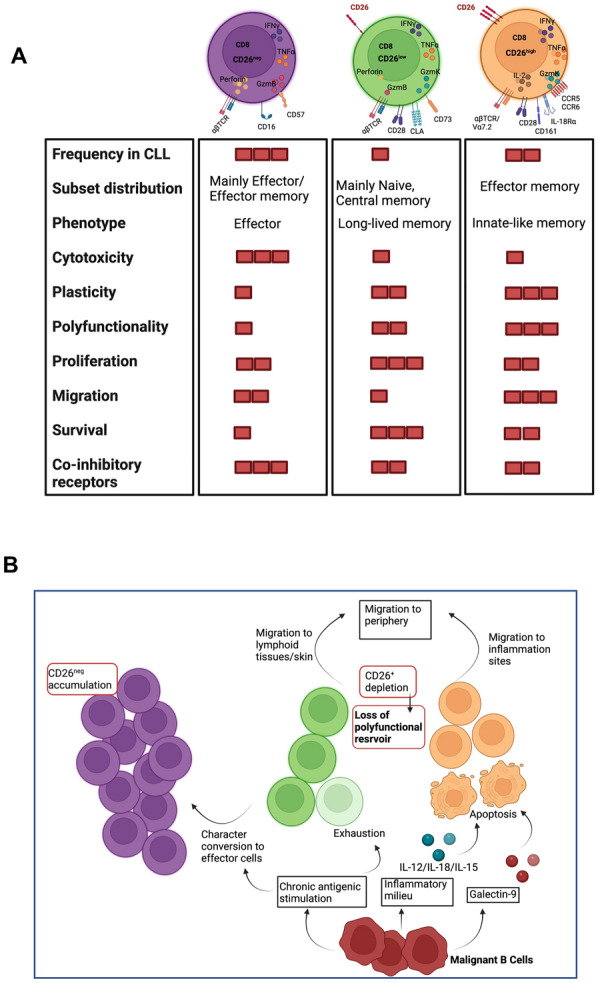
Results: CD26 expression identifies three CD8+ T cell subsets with distinct immunological properties. While CD26negCD8+ T cells are mainly transitional, effector memory and effectors, CD26lowCD8+ T cells are mainly naïve, stem cell, and central memory but CD26high T cells are differentiated to transitional and effector memory. CD26+CD8+ T cells are significantly reduced in CLL patients versus HCs. CD26high cells are enriched with Mucosal Associated Invariant T (MAIT) cells co-expressing CD161TVα7.2 and IL-18Rα. Also, CD26high cells have a rich chemokine receptor profile (e.g. CCR5 and CCR6), profound cytokine (TNF-α, IFN-γ, and IL-2), and cytolytic molecules (Granzyme B, K, and perforin) expression upon stimulation. CD26high and CD26low T cells exhibit significantly lower frequencies of CD160, 2B4, TIGIT, ICOS, CD39, and PD-1 but higher levels of CD27, CD28, and CD73 versus CD26neg cells. To understand the mechanism linked to CD26high depletion, we found that malignant B cells by shedding Galectin-9 (Gal-9) contribute to the elevation of plasma Gal-9 in CLL patients. In turn, Gal-9 and the inflammatory milieu (IL-18, IL-12, and IL-15) in CLL patients contribute to increased apoptosis of CD26high T cells.

Conclusions: Our results demonstrate that CD26+ T cells possess a natural polyfunctionality to traffic and exhibit effector functions and resist exhaustion. Therefore, they can be proposed for adoptive cancer immunotherapy. Finally, neutralizing and/or inhibiting Gal-9 may preserve CD26highCD8+ T cells in CLL.

Keywords: Adoptive T cell therapy; Galectin-9; MAIT cells; T cells exhaustion.


Conflict of interest statement

The authors declare that they have no competing interests.

Figures

Fig. 1
Fig. 1
CD26low and CD26high CD8+ T cells are reduced in CLL. A Representative flow cytometry plots, and (B) Cumulative data comparing the frequency of CD26+CD8+ T cells in PBMCs from HCs (n = 44) and CLL (n = 55) patients. C Cumulative data comparing the frequency of CD26low and CD26high CD8+ T cells in HC and CLL. D Bar plots illustrating the proportion of CD26neg, CD26low and CD26highCD8+ T cells in HC and CLL (E) Representative histogram plots, and (F) Cumulative data comparing the Mean Fluorescence Intensity (MFI) of CD26 in CD8+ T cells in HCs and CLLs. G The pie charts represent the median frequency of CD26neg/low/high in different subsets of CD8+ T cells (e.g. Naïve, Stem cell memory, Central memory, Transitional memory, Effector memory, and Effector) in HCs versus CLLs. H Representative flow cytometry plots of CD26low/high in different CD8+ T cell subsets of HCs (black) and CLLs (red). I Cumulative data of CD26low/high in naïve, (J) stem cell memory, (K) central memory, (L) transitional memory, (M) effector memory, and (N) effector CD8+ T cells in HC and CLL. Statistics are assessed by Mann–Whitney or the Kruskal–Wallis multiple comparison tests. P-value < 0.05 was considered as significant. Error bars represent the median with an interquartile range. Each dot represents an individual human sample
Fig. 2
Fig. 2
Phenotypic profile of CD26neg/low/high CD8+ T cells in CLL. A Representative flow plots, and (B) cumulative data showing the frequency of CD161+ TV α 7.2+ in CD26neg/low/high CD8+ T cell subsets in CLL. C Cumulative data of the frequency CD161/ TV α 7.2 co-expressing cells in CD26highCD8+ T cells in CLL. D Representative flow plots, and (E) cumulative data of the frequency of IL-18R α expressing cells among CD26neg/low/high CD8+ T cells in CLL. F Cumulative data of the frequency of IL-18R α high expressing cells among CD26neg/low/high CD8+ T cells in CLL. G Representative plots, and (H) the frequency of CD160+ cells among CD26neg/low/high CD8+ T cells in CLL. I Representative plots, and (J) cumulative data of the frequency of 2B4+ cells among CD26neg/low/high CD8+ T cells in CLL. K Representative plots, and (L) cumulative data of the frequency of TIGIT+ cells among CD26neg/low/high CD8+ T cells in CLL. M Representative plots, and (N) cumulative data of the frequency of ICOS+ cells among CD26neg/low/high CD8+ T cells in CLL. O Representative plots, and (P) cumulative data of the frequency of CD28+ among CD26neg/low/high CD8+ T cells in CLL. Q Representative plots, and (R) cumulative data of the frequency of CD27+ cells among CD26neg/low/high among CD8+ T cells in CLL. S Representative plots, and (T) cumulative data of the frequency of PD-1+ cells among CD26neg/low/high CD8+ T cells in CLL. U Representative plots, and (V) cumulative data of the frequency of CD39+ cells among CD26neg/low/high among CD8+ T cells in CLL. W Representative plots, and X cumulative data of the frequency of CD73+ cells among CD26neg/low/high CD8+ T cells in CLL. Y Cumulative data showing the frequency of co-inhibitory/co-stimulatory expressing cells in CD26lowCD8+ T cells in HC and CLL. Error bars represent the median with an interquartile range. Each dot represents an individual human sample. Florescence minus one (FMO)
Fig. 3
Fig. 3
Cytotoxic properties of CD26neg/low/high CD8+ T cells in CLL. A Representative flow plot of the gating strategy for CD26neg, CD26low, and CD26high CD8+ T cells. B Representative flow plots of the co-expression of Granzyme-B (GzmB)/Perforin in CD26neg/low/high CD8+ T cells in CLL. C Cumulative data showing the frequency of GzmB+, (D) Perforin+, and (E) GzmB+Perforin+ cells among CD26neg/low/high CD8+ T cells in CLL. F Representative flow plots, and (G) cumulative data of the frequency of GzmB+GzmK+ cells among CD26neg/low/high CD8+ T cells in CLL. H Representative flow plots, and (I) cumulative data of the frequency of CD107a+ cells among CD26neg/low/high CD8+ T cells in CLL either unstimulated (unstim) or stimulated (stim) with anti-CD3/CD28 (3 gμ/ml, 1 gμ/ml) in the presence of protein transport inhibitor (1/1000). J Representative flow plots, and cumulative data of the frequency of (K) GzmB+ (L) GzmK+, and (M) GzmB+GzmK+ cells among CD26neg/low/high CCR7CD8+ T cells in CLL either unstimulated or stimulated with anti-CD3/CD28(3 gμ/ml, 1 gμ/ml), and a cocktail of IL-18 + IL-12 + IL-15 (100 ng/ml of each). Error bars represent median with interquartile range. Each dot represents an individual human sample
Fig. 4
Fig. 4
Cytokine production and proliferation ability of CD26neg/low/high CD8+ T cells in CLL. A Representative flow plots, (B) the frequency of TNF-α, (C) IFN-γ, and (D) TNF-α+IFN-γ+ cells among CD26neg/low/high CCR7CD8+ T cells. E Representative plots, (F) cumulative data showing the frequency of TNF-α+, (G) IFN-γ+, and (H) TNF-α+IFN-γ+ among CD26neg/low/high CCR7CD8+ T cells in unstimulated or stimulated with anti-CD3/CD28 (3 gμ/ml, 1 gμ/ml) and a cocktail of IL-18 + IL-12 + IL-15 (100 ng/ml of each). (I) Representative flow plots and, (J) cumulative data of the frequency of IL-2 expressing cells among CD26neg/low/high CD8+ T cells in unstimulated (black color) versus 5 h after in-vitro stimulation with PMA/ionomycin cocktail (Biolegend, 2 ng/ml) in the presence of Brefeldin A (1 gμ/ml). (K) Representative flow plots and, (L) cumulative data of the frequency of CFSElow (proliferated) cells among CD26neg/low/high CCR7CD8+ T cells, unstimulated (black color) versus 72 h stimulation. (M) Representative flow plots, and (N) cumulative data showing the MFI for ROR γδ in CD26neg, CD26low, and CD26high CD8+ T cells in CLL. Error bars represent the median with an interquartile range. Each dot represents an individual human sample
Fig. 5
Fig. 5
CD26+CD8+ T cells exhibit a greater migratory capacity in CLL. A Representative plots of the frequency of CCR5+CD8+ T cells among CD26neg/low/high subsets. B The graphical illustrates the tendency of CCR5+CD8+ T cells homing to secondary lymphoid organs or inflamed tissues in response to CCL3, MIP-1 α/β, and RANTES. C Cumulative data of the frequency of CCR5+CD8+ T cells among CD26neg/low/high CD8 + T cells in CLL. D Representative flow plots of the frequency CCR6+CD8+ T cells among CD26neg/low/high subsets. E The graphical illustrates the tendency of CCR6+CD8+ T cells homing to colon, and mucosal tissues in response to CCL20. F Cumulative data of the frequency of CCR6+CD8+ T cells among CD26neg/low/high. G Representative plots of the frequency of CCR7+CD8+ T cells among CD26neg/low/high subsets of CD8+ T cells. H The graphical illustrates the tendency of CCR7+CD8+ T cells homing to lymph nodes in response to CCL19. I Cumulative data of the frequency of CCR7+CD8+ T cells among CD26neg/low/high subsets. J Representative plots of the frequency of Cutaneous Lymphocyte Antigen (CLA)+CD8+ T cells among CD26neg/low/high cells. K The graphical illustrates the tendency of CLA+CD8+ T cells homing to skin following E/P Selectin binding on endothelial cells. L Cumulative data of the frequency of CLA+CD8+ T cells among CD26neg/low/high cells. M Representative plots, and the frequency of migrated CD26neg, CD26low, and CD26high CD8+ T cells at the baseline and after 18 h in response to (N) Fetal Bovine Serum (FBS-10%), (O) RANTES (10 nM), and (P) IL-18 (100 ng/ml). Error bars represent the median with an interquartile range. Each dot represents an individual human sample.
Fig. 6
Fig. 6
Gal-9 preferentially promotes CD26high CD8+ T cells apoptosis in CLL. A Representative plots, and (B) cumulative data of the frequency of CD127+/KLRG1 cells among CD26neg/low/high subsets of CD8+ T cells. C Representative plots, and (D) cumulative data of the intensity of Annexin-V expression (MFI) among CD26neg/low/high CD8+ T cells. E Representative plots, and (F) cumulative data of the MFI of CD57+ among CD26neg/low/high CD8+ T cells. G Cumulative data of the plasma Gal-9 concentrations in HCs and CLL patients. H Representative plots, and (I) cumulative data of the frequency of CD26highCD8+ T cells following stimulation with anti-CD3/CD28 in the presence or absence of recombinant human Gal-9 (0.02 gμ/ml). J Representative plots, and (K) cumulative data of the intensity of Annexin-V expression in CD26high CD8+ T cells following stimulation with anti-CD3/CD28 in the presence or absence of Gal-9. L Cumulative data of Gal-9 concentration in the supernatants of isolated non-B cells versus malignant B cells (B-CLL) after 12 h culture. M Representative plots, and (N) cumulative data ofthe intracytoplasmic MFI of Gal-9 in B cells from HC versus B-CLLs. O Representative plots, and (P) cumulative data of the frequency of Annexin-V expressing CD8+ T cells in CD26high cells at the baseline versus stimulation with a cytokine cocktail (IL-18 + IL-12 + IL-15) (100 ng/ml of each) for 18 h. Error bars represent the median with an interquartile range. Each dot represents an individual human sample
Fig. 7
Fig. 7
Visual summary. A CD26 expression defines three distinct populations of CD8+ T cells in CLL with discrete properties. The table summarizes different properties of CD26neg, CD26low, and CD26high CD8+ T cells ranked as high (∎∎∎) moderate (∎∎), and low (∎) B The illustration depicts the proposed mechanism of decreased frequency of CD26low and CD26high subsets and the expansion of CD26neg CD8+ T cells in CLL. Migration towards inflamed tissues, elimination by apoptosis (Gal-9, Inflammatory cytokines), change of character/exhaustion due to chronic antigenic stimulation in CLL are proposed as potential mechanisms leading to the depletion of CD26+CD8+ in CLL

Similar articles

Cited by

References

    1. Engel M, Hoffmann T, Wagner L, Wermann M, Heiser U, Kiefersauer R, et al. The crystal structure of dipeptidyl peptidase IV (CD26) reveals its functional regulation and enzymatic mechanism. Proc Natl Acad Sci U S A. 2003;100:5063–5068. - PMC - PubMed
    1. Yaron A, Naider F, Scharpe S. Proline-dependent structural and biological properties of peptides and proteins. Crit Rev Biochem Mol Biol. 1993 doi: 10.3109/10409239309082572. - DOI - PubMed
    1. Ahrén B, Hughes TE. Inhibition of dipeptidyl peptidase-4 augments insulin secretion in response to exogenously administered glucagon-like peptide-1, glucose-dependent insulinotropic polypeptide, pituitary adenylate cyclase-activating polypeptide, and gastrin-releasing peptide in mice. Endocrinology. 2005;146:2055–2059. - PubMed
    1. Chitadze G, Wehkamp U, Janssen O, Brüggemann M, Lettau M. The serine protease CD26/DPP4 in non-transformed and malignant T Cells. Cancers. 2022;13:5947. - PMC - PubMed
    1. Abbott CA, Baker E, Sutherland GR, McCaughan GW. Genomic organization, exact localization, and tissue expression of the human CD26 (dipeptidyl peptidase IV) gene. Immunogenetics. 1994;40:331–338. - PubMed