. 2023 Apr;17(4):664-685.
doi: 10.1002/1878-0261.13384. Epub 2023 Feb 8.

L1CAM promotes vasculogenic mimicry formation by miR-143-3p-induced expression of hexokinase 2 in glioma

Affiliations

L1CAM promotes vasculogenic mimicry formation by miR-143-3p-induced expression of hexokinase 2 in glioma

Yishan Huang et al. Mol Oncol. 2023 Apr.

Abstract

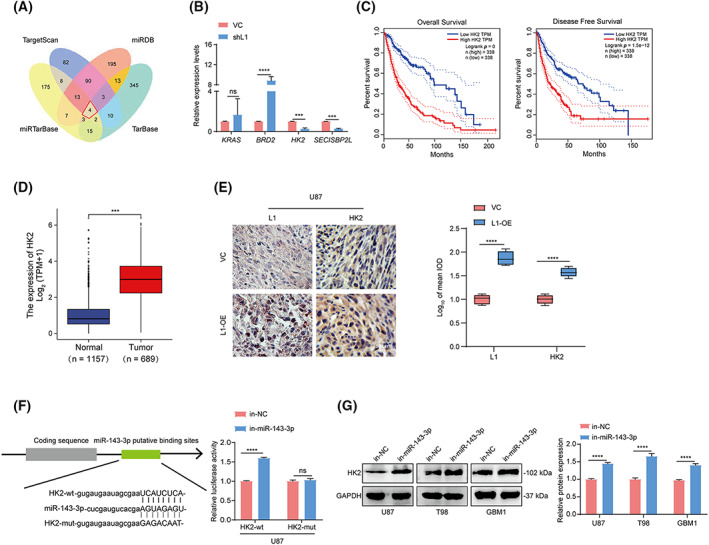
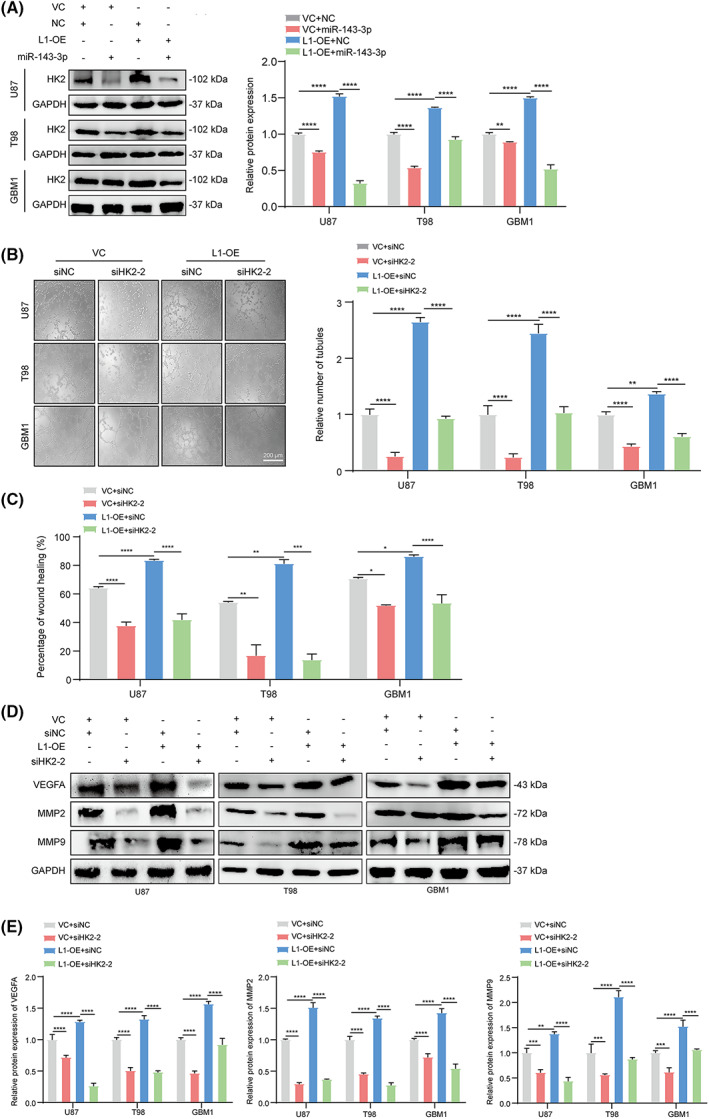
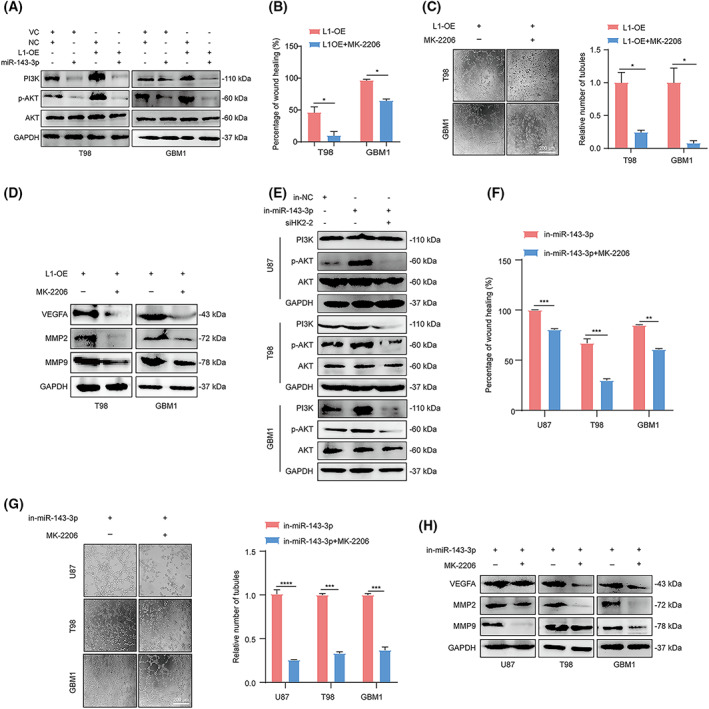
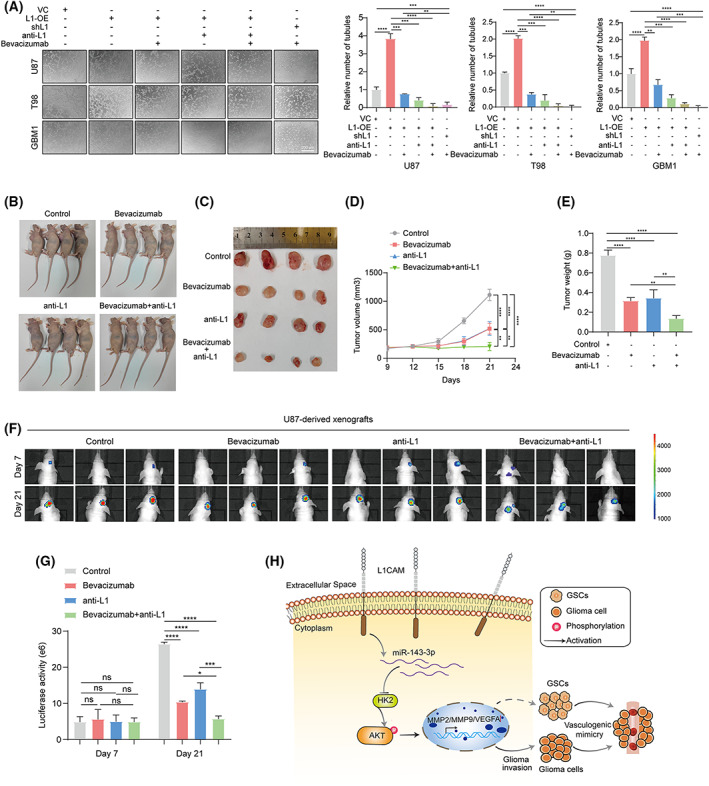
In recent decades, antiangiogenic therapy, which blocks the supply of oxygen and nutrition to tumor cells, has become a promising clinical strategy for the treatment of patients with tumors. However, recent studies revealed that vasculogenic mimicry (VM), which is the process by which vascular morphological structures are formed by highly invasive tumor cells, has been considered a potential factor for the failure of antiangiogenic therapy in patients with tumors. Thus, inhibition of VM formation might be a potential target for improving the outcome of antiangiogenic strategies. However, the mechanism underlying VM formation is still incompletely elucidated. Herein, we report that L1CAM might be a critical regulator of VM formation in glioma, and might be associated with the resistance of glioma to antiangiogenic therapy. We found that the tumor-invasion and tube-formation capabilities of L1CAM-overexpressing cells were significantly enhanced in vitro and in vivo. In addition, the results indicated that miR-143-3p, which might directly target the 3'UTR of the hexokinase 2 (HK2) gene to regulate its protein expression, was subsequently involved in L1CAM-mediated VM formation by glioma cells. Further study revealed that the regulation of MMP2, MMP9, and VEGFA expression was involved in this process. Moreover, we identified that activation of the downstream PI3K/AKT signaling pathway of the L1CAM/HK2 cascade is critical for VM formation by glioma cells. Furthermore, we found that the combined treatment of anti-L1CAM neutralizing monoclonal antibody and bevacizumab increases efficacy beyond that of bevacizumab alone, and suppresses glioma growth in vivo, indicating that the inhibition of L1CAM-mediated VM formation might efficiently improve the effect of antiangiogenic treatment for glioma patients. Together, our findings demonstrated a critical role of L1CAM in regulating VM formation in glioma, and that L1CAM might be a potential target for ameliorating tumor resistance to antiangiogenic therapy in glioma patients.

Keywords: HK2; L1CAM; glioma; miR-143-3p; vasculogenic mimicry.


Conflict of interest statement

The authors declare no conflict of interest.

Figures

Fig. 1
Fig. 1
L1 expression is positively correlated with malignancy degree and prognosis in glioma patients. (A,B) The mRNA levels of L1 in various types of cancers from the Oncomine (A) and CCLE (B) databases. (C) Representative images of L1 expression in a tissue microarray of glioma specimens with I (n = 25), II (n = 80), III (n = 51), and IV (n = 24) grades. Scale bar, 50 μm. (D) The positive correlation between L1 expression and the malignancy of gliomas (n = 180). (E) Overall survival rates in higher or lower L1‐expressing specimens from glioma patients (n = 180). The survival curves were evaluated by Kaplan–Meier analyses and the statistical significance of differences between the survival curves was assessed with a log‐rank test. One‐way ANOVA followed by Tukey's multiple comparisons test was used to generate P values. Data expressed as mean ± SEM. *P < 0.05, **P < 0.01, and ***P < 0.001. L1, neural cell adhesion molecule L1.
Fig. 2
Fig. 2
L1 overexpression enhances glioma invasion by upregulating MMP2 and MMP9 expression in glioma cells. (A) Overexpression and knockdown of L1 in U87, T98, and GBM1 glioma cell lines (n = 3 replicates). (B) GO analysis of the top 10 GO terms with DEGs between the L1‐knockdown and vector control groups of U87 cells. Data is visualized through the ggplot2 package and analyzed with the clusterprofiler package. (C) Chord diagram of DEGs in these top 10 GO terms. (D,E) The transwell (D) and wound‐healing (E) assay results show the effects of L1 expression on tumor invasion in the L1‐OE, shL1, and control groups of U87, T98, and GBM1 glioma cell lines (n = 3 replicates). Scale bar, 200 μm. (F) L1 overexpression induces upregulation of MMP2 and MMP9 expression in different glioma cell lines (n = 3 replicates). (G,H) Representative bioluminescent images (G) and the quantification (H) of intracranial xenografts derived from L1‐overexpressing (L1‐OE) and vector control (VC) U87 glioma cells (n = 3 for each group). (I) Kaplan–Meier survival curves of the xenograft mice bearing the L1‐OE glioma tumors (n = 3 for each group) with a log‐rank test. (J) Representative images from the different groups and quantification of tumor‐bearing tissues stained with anti‐MMP2 or anti‐MMP9 antibody in L1‐OE and vector control U87 xenograft‐bearing BALB/c‐nu mice (n = 3 for each group). Scale bar, 50 μm. (K) Representative images of IHC staining of L1, MMP2, and MMP9 in human glioma specimens (n = 85). (L,M) Spearman rank correlation analysis of L1 and MMP2 (L) or MMP9 (M) in human glioma specimens (n = 85). A two‐tailed Student's t‐test was used to generate P values. Data expressed as mean ± SEM. *P < 0.05, **P < 0.01, ***P < 0.001, and ****P < 0.0001. DEGs, differently expressed genes; GO, gene ontology; L1, neural cell adhesion molecule L1; L1‐OE, L1‐overexpressing; shL1, L1 knockdown; VC, vector control.
Fig. 3
Fig. 3
L1 overexpression promotes VM formation by glioma cells. (A) Representative images and quantification of tube formation in the L1‐OE, shL1, and control groups of U87, T98, and GBM1 glioma cell lines (n = 3 replicates). Scale bar, 200 μm. (B) Relative expression of key regulators of VM formation, including VEGFA, N‐cadherin, vimentin, E‐cadherin, CD31, CD34, and EPHA2, in the L1‐OE and control groups of different glioma cell lines (n = 3 replicates). (C) Representative images of the increasing fluorescent signals of CD31 and CD34 detected by anti‐CD31 or anti‐CD34 antibody (FITC, green) in L1‐OE and control groups of T98 and GBM1 cells (n ≥ 3 replicates). Scale bar, 50 μm. (D,E) Representative images (D) and quantification (E) of tumor‐bearing tissues stained with anti‐CD31 or anti‐CD34 antibody in L1‐OE and vector control U87 xenograft‐bearing BALB/c‐nu mice (n = 3 for each group). Scale bar, 50 μm. (F) Representative images of IHC staining of L1, CD31, and CD34 in human glioma specimens (n = 85). Scale bar, 50 μm. (G,H) Spearman rank correlation analysis of L1 and CD31 (G) or CD34 (H) in human glioma specimens (n = 85). A two‐tailed Student's t‐test was used to generate P values. Data expressed as mean ± SEM. *P < 0.05, ***P < 0.001, and ****P < 0.0001. EPHA2, EPH receptor A2; L1, neural cell adhesion molecule L1; L1‐OE, L1‐overexpressing; shL1, L1 knockdown; VC, vector control; VEGFA, vascular endothelial growth factor A.
Fig. 4
Fig. 4
miRNA‐143‐3p is involved in L1‐mediated VM formation in glioma. (A) The top 10 differentially expressed miRNAs in L1‐overexpressing and vector control U87 glioma cells. (B) The qPCR confirmation of miRNA‐seq identified the top 10 regulated miRNAs in L1‐OE and VC groups in U87 glioma cells (n = 3 replicates). (C) Representative images and quantification of tube formation in the in‐miR‐143‐3p and in‐NC groups of U87, T98, and GBM1 cell lines (n = 3 replicates). (D) Treatment with in‐miR‐143‐3p suppresses invasion in different glioma cell lines (n = 3 replicates). (E,F) Representative images and quantification of tube formation and tumor invasion in the L1‐OE and vector groups of different glioma cell lines with or without miR‐143‐3p mimic transfection (n = 3 replicates). (G,H) Determination (G) and quantification (H) of MMP2, MMP9, and VEGFA expression in miR‐143‐3p mimic‐treated L1‐OE and vector control groups of U87, T98, and GBM1 glioma cell lines (n = 3 replicates). In (B–D), a two‐tailed Student's t‐test was used to generate P values. In (E–H), one‐way ANOVA followed by Tukey's multiple comparisons test was used to generate P values. Data expressed as mean ± SEM. *P < 0.05, **P < 0.01, ***P < 0.001, and ****P < 0.0001. in‐miR‐143‐3p, miR‐143‐3p inhibitor; in‐NC, miR‐143‐3p inhibitor negative control; L1, neural cell adhesion molecule L1; L1‐OE, L1‐overexpressing; miR‐143‐3p, miR‐143‐3p mimic; MMP2, matrix metalloproteinase 2; MMP9, matrix metalloproteinase 9; NC, miR‐143‐3p mimic negative control; ns, not significant; VC, vector control; VEGFA, vascular endothelial growth factor A.
Fig. 5
Fig. 5
miR‐143‐3p directly targets the HK2‐3'UTR binding site in glioma cells. (A) The identification of the overlapping miR‐143‐3p‐targeted genes in the TargetScan, miRDB, miRTarBase, and TarBase databases. (B) qRT‐PCR confirmation of the overlapping genes in the shL1 and VC groups of U87 glioma cells (n = 3 replicates). (C) The overall survival and disease‐free survival rates of glioma patients with high and low HK2 expression from the GEPIA database (n = 338). The differences in patients' survival curves between different subgroups were evaluated by Kaplan–Meier analyses and the statistical significance of differences between the survival curves was assessed with a log‐rank test. (D) The evaluation of HK2 expression in glioma specimens (n = 689) and adjacent noncancerous tissues (n = 1157) in the UCSC Xena database. (E) Representative images and quantification of tumor‐bearing tissues stained with anti‐L1 or anti‐HK2 antibody in L1‐OE and vector control U87 xenograft‐bearing BALB/c‐nu mice (n = 3 for each group). Scale bar, 50 μm. (F) A luciferase reporter assay was performed in U87 cells cotransfected with HK2‐wt or HK2‐mut and in‐miR‐143‐3p and in‐NC (n = 3 replicates). (G) Determination and quantification of HK2 expression in in‐miR‐143‐3p‐ and in‐NC‐treated U87, T98, and GBM1 glioma cell lines by western blot analysis (n = 3 replicates). A two‐tailed Student's t‐test was used to generate P values. Data expressed as mean ± SEM. ***P < 0.001, ****P < 0.0001. HK2‐mut, the mutated 3'UTR sequence of HK2 gene; HK2‐wt, the wildtype 3'UTR sequence of HK2 gene; in‐miR‐143‐3p, miR‐143‐3p inhibitor; in‐NC, miR‐143‐3p inhibitor negative control; L1‐OE, L1‐overexpressing; ns, not significant; shL1, L1 knockdown; VC, vector control.
Fig. 6
Fig. 6
miR‐143‐3p‐regulated HK2 is involved in L1‐mediated VM formation by glioma cells. (A) Western blot examination and quantification of HK2 expression in miR‐143‐3p mimic‐treated L1‐OE and vector control groups of U87, T98, and GBM1 glioma cell lines (n = 3 replicates). (B) Representative images and quantification of tube formation in the L1‐OE and vector groups of different glioma cell lines with or without HK2 siRNA transfection (n = 3 replicates). Scale bar, 200 μm. (C) Knockdown of HK2 expression suppresses glioma invasion in the L1‐OE and vector control groups of different glioma cell lines (n = 3 replicates). (D,E) Determination (D) and quantification (E) of MMP2, MMP9, and VEGFA expression by western blot analysis after inhibiting HK2 expression in the L1‐OE and vector control groups of U87, T98, and GBM1 glioma cell lines (n = 3 replicates). One‐way ANOVA followed by Tukey's multiple comparisons test was used to generate P values. Data expressed as mean ± SEM. *P < 0.05, **P < 0.01, ***P < 0.001, and ****P < 0.0001. HK2, hexokinase 2; L1, neural cell adhesion molecule L1; L1‐OE, L1‐overexpressing; MMP2, matrix metalloproteinase 2; MMP9, matrix metalloproteinase 9; siHK2‐2, HK2 knockdown; siNC, scramble siRNA control; VC, vector control; VEGFA, vascular endothelial growth factor A.
Fig. 7
Fig. 7
Activation of the PI3K/AKT signaling pathway is essential for L1‐mediated VM formation by glioma cells. (A) Determination of PI3K, p‐AKT, and AKT levels in the miR‐143‐3p mimic‐treated L1‐OE and vector control groups of T98, and GBM1 glioma cell lines by western blot analysis (n = 3 replicates). (B) The inactivation of AKT signaling suppresses L1 overexpression‐enhanced glioma invasion in T98 and GBM1 cells (n = 3 replicates). (C) Representative images and quantification of tube formation in L1‐overexpressing T98 and GBM1 glioma cells with or without MK‐2206 treatment (n = 3 replicates). Scale bar, 200 μm. (D) Western blot analysis of MMP2, MMP9, and VEGFA expression in L1‐overexpressing T98 and GBM1 glioma cells with or without MK‐2206 treatment (n = 3 replicates). (E) Determination of PI3K, p‐AKT, and AKT levels in different glioma cell lines by western blot analysis after blocking the L1/HK2 cascade (n = 3 replicates). (F,G) MK‐2206 treatment can reverse the enhancement of the tumor invasion (F) and tube formation (G) capabilities induced by in‐miR‐143‐3p transfection in glioma cells (n = 3 replicates). Scale bar, 200 μm. (H) The determination of MMP2, MMP9, and VEGFA expression in in‐miR‐143‐3p‐transfected glioma cells with or without MK‐2206 treatment (n = 3 replicates). A two‐tailed Student's t‐test was used to generate P values. Data expressed as mean ± SEM. *P < 0.05, **P < 0.01, ***P < 0.001, and ****P < 0.0001. HK2, hexokinase 2; in‐miR‐143‐3p, miR‐143‐3p inhibitor; in‐NC, miR‐143‐3p inhibitor negative control; L1, neural cell adhesion molecule L1; L1‐OE, L1‐overexpressing; MMP2, matrix metalloproteinase 2; MMP9, matrix metalloproteinase 9; p‐Akt, phosphorylated Akt; siHK2‐2, HK2 knockdown; VC, vector control; VEGFA, vascular endothelial growth factor A.
Fig. 8
Fig. 8
The blockade of L1/HK2 cascade enhance the efficacy of antiangiogenic therapy in vivo and in vitro. (A) Determination and quantification of tube formation in L1‐overexpression (L1‐OE), L1‐inhibited (shL1), or vector control glioma cell lines treated with bevacizumab and/or anti‐L1 neutralizing monoclonal antibody (anti‐L1; n = 3 replicates). Scale bar, 200 μm. (B–D) The tumor growths of bevacizumab and/or anti‐L1 treated different groups (n = 4 for each group) in subcutaneous U87‐xenografted BALB/c‐nu mice at the indicated timepoints (9, 12, 15, 18, 21, and 24 days). (E) Tumor weight of bevacizumab and/or anti‐L1 treated different groups (n = 4 for each group) in subcutaneous U87‐xenografted BALB/c‐nu mice. (F,G) In vivo bioluminescent images (F) and the quantification (G) of intracranial U87‐derived xenografts treated with bevacizumab and/or anti‐L1 at the indicated timepoints (7 and 21 days, n = 4 for each group). (H) Schematic of the mechanism of L1‐mediated VM formation in glioma. The broken arrow indicates that the signaling pathway is not yet fully verified. One‐way ANOVA followed by Tukey's multiple comparisons test was used to generate P values. Data expressed as mean ± SEM. *P < 0.05, **P < 0.01, ***P < 0.001, and ****P < 0.0001. HK2, hexokinase 2; L1, neural cell adhesion molecule L1; L1‐OE, L1‐overexpressing; MMP2, matrix metalloproteinase 2; MMP9, matrix metalloproteinase 9; ns, not significant; shL1, L1 knockdown; VC, vector control; VEGFA, vascular endothelial growth factor A.

Similar articles

Cited by

References

    1. Ostrom QT, Patil N, Cioffi G, Waite K, Kruchko C, Barnholtz‐Sloan JS. CBTRUS statistical report: primary brain and other central nervous system tumors diagnosed in the United States in 2013–2017. Neuro Oncol. 2020;22:1–42. - PMC - PubMed
    1. Paw I, Carpenter RC, Watabe K, Debinski W, Lo HW. Mechanisms regulating glioma invasion. Cancer Lett. 2015;362:1–7. - PMC - PubMed
    1. Das S, Marsden PA. Angiogenesis in glioblastoma. N Engl J Med. 2013;369:1561–3. - PMC - PubMed
    1. Nghiemphu PL, Liu W, Lee Y, Than T, Graham C, Lai A, et al. Bevacizumab and chemotherapy for recurrent glioblastoma a single‐institution experience. Neurology. 2009;72:1217–22. - PMC - PubMed
    1. Norden AD, Drappatz J, Wen PY. Antiangiogenic therapies for high‐grade glioma. Nat Rev Neurol. 2009;5:610–20. - PubMed

Publication types