

High expression of LOC541471, GDAP1, SOD1, and STK25 is associated with poor overall survival of patients with acute myeloid leukemia
- PMID: 36708053
- PMCID: PMC10134312
- DOI: 10.1002/cam4.5644
High expression of LOC541471, GDAP1, SOD1, and STK25 is associated with poor overall survival of patients with acute myeloid leukemia
Abstract
Background: Acute myeloid leukemia (AML) is an aggressive heterogeneous hematological malignancy with remarkably heterogeneous outcomes. This study aimed to identify potential biomarkers for AML risk stratification via analysis of gene expression profiles.
Methods: RNA sequencing data from 167 adult AML patients in the Cancer Genome Atlas (TCGA) database were obtained for overall survival (OS) analysis, and 52 bone marrow (BM) samples from our clinical center were used for validation. Additionally, siRNA was used to investigate the role of prognostic genes in the apoptosis and proliferation of AML cells.
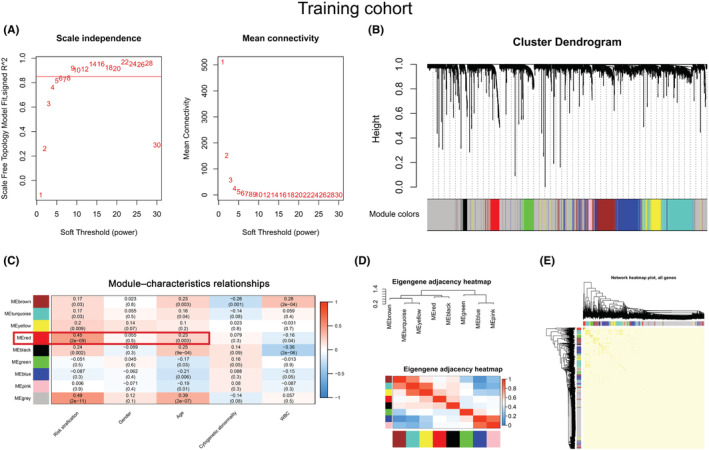
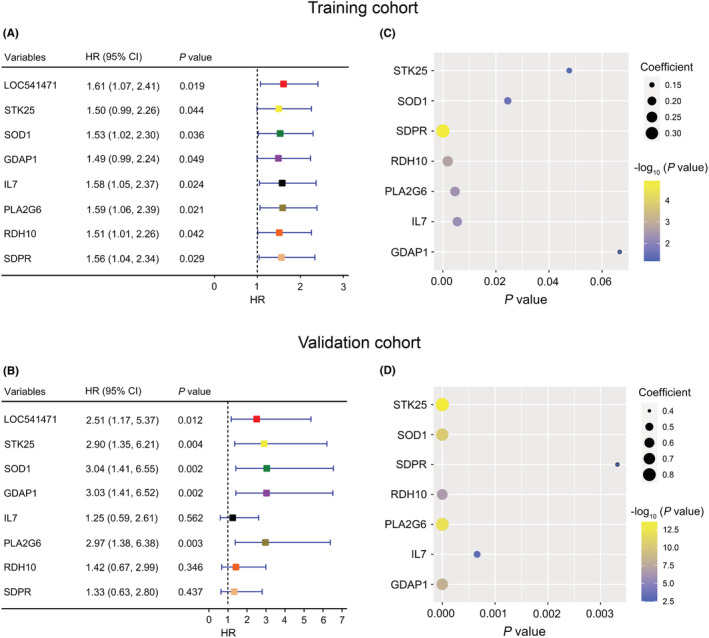
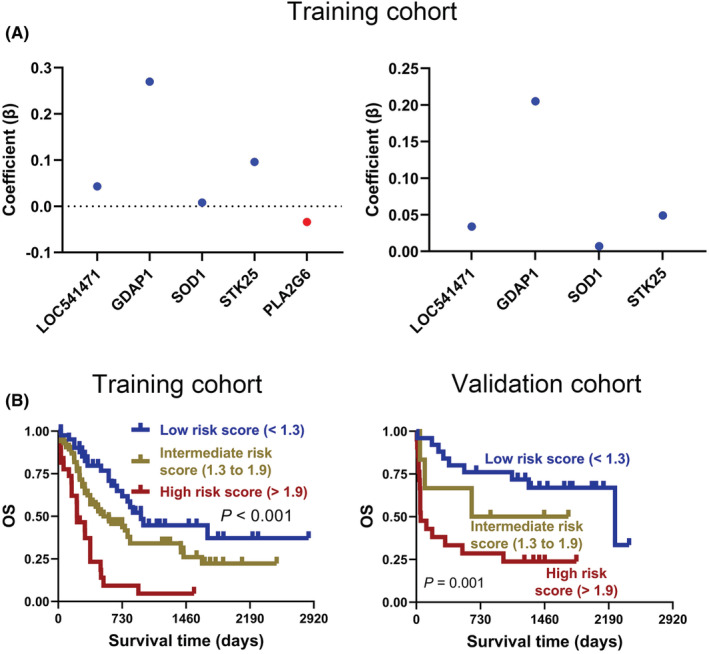
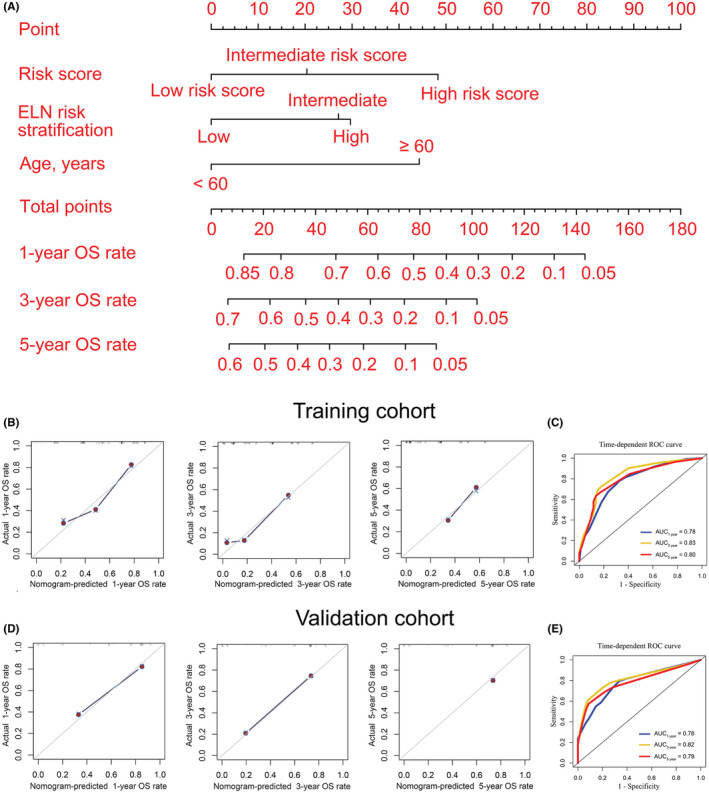
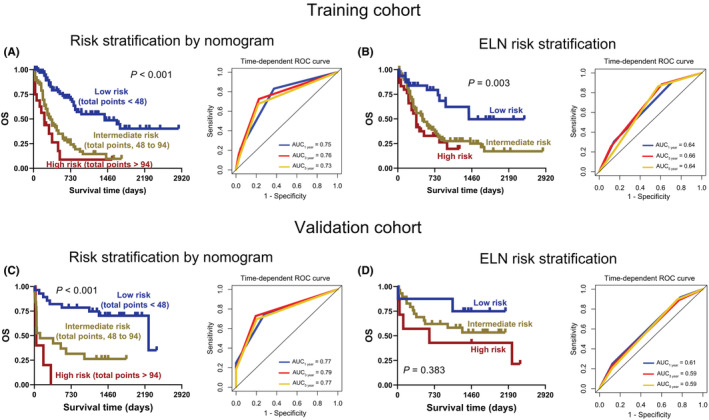
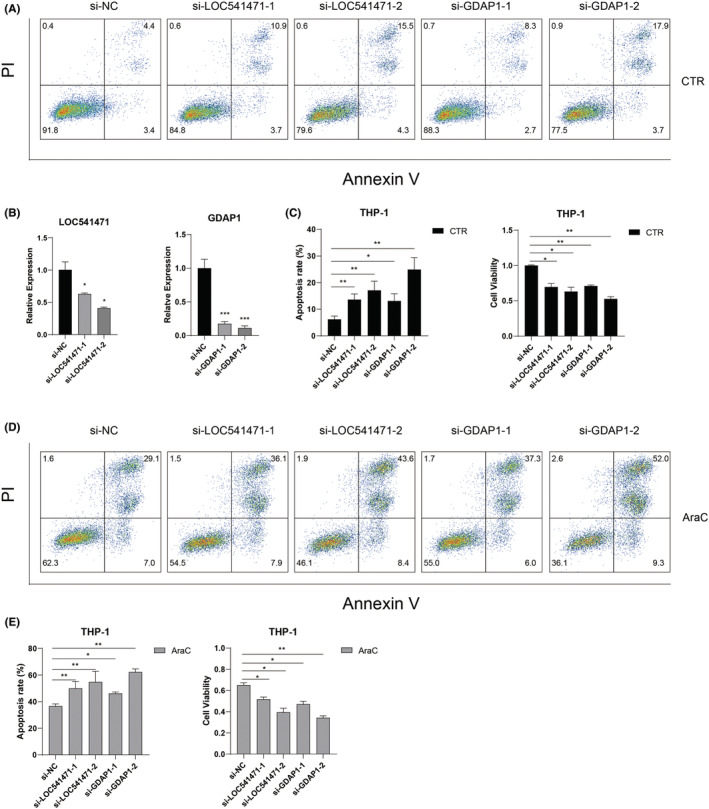
Results: Co-expression of 103 long non-coding RNAs (lncRNAs) and mRNAs in the red module that were positively correlated with European Leukemia Network (ELN) risk stratification and age was identified by weighted gene co-expression network analysis (WGCNA). After screening by uni- and multivariate Cox regression, Kaplan-Meier survival, and protein-protein interaction analysis, four genes including the lncRNA LOC541471, GDAP1, SOD1, and STK25 were incorporated into calculating a risk score from coefficients of the multivariate Cox regression model. Notably, GDAP1 expression was the greatest contributor to OS among the four genes. Interestingly, the risk score, ELN risk stratification, and age were independent prognostic factors for AML patients, and a nomogram model constructed with these factors could illustrate and personalize the 1-, 3-, and 5-year OS rates of AML patients. The calibration and time-dependent receiver operating characteristic curves (ROCs) suggested that the nomogram had a good predictive performance. Furthermore, new risk stratification was developed for AML patients based on the nomogram model. Importantly, knockdown of LOC541471, GDPA1, SOD1, or STK25 promoted apoptosis and inhibited the proliferation of THP-1 cells compared to controls.
Conclusions: High expression of LOC541471, GDAP1, SOD1, and STK25 may be biomarkers for risk stratification of AML patients, which may provide novel insight into evaluating prognosis, monitoring progression, and designing combinational targeted therapies.
Keywords: acute myeloid leukemia; apoptosis; biomarker; long non-coding RNA; nomogram; risk stratification.
© 2023 The Authors. Cancer Medicine published by John Wiley & Sons Ltd.
Conflict of interest statement
The authors declare that the research was conducted in the absence of any commercial or financial relationships that could be construed as a potential conflict of interest.
Figures
Similar articles
-
The role of long noncoding RNAs in the diagnosis, prognosis and therapeutic biomarkers of acute myeloid leukemia.Ann Hematol. 2024 Dec;103(12):4931-4942. doi: 10.1007/s00277-024-05987-3. Epub 2024 Sep 12. Ann Hematol. 2024. PMID: 39264436 Review.
-
The implication of lncRNA expression pattern and potential function of lncRNA RP4-576H24.2 in acute myeloid leukemia.Cancer Med. 2019 Dec;8(17):7143-7160. doi: 10.1002/cam4.2518. Epub 2019 Sep 30. Cancer Med. 2019. PMID: 31568697 Free PMC article.
-
LINC00649 underexpression is an adverse prognostic marker in acute myeloid leukemia.BMC Cancer. 2020 Sep 3;20(1):841. doi: 10.1186/s12885-020-07331-0. BMC Cancer. 2020. PMID: 32883226 Free PMC article.
-
Identification of circRNA-lncRNA-miRNA-mRNA Competitive Endogenous RNA Network as Novel Prognostic Markers for Acute Myeloid Leukemia.Genes (Basel). 2020 Jul 31;11(8):868. doi: 10.3390/genes11080868. Genes (Basel). 2020. PMID: 32751923 Free PMC article.
-
The tip of the iceberg-The roles of long noncoding RNAs in acute myeloid leukemia.Wiley Interdiscip Rev RNA. 2023 Nov-Dec;14(6):e1796. doi: 10.1002/wrna.1796. Epub 2023 Jun 2. Wiley Interdiscip Rev RNA. 2023. PMID: 37267628 Free PMC article. Review.
Cited by
-
Increased Co-Expression of PD-L1 and CTLA-4 Predicts Poor Overall Survival in Patients with Acute Myeloid Leukemia Following Allogeneic Hematopoietic Stem Cell Transplantation.Immunotargets Ther. 2025 Jan 20;14:25-33. doi: 10.2147/ITT.S500723. eCollection 2025. Immunotargets Ther. 2025. PMID: 39866547 Free PMC article.
-
Identification of a Complex Karyotype Signature with Clinical Implications in AML and MDS-EB Using Gene Expression Profiling.Cancers (Basel). 2023 Nov 4;15(21):5289. doi: 10.3390/cancers15215289. Cancers (Basel). 2023. PMID: 37958462 Free PMC article.
-
Exploring and clinical validation of prognostic significance and therapeutic implications of copper homeostasis-related gene dysregulation in acute myeloid leukemia.Ann Hematol. 2024 Aug;103(8):2797-2826. doi: 10.1007/s00277-024-05841-6. Epub 2024 Jun 15. Ann Hematol. 2024. PMID: 38879648
-
The role of long noncoding RNAs in the diagnosis, prognosis and therapeutic biomarkers of acute myeloid leukemia.Ann Hematol. 2024 Dec;103(12):4931-4942. doi: 10.1007/s00277-024-05987-3. Epub 2024 Sep 12. Ann Hematol. 2024. PMID: 39264436 Review.
-
Single-cell transcriptomics reveals over-activated reactive oxygen species pathway in hepatocytes in the development of hepatocellular carcinoma.Sci Rep. 2024 Nov 30;14(1):29809. doi: 10.1038/s41598-024-81481-0. Sci Rep. 2024. PMID: 39616235 Free PMC article.
References
-
- Dohner H, Weisdorf DJ, Bloomfield CD. Acute Myeloid Leukemia. N Engl J Med. 2015;373(12):1136‐1152. - PubMed
Publication types
MeSH terms
Substances
LinkOut - more resources
Full Text Sources
Medical
Miscellaneous
