. 2023 Aug;111(8):1135-1150.
doi: 10.1002/jbm.a.37496. Epub 2023 Jan 27.

Scaffolds containing GAG-mimetic cellulose sulfate promote TGF-β interaction and MSC Chondrogenesis over native GAGs

Affiliations

Scaffolds containing GAG-mimetic cellulose sulfate promote TGF-β interaction and MSC Chondrogenesis over native GAGs

Roseline Menezes et al. J Biomed Mater Res A. 2023 Aug.

Abstract

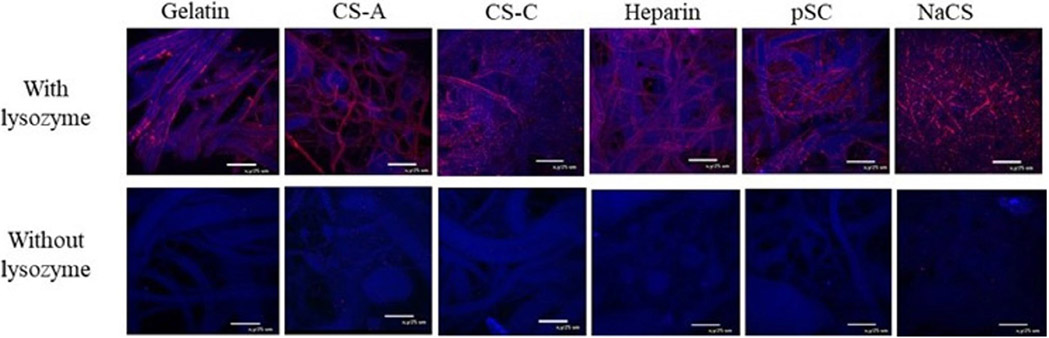
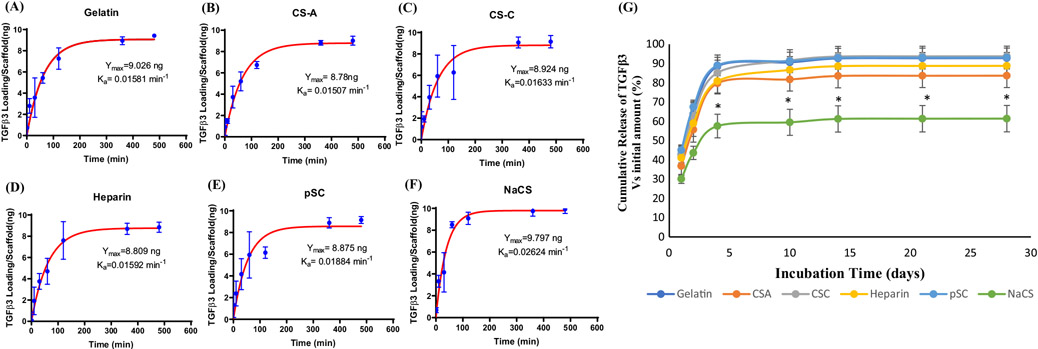
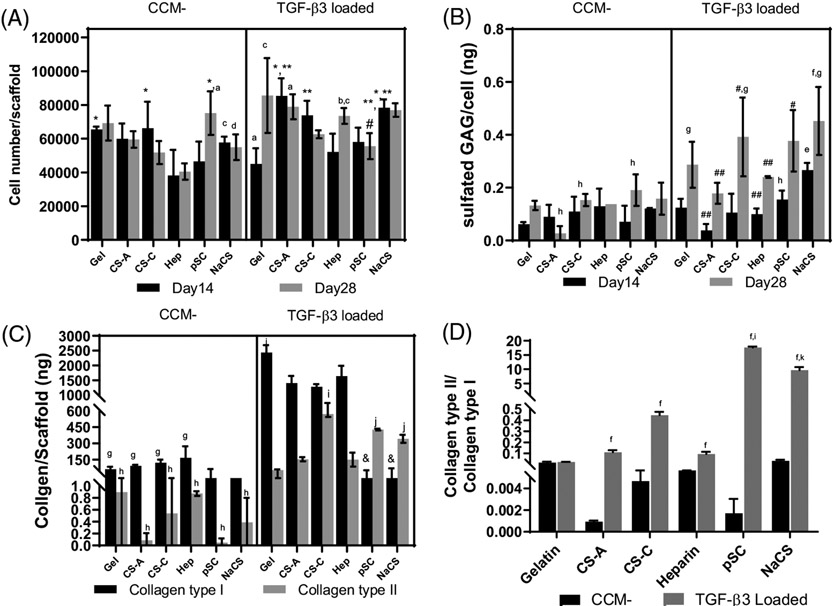
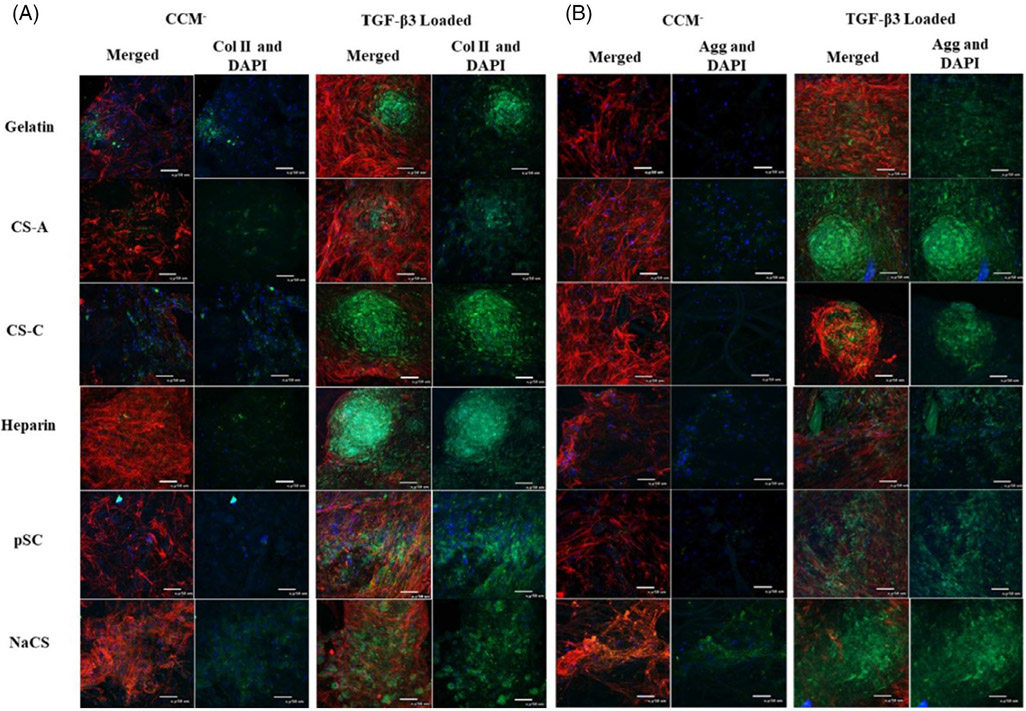
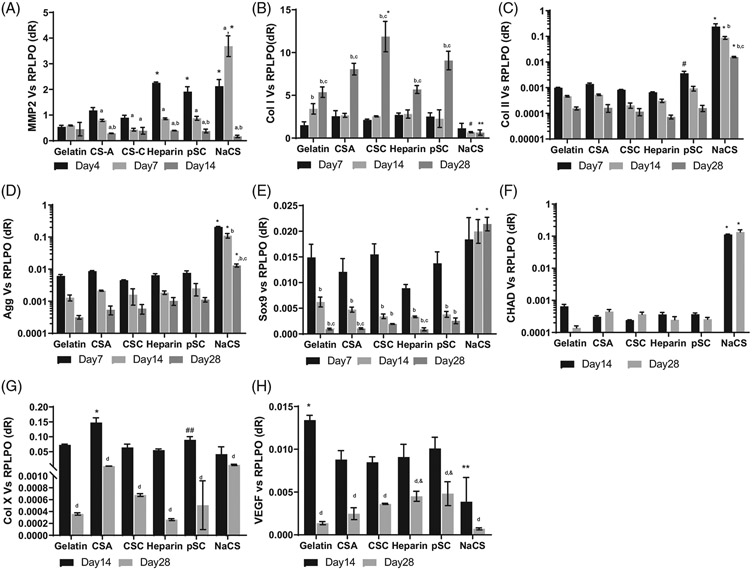
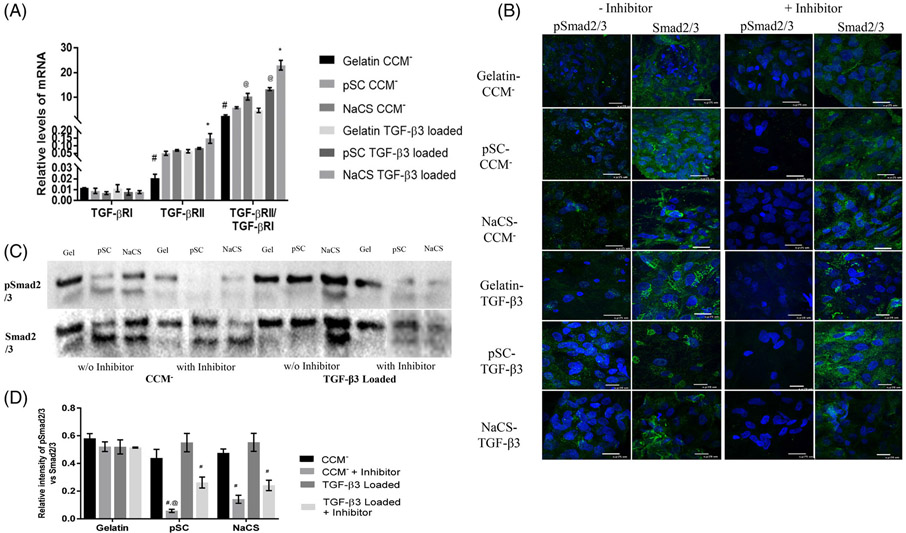
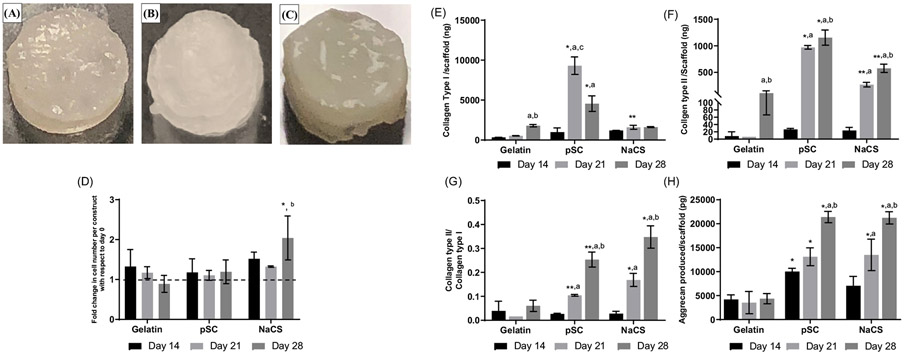
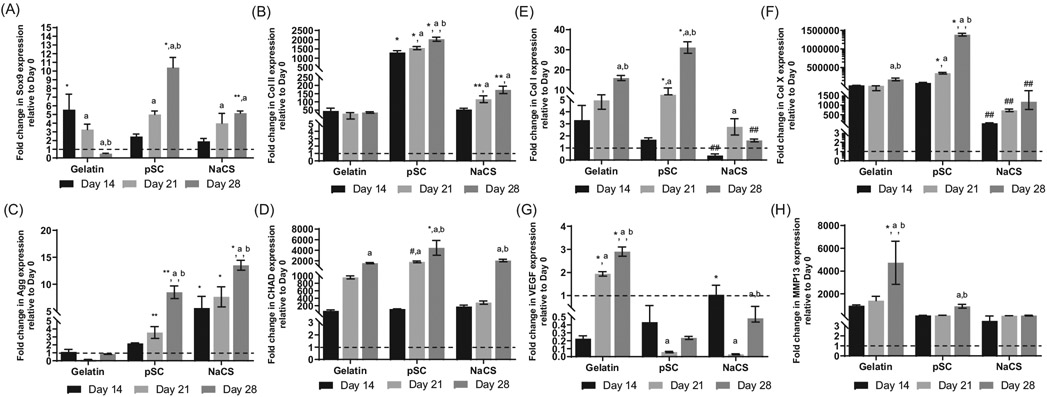
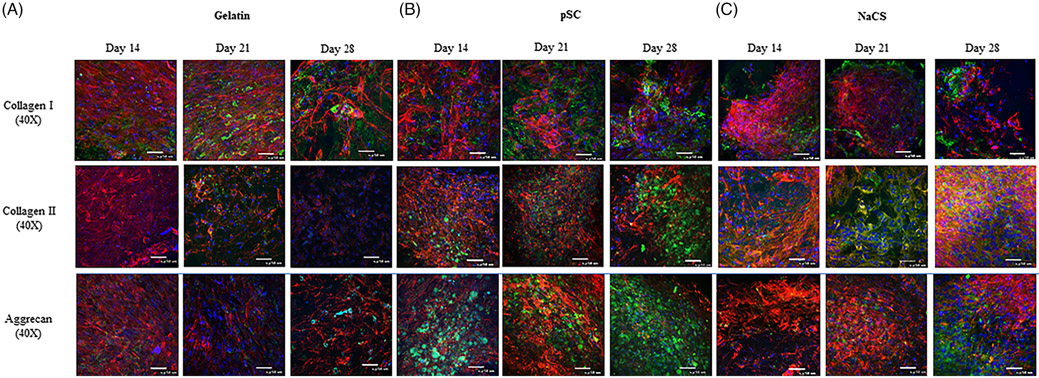
Cartilage tissue engineering strategies seek to repair damaged tissue using approaches that include scaffolds containing components of the native extracellular matrix (ECM). Articular cartilage consists of glycosaminoglycans (GAGs) which are known to sequester growth factors. In order to more closely mimic the native ECM, this study evaluated the chondrogenic differentiation of mesenchymal stem cells (MSCs), a promising cell source for cartilage regeneration, on fibrous scaffolds that contained the GAG-mimetic cellulose sulfate. The degree of sulfation was evaluated, examining partially sulfated cellulose (pSC) and fully sulfated cellulose (NaCS). Comparisons were made with scaffolds containing native GAGs (chondroitin sulfate A, chondroitin sulfate C and heparin). Transforming growth factor-beta3 (TGF-β3) sequestration, as measured by rate of association, was higher for sulfated cellulose-containing scaffolds as compared to native GAGs. In addition, TGF-β3 sequestration and retention over time was highest for NaCS-containing scaffolds. Sulfated cellulose-containing scaffolds loaded with TGF-β3 showed enhanced chondrogenesis as indicated by a higher Collagen Type II:I ratio over native GAGs. NaCS-containing scaffolds loaded with TGF-β3 had the highest expression of chondrogenic markers and a reduction of hypertrophic markers in dynamic loading conditions, which more closely mimic in vivo conditions. Studies also demonstrated that TGF-β3 mediated its effect through the Smad2/3 signaling pathway where the specificity of TGF-β receptor (TGF- βRI)-phosphorylated SMAD2/3 was verified with a receptor inhibitor. Therefore, studies demonstrate that scaffolds containing cellulose sulfate enhance TGF-β3-induced MSC chondrogenic differentiation and show promise for promoting cartilage tissue regeneration.

Keywords: cellulose; chondrogenesis; chondroitin sulfate; glycosaminoglycans; mesenchymal stem cells.


Figures

FIGURE 1
FIGURE 1
Confocal images of gelatin and gelatin scaffolds containing native GAGs and cellulose sulfate that were incubated with or without lysozyme-containing solution. Lysozyme (red) and scaffold fibers (blue), 60× magnification, 25 μm scale bar
FIGURE 2
FIGURE 2
Sequestration of TGF-β3 as a function of incubation time for (A) gelatin scaffolds and gelatin scaffolds containing (B) CS-A, (C) CS-C, (D) Heparin, (E) pSC and (F) NaCS (Values are Mean ± SD, n = 5 per group per time point). Ymax and Ka represent TGF-β3 at equilibria and association rate, respectively. (G) Cumulative release of TGF-β3 over 28 days in culture conditions from gelatin and gelatin containing CS-A, CS-C, Heparin, pSC and NaCS. (Values are Mean ± SD). *Significantly different from all other groups for each time point (p < .05, n = 5 per group per time point)
FIGURE 3
FIGURE 3
Cells cultured on gelatin (Gel) and gelatin scaffolds containing CS-A, CS-C, Heparin (Hep), pSC and NaCS with TGF-β3 loaded onto scaffolds cultured in CCM media (TGF-β3 loaded) or without TGF-β3 (CCM). (A) Cell number. (B) Sulfated GAGs produced per cell. (C) Production of collagens type I and II. (D) Ratio of collagen types II to I. *Significantly different from heparin at same time point and loading condition, **Significantly different from gelatin at same time point and loading condition, #Significantly different from CS-A at same time point and loading condition, ##Significantly different than NaCS group at same time point and loading condition, &Significantly lower than all scaffolds loaded with TGF-β3, aSignificantly different from CCM for corresponding scaffold groups at day 14, bSignificantly different from CCM for corresponding scaffold groups at day 28, cSignificantly different from corresponding scaffold groups loaded with TGF-β3 at day 14, dSignificantly different from corresponding scaffold groups loaded with TGF-β3 at day 28. (p < .05), eSignificantly different from CCM for all scaffold groups at day 14, fSignificantly different from CCM for all scaffold groups at day 28, gSignificantly different from all scaffold groups loaded with TGF-β3 at day 14, hSignificantly different from all scaffold groups loaded with TGF-β3 at day 28, iSignificantly higher than all groups with and without TGF-β3 loading, jSignificantly higher than Gel and CS-A and Hep groups with and without TGF-β3 loading, kSignificantly higher than gel and native GAG-containing scaffolds in both conditions (p < .05). (All values are Mean ± SD, n = 4 per group per time point for cell number and GAG production, n = 3 per group per time point for collagen production)
FIGURE 4
FIGURE 4
Confocal images of cells cultured on gelatin and gelatin scaffolds containing native GAGs and cellulose sulfate without TGF-β3 (CCM) or with TGF-β3 loading (TGF-β3 loaded) for 28 days in CCM. Immunostaining for (A) collagen type II (green) and (B) aggrecan (green). Actin (red) and nucleus (blue) for both A and B panels (40× magnification, scale bar is 50 μm)
FIGURE 5
FIGURE 5
Gene expression for cells on gelatin and gelatin containing native GAGs and cellulose sulfate scaffolds loaded with TGF-β3 in CCM media for 28 days. (A) MMP2, (B) Collagen I (Col I), (C) Collagen type II (Col II), (D) Aggrecan (Agg), (E) Sox 9, (F) Chondroadherin (CHAD), (G) Collagen type X (Col X), and (H) VEGF. *Significantly higher than all other groups at the time point, **Significantly lower than all other scaffolds at same time point, #Significantly different than gelatin and native GAGs groups, ##Significantly higher than CS-C, heparin and NaCS scaffold groups, &Significantly higher than NaCS scaffold group aSignificantly different than day 4, bSignificantly different than day 7, cSignificantly different than day 14, dSignificantly different from day 14 in same scaffold group (p < .05). All values are normalized to RPLPO represent Mean ± SD (n = 3 per group per time point)
FIGURE 6
FIGURE 6
(A) Gene expression of TGF- βRI and TGF- βRII normalized to RPLPO and ratio of TGF-βRII to TGF-βRI for cells cultured on gelatin and gelatin containing cellulose sulfate scaffolds with and without TGF- β3 loading. (Values are Mean ± SD, n = 3 per group) *Significantly higher than all other scaffolds in both conditions. #Significantly lower than all other scaffolds with and without TGF- β3 loading. @Significantly higher than pSC containing scaffolds without TGF- β3 loading. (p < .05) (B) Immunofluorescent staining of Smad2/3 (green) and pSmad2/3 (green) for cells cultured on gelatin and gelatin containing cellulose sulfate scaffolds loaded with and without TGF- β3 in presence or absence of TGF- βRI kinase inhibitor. Nuclei (DAPI, Blue). 100× Magnification (C) Western blot for protein expression of pSmad2/3 and total Smad2/3 (D) Relative intensity of pSmad2/3 normalized to Smad2/3 for cells cultured on gelatin and gelatin containing cellulose sulfate scaffolds with and without loaded TGF-β3 in presence or absence of TGF- βRI kinase inhibitor. (Values are Mean ± SD, n = 3 per group) #Significantly lower than cells cultured on the same scaffold w/o inhibitor. @Significantly lower than cells cultured on TGF- β3 loaded scaffold with inhibitor. (p < .05)
FIGURE 7
FIGURE 7
Cells cultured on scaffolds loaded with TGF-β3 and subjected to dynamic loading conditions in the bioreactor (a total of 28 days in culture - 14 days of static culture followed by 14 days of dynamic loading with perfusion) on (A) gelatin, (B) gelatin containing pSC scaffolds, and (C) gelatin containing NaCS scaffolds. Cells cultured on gelatin and gelatin scaffolds containing pSC and NaCS loaded with TGF-β3 in bioreactor. (D) Fold change in cell number with respect to day 0. (E) Collagen type I (Col I). (F) Collagen type II (Col II). (G) Ratio of collagen types II to I. (H) Aggrecan (Agg). *Significantly different than all other scaffolds at same time point, **Significantly higher than gelatin scaffold groups at same time point, aSignificantly different than day 14 in same scaffold group, bSignificantly different than day 21 in same scaffold group, cSignificantly different than day 28 in same scaffold group. (p < .05) (Values are Mean ± SD, n = 3 per group per time point)
FIGURE 8
FIGURE 8
Gene expression for cells cultured on scaffolds loaded with TGF-β3 and subjected to dynamic loading conditions in the bioreactor (a total of 28 days in culture - 14 days of static culture followed by 14 days of dynamic loading with perfusion) normalized to day 0 (after 14 days in static culture). (A) Sox9. (B) Collagen II (Col II). (C) Aggrecan (Agg). (D) Chondroadherin (CHAD). (E) Collagen I (Col I). (F) Collagen X (Col X). (G) VEGF. (H) MMP13. *Significantly higher than all other scaffold groups at same time point, **Significantly higher than gelatin group at the same time point, #Significantly higher than NaCS group at the same time point, ##Significantly lower than all other scaffolds at the same time point, aSignificantly different than day 14 in same scaffold group, bSignificantly different than day 21 in same scaffold group (p < .05). (Values are Mean ± SD, n = 3 per group per time point). Gene expression at each time point was normalized to gene expression at day 0
FIGURE 9
FIGURE 9
Immunofluoroscent confocal images of cells grown on (A) gelatin, (B) gelatin containing pSC, and (C) gelatin containing NaCS scaffolds loaded with TGF-β3 and cultured in the bioreactor for 28 days. Collagen type I, collagen type II and aggrecan (Green). F-actin (Red) and nucleus (Blue) (scale bar = 50 μm)

Similar articles

Cited by

References

    1. O'Brien FJ. Biomaterials & scaffolds for tissue engineering. Mater Today. 2011;14(3):88–95.
    1. McAdams TR, Mithoefer K, Scopp JM, Mandelbaum BR. Articular cartilage injury in athletes. Cartilage. 2010;1(3):165–179. - PMC - PubMed
    1. Sophia Fox AJ, Bedi A, Rodeo SA. The basic science of articular cartilage: structure, composition, and function. Sports Health. 2009;1(6):461–468. - PMC - PubMed
    1. Caldwell KL, Wang J. Cell-based articular cartilage repair: the link between development and regeneration. Osteoarthr Cartil. 2015;23(3):351–362. - PMC - PubMed
    1. Zhang L, Hu J, Athanasiou KA. The role of tissue engineering in articular cartilage repair and regeneration. Crit Rev Biomed Eng. 2009;37(1–2):1–57. - PMC - PubMed

Publication types

MeSH terms

LinkOut - more resources