. 2023 Feb 16;186(4):877-891.e14.
doi: 10.1016/j.cell.2023.01.002. Epub 2023 Jan 27.

Bacterial droplet-based single-cell RNA-seq reveals antibiotic-associated heterogeneous cellular states

Affiliations

Bacterial droplet-based single-cell RNA-seq reveals antibiotic-associated heterogeneous cellular states

Peijun Ma et al. Cell. .

Abstract

We introduce BacDrop, a highly scalable technology for bacterial single-cell RNA sequencing that has overcome many challenges hindering the development of scRNA-seq in bacteria. BacDrop can be applied to thousands to millions of cells from both gram-negative and gram-positive species. It features universal ribosomal RNA depletion and combinatorial barcodes that enable multiplexing and massively parallel sequencing. We applied BacDrop to study Klebsiella pneumoniae clinical isolates and to elucidate their heterogeneous responses to antibiotic stress. In an unperturbed population presumed to be homogeneous, we found within-population heterogeneity largely driven by the expression of mobile genetic elements that promote the evolution of antibiotic resistance. Under antibiotic perturbation, BacDrop revealed transcriptionally distinct subpopulations associated with different phenotypic outcomes including antibiotic persistence. BacDrop thus can capture cellular states that cannot be detected by bulk RNA-seq, which will unlock new microbiological insights into bacterial responses to perturbations and larger bacterial communities such as the microbiome.

Keywords: antibiotic persistence; antibiotic perturbation; antibiotic resistance; bacterial heterogeneity; bacterial single-cell RNA-seq; droplet; massively parallel sequencing.


Conflict of interest statement

Declaration of interests D.T.H., P.M., and H.M.A. have filed an U.S. Patent Application (application no. 17/819,034) based on this work.

Figures

Figure 1.
Figure 1.. BacDrop: a bacterial droplet-based massively parallel scRNA-seq technology.
(A) BacDrop workflow. Following cell fixation and permeabilization, rRNA and gDNA is depleted from cells in bulk. Then CB1 and UMIs are added to the 5’ end of cDNA via RT reactions (round 1 plate barcoding) in 96- or 384-well plates. After round 1 plate barcoding, all cells are pooled and cDNA is polyadenylated at the 3’ end using terminal transferase, followed by droplet generation and round 2 droplet barcoding. The 3’ poly-A tail of cDNA enables second strand synthesis using oligo-dT primers. Round 2 droplet barcoding is achieved via second strand cDNA synthesis and 4 capturing cycles by barcoded primers (on 10x gel beads) in droplets. The successfully captured cDNA contains UMIs, CB1 and CB2, as well as adaptor sequences at both 5’ and 3’ end. Each cell is identified by a combination of CB1 and CB2. (B) Scheme of two rounds of cell barcoding and library construction. The RT primer is composed of a partial primer binding sequence (PBS) for Illumina sequencing, UMI (8 bp), CB1 (13 bp), and 6-bp random sequence for RT priming. The 3’ of cDNA was polyadenylated in cells after RT. A specific number of cells (thousands to millions) were then encapsulated, followed by 2nd strand cDNA synthesis and round 2 barcoding in droplets to attach CB2 to the double-stranded cDNA. An adapter (SMRT) sequence was added to the polyA end of the cDNA to enable cDNA amplification. After cDNA purification and amplification, tagmentation and PCR enrichment was performed to generate Illumina sequencing libraries.
Figure 2.
Figure 2.. Validation and technical performance of BacDrop.
(A) rRNA depletion inside fixed and permeabilized cells significantly increases the percentage of total reads that align to mRNA in BacDrop libraries of K. pneumoniae. The average percentage of reads aligned to mRNA genes was calculated from 10 independent BacDrop libraries of K. pneumoniae (5 without rRNA depletion and 5 with rRNA depletion), and error bars were plotted as the standard deviation. (B) rRNA depletion does not affect transcriptional profiles. BacDrop libraries were constructed using in K. pneumoniae samples with or without rRNA depletion, and a linear regression model was fitted to the mRNA counts from each library (R2 = 0.81). (C) Cell fixation and permeabilization does not affect transcriptional profiles. Bulk RNA-seq results derived from Trizol-extracted RNA samples of K. pneumoniae versus RNA derived from fixed and permeabilized K. pneumoniae cells were highly correlated (R2 = 0.97). (D) Single-cell BacDrop results are highly correlated with bulk RNA-seq results (R2 = 0.91) when analyzed in bulk mode (without cell barcode extraction). (E) BacDrop has low barcode collision rates in an experiment where 2 million bacterial cells, mixed with K. pneumoniae and P. aeruginosa cells, were loaded into one 10x channel (~6 cells per droplet). About 2.8 % of the cells were assigned to two species, resulting in a 6.6% barcode collision rate. (F) BacDrop was performed on 4 different bacterial species including E. coli, K. pneumoniae, P. aeruginosa, and E. faecium. At the sequencing depth of 500 reads per cell, approximately 5,000 cells of E. faecium, 2,500 cells of E. coli, 1,000 cells of K. pneumoniae, and 300 cells of P. aeruginosa passed the analysis threshold (see methods). Uniform Manifold Approximation and Projection (UMAP) of this mixed population shows the separation of different species, colored by species identity. (G-I) Testing the sensitivity of BacDrop using three GFP strains of E. coli. The expression levels of gfp in these three E. coli strains were confirmed via flow cytometry (G). The mean numbers of gfp transcripts per cell were estimated via RT-qPCR (H). Three biological replicates were performed, and error bars were plotted as standard deviation. The two-tailed Student’s t-test was used for statistical analysis. (I) Roughly 3,300 cells from each gfp strain were mixed to create a heterogeneous population and a BacDrop library was generated. The gfp expression levels were calculated using log2-transformed value of transcript per 10,000 reads (log2 (TP10K+1)) per cell from the BacDrop results. Compared to the RT-qPCR results (H), BacDrop showed a good sensitivity for the gfp.high strain. The difference between gfp.mid and gfp.low is less distinct but statistically significant (p < 0.005). The Wilcoxon signed-ranks test was used for the statistical analysis. See also Figure S1.
Figure 3.
Figure 3.. Validating BacDrop’s ability to distinguish subpopulations based on distinct responses to different antibiotic treatments.
(A) Creation of a BacDrop library containing cells of the same bacterial strain under 4 different conditions, including treatment of meropenem, ciprofloxacin, gentamicin, and untreated control. Cells were collected and processed separately until after round 1 plate barcoding. The four samples were then pooled for round 2 droplet barcoding and library construction. Two biological replicates were performed. (B) Bulk RNA-seq results of cells exposed to the same antibiotic conditions as in (A). The abundance for each treated condition and comparison between the treated and untreated cultures are shown as well as significantly up- and down-regulated genes from each treatment (performed in triplicates). (C) UMAP plot based on the original identity of the 6 samples treated with meropenem (M and its replicate M.2), ciprofloxacin (C and its replicate C.2), and gentamicin (G and its replicate G.2). (D) Unsupervised UMAP showed three clusters with significantly (p < 0.05) higher expression of genes in the SOS-response pathway, heat-shock response, and genes encoding an IS903B transposase (MGE). (E) No strong batch effect was observed between the two biological replicates with the same treatment conditions. (F) Expression of a representative gene from each cluster was highlighted on the UMAP. The purple color bars represent the normalized expression of a gene across all cells analyzed. See also Figure S2.
Figure 4.
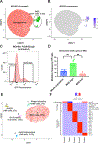
Figure 4.. BacDrop reveals within population heterogeneity driven largely by MGE.
(A and B) In untreated culture of MGH66, a population showing high-level expression of IS903B transposase (MGE, 4.5%; green) was detected. (C and D) Flow cytometry of reporter MGH66 strains expressing GFP driven by the promoter of IS903B (MGH66:PIS903B:gfp) shows a heterogenous expression pattern. The MGE.high population (~10% of the whole population) and MGE.low population (~10% of the whole population) were sorted into MHB medium without antibiotics, and mutation frequencies (D) were measured under meropenem treatment. Experiments in panel (C-D) were repeated with nine biological replicates. Error bars were plotted as the standard deviation. The Student’s t-test was used for statistical analysis. (E and F) MGE-driven subpopulations were detected in another K. pneumoniae clinical isolate BIDMC35. UMAP (E) and heatmap (F) shows 4 subpopulations differing from the majority population (Cluster 0; red) of BIDMC35. Clusters 2, 3, and 4 are each driven by the high expression of a different transposase gene. In cluster 1, nearly all highly expressed genes belong to a prophage in BIDMC35 genome. Expression levels of all genes are normalized to expression in Cluster 0 (F). See also Figure S3–S4.
Figure 5.
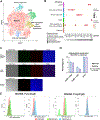
Figure 5.. BacDrop reveals heterogeneous responses to meropenem exposure.
(A) Besides the subpopulation highly expressing the IS903B transposase genes (MGE), meropenem treatment induced heterogenous responses, including a stress-response subpopulation, a cell wall synthesis subpopulation, a DNA replication and cell wall synthesis subpopulation, and a cspD-expressing subpopulation. (B) Dot plot showing the expression of genes that are significantly different among clusters and the percentage of cells expressing these genes in each cluster. (C) Validation of subpopulations identified in the meropenem-treated MGH66 using RNA FISH with double marker genes from the “stress response” subpopulation (rseB (green)+ yidC (red)) and “cspD expressing” subpopulation (cspD (green) + rihC (red)). A probe targeting the housekeeping gene ef-tu was used as the positive control to show that more than 99% cells were successfully permeabilizated and hybridized. Subpopulations co-expressing double marker genes were identified. The scale bar size is 15 μm. (D) Across 20 fields of view, the RNA FISH results showed that ~1% of cells co-expressed cspD and rihC, and ~10% of cells co-expressed rseB + yidC. These results were statistically consistent with the BacDrop result in which ~0.6% of cells co-expressed cspD and rihC, and ~8% cells co-expressed rseB + yidC. Two-way ANOVA was performed for the statistically analysis (p = 0.348). This experiment was repeated twice, and data was plotted separated from two replicates. (E) Flow cytometry of reporter MGH66 strains expressing GFP driven by the promoter of yhcN (MGH66:PyhcN:gfp; left) or cspD (MGH66:PcspD:gfp; right) shows a heterogenous response to meropenem (green) but not to ciprofloxacin (blue) treatment, relative to untreated control (red). See also Figure S5 and Table 1.
Figure 6.
Figure 6.. cspD-expressing cluster was enriched with persister cells.
(A) MGH66:PcspD:gfp cells were analyzed by FACS at time 0 and 30 minutes after exposure to meropenem (2μg/mL). After 30 minutes, live cells from GFP-low and GFP-high subpopulations were identified and sorted. (B) GFP-low and GFP-high subpopulations sorted from meropenem-treated MGH66:PcspD:gfp cells differed in their response to meropenem. GFP-low and GFP-high subpopulations were sorted directly into media with no antibiotic or with meropenem (2 μg/mL). Samples were then taken over time and plated on solid agar to enumerate CFU. Persisters only emerged from the GFP-high subpopulation. The limit of detection is indicated by black dashed line. Three asterisks from the treated GFP-low subpopulation indicate no persister was observed. (C-D) Overexpression of cspD in MGH66 increased numbers of persisters but did not affect the susceptibility of meropenem. cspD driven by the arabinose inducible promoter pBAD was transformed into MGH66. (C) Induction of cspD with 1% arabinose did not affect the minimal inhibitory concentration (MIC) of meropenem. (D) When cspD was induced with 1% arabinose and treated with meropenem at 2 μg/mL (purple), the numbers of persister cells were significantly greater at 6- and 24-hour time points (asterisk shows significance at 6-hour and 24-hour time points) compared to the culture without arabinose induction under 2 μg/mL meropenem treatment (blue). All experiments were repeated three times. Error bars were plotted as the standard deviation. The Student’s t-test was used for statistical analysis. See also Figure S6.

Comment in

Similar articles

Cited by

References

    1. Macosko EZ et al. Highly Parallel Genome-wide Expression Profiling of Individual Cells Using Nanoliter Droplets. Cell 161, 1202–1214, doi:10.1016/j.cell.2015.05.002 (2015). - DOI - PMC - PubMed
    1. Shalek AK et al. Single-cell transcriptomics reveals bimodality in expression and splicing in immune cells. Nature 498, 236–240, doi:10.1038/nature12172 (2013). - DOI - PMC - PubMed
    1. Shalek AK et al. Single-cell RNA-seq reveals dynamic paracrine control of cellular variation. Nature 510, 363–369, doi:10.1038/nature13437 (2014). - DOI - PMC - PubMed
    1. Shapiro E, Biezuner T & Linnarsson S Single-cell sequencing-based technologies will revolutionize whole-organism science. Nat Rev Genet 14, 618–630, doi:10.1038/nrg3542 (2013). - DOI - PubMed
    1. Zeisel A et al. Brain structure. Cell types in the mouse cortex and hippocampus revealed by single-cell RNA-seq. Science 347, 1138–1142, doi:10.1126/science.aaa1934 (2015). - DOI - PubMed

Publication types